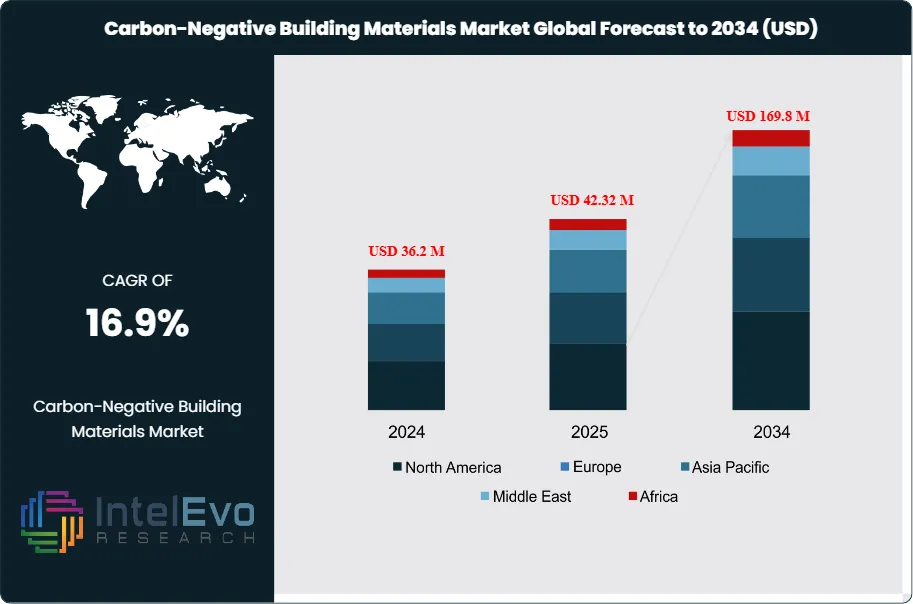
The Global Carbon-Negative Building Materials Market size is expected to be worth around USD 169.8 Million by 2034, up from USD 36.2 Million in 2024, growing at a CAGR of 16.9% during the forecast period from 2024 to 2034. The growth is driven by rising demand for sustainable construction practices, stricter carbon reduction targets, and innovations in bio-based and recycled materials. With governments, architects, and developers focusing on green infrastructure, carbon-negative building materials are poised to become a cornerstone of the future construction ecosystem.
The Global Carbon-Negative Building Materials Market encompasses a range of products designed to absorb more carbon dioxide than they emit during their lifecycle. These materials include innovative options such as carbon-sequestering concrete, bio-based insulation, and recycled components. The market is currently driven by a growing emphasis on sustainable construction practices, stringent regulations targeting carbon emissions, and heightened awareness of climate change impacts. The rising trend towards green buildings, supported by governmental policies and incentives, has catalyzed the adoption of these materials, making them a viable choice for environmentally conscious builders and consumers.
Several key drivers underpin the growth dynamics of the carbon-negative building materials market. First, the increasing awareness of climate change and environmental degradation has prompted both consumers and businesses to seek sustainable alternatives in construction. Additionally, government initiatives aimed at reducing carbon footprints and promoting energy efficiency are fostering market growth. Technological advancements in material science have also enabled the development of more effective carbon-negative products. Moreover, investments in research and development (R&D) are leading to innovations that enhance the performance and applicability of these materials, thereby broadening their market appeal.
North America and Europe are currently the leading markets for carbon-negative building materials, largely due to stringent environmental regulations and a proactive approach to sustainability. In North America, the U.S. has seen a rise in green building projects, thanks to incentives and certifications like LEED (Leadership in Energy and Environmental Design). In Europe, nations such as Sweden and Germany are at the forefront of adopting carbon-negative solutions, driven by national policies aimed at carbon neutrality. The Asia-Pacific region, particularly countries like Japan and China, is also expected to witness significant growth due to urbanization and increasing investment in green infrastructure.
The COVID-19 pandemic has impacted the carbon-negative building materials market, albeit in complex ways. While construction activities were initially disrupted, the crisis has led to a renewed focus on health, sustainability, and resilience in the built environment. Many stakeholders are now prioritizing eco-friendly materials as part of recovery efforts. This shift has accelerated interest in carbon-negative products, positioning the market for a rebound and subsequent growth as construction resumes and adapts to new norms post-pandemic.
Key Takeaways
Market Growth: The carbon-negative building materials market is expected to reach USD $169.8 million by 2034, growing at a robust CAGR of 16.95%, indicating strong market expansion.
Material Type Analysis: The carbon-sequestering concrete segment is anticipated to lead the market due to its effectiveness in reducing greenhouse gas emissions while providing structural integrity. Its adoption is driven by increasing regulations and sustainability initiatives in construction.
Application Analysis: Residential buildings are projected to hold the largest share in the market, as homeowners increasingly prioritize eco-friendly materials. The shift toward sustainable living is driving demand for carbon-negative solutions in new home constructions and renovations.
Driver: The growing awareness of climate change and government regulations aimed at reducing carbon footprints are primary drivers. Stakeholders in construction are increasingly investing in sustainable materials to meet environmental standards and consumer expectations.
Restraint: High production costs associated with carbon-negative materials may limit their widespread adoption. The initial investment required for sustainable options can deter some builders and contractors from switching to greener alternatives.
Opportunity: There is a significant opportunity for innovation and expansion in emerging markets, particularly in Asia-Pacific. Increased urbanization and a focus on green infrastructure present lucrative avenues for growth in carbon-negative building materials.
Trend: The trend toward sustainable construction practices continues to gain momentum, with an increasing number of certifications and standards promoting the use of carbon-negative materials.
Regional Analysis: North America and Europe are expected to dominate the market, driven by stringent environmental regulations and a strong focus on sustainability in the construction industry.
Material Type:
The carbon-negative building materials market is primarily segmented by material type, which includes carbon-sequestering concrete, bio-based insulation, recycled materials, and low carbon steel. Carbon-sequestering concrete stands out due to its ability to absorb CO2 during its curing process, making it a leading choice for sustainable construction. Bio-based insulation, derived from natural materials, offers thermal efficiency while minimizing environmental impact. Recycled materials, often sourced from industrial waste, contribute to circular economy practices by reducing landfill waste. Low carbon steel is also gaining traction for its reduced emissions during production compared to conventional steel. This variety allows builders to choose suitable materials based on project requirements, regulatory standards, and sustainability goals.
Application:
The application segment of the carbon-negative building materials market encompasses residential buildings, commercial buildings, industrial structures, and infrastructure projects. Residential buildings are projected to lead in market share, driven by growing consumer demand for sustainable living environments. The commercial sector is also witnessing increased adoption as businesses prioritize eco-friendly materials to enhance their corporate social responsibility profiles. Industrial structures are increasingly using carbon-negative materials in response to regulatory pressures and sustainability commitments. Infrastructure projects, such as roads and bridges, are integrating these materials to comply with environmental standards and improve long-term performance. Each application showcases the versatility and adaptability of carbon-negative materials across diverse construction needs, supporting a shift towards greener construction practices.
End-User:
The end-user segment of the carbon-negative building materials market includes construction companies, architects and designers, government agencies, and homeowners. Construction companies are the primary drivers of demand, as they seek materials that meet sustainability criteria and comply with regulations. Architects and designers play a crucial role in specifying these materials to align with modern design principles that emphasize eco-friendliness. Government agencies are increasingly mandating the use of sustainable materials in public infrastructure projects, further bolstering market growth. Homeowners are also becoming influential consumers, prioritizing green building practices in their renovations and new constructions. This diverse range of end-users highlights the widespread acceptance and integration of carbon-negative materials in contemporary construction practices.
Region Analysis:
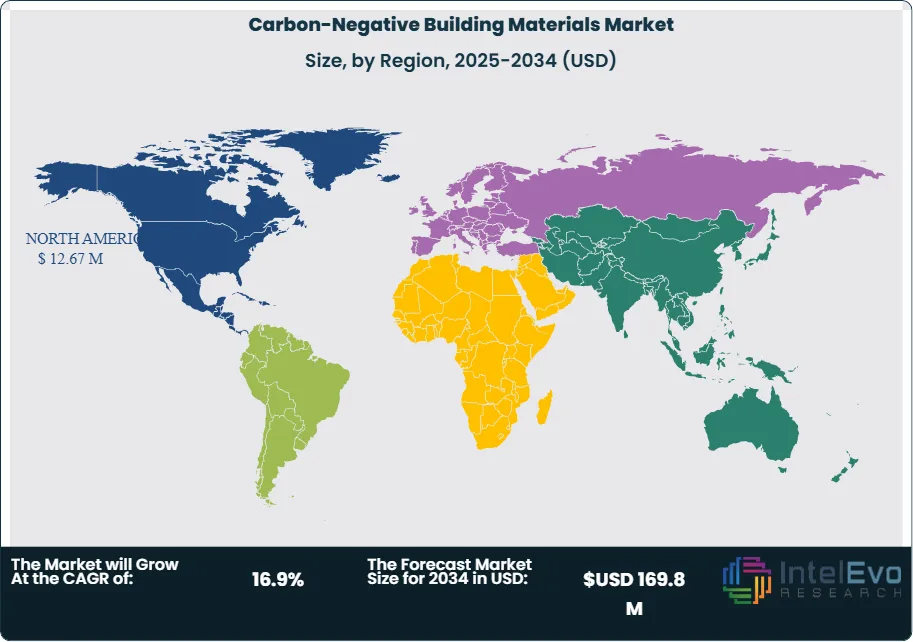
North America Leads With 35% Market Share In The Carbon-Negative Building Materials Market: North America holds the largest market share in the carbon-negative building materials market, accounting for approximately 35%. This dominance can be attributed to stringent environmental regulations and a robust framework of incentives promoting sustainable building practices. The U.S. has established several certifications, such as LEED (Leadership in Energy and Environmental Design), which encourage the adoption of eco-friendly materials. Furthermore, the growing public awareness of climate change and its impacts has propelled construction companies to seek sustainable alternatives. Major players in the construction industry are increasingly integrating carbon-negative solutions into their projects, driven by both consumer demand and corporate sustainability goals. In Canada, government initiatives further support the shift towards green construction, emphasizing energy efficiency and environmental responsibility.
The Asia-Pacific region is recognized as the fastest-growing market for carbon-negative building materials, with significant growth potential driven by rapid urbanization and increasing infrastructure development. Countries such as China and India are experiencing a surge in construction activities, fueled by rising populations and economic growth. Governments in these countries are actively promoting sustainable building practices through policies and financial incentives, creating a favorable environment for carbon-negative materials. Moreover, heightened awareness of environmental issues among consumers is prompting builders to consider greener options. The region's increasing investment in smart cities and green infrastructure projects underscores the shift towards sustainability, positioning Asia-Pacific as a pivotal market in the global transition to eco-friendly construction. Meanwhile, Europe continues to maintain a significant share, driven by ambitious climate targets and a strong commitment to sustainability. Latin America and the Middle East and Africa are also gradually adopting carbon-negative practices, albeit at a slower pace, reflecting their unique economic and regulatory challenges.
By Material Type (Carbon-Negative Concrete, Carbon-Negative Bricks & Blocks, Hempcrete & Bio-based Materials, Recycled & Upcycled Materials, Others), By Technology (Carbon Capture & Utilization (CCU), Carbon Sequestration Materials, Bio-Based Innovations, Recycling & Circular Economy Technologies), By End-User: (Construction Companies, Architects & Designers, Government Agencies, Homeowners), By Application (Residential Buildings, Commercial Buildings, Industrial Construction, Public Infrastructure)
Research Methodology
Primary Research- 100 Interviews of Stakeholders
Secondary Research
Desk Research
Regional scope
North America (United States, Canada, Mexico)
Latin America (Brazil, Argentina, Columbia)
East Asia And Pacific (China, Japan, South Korea, Australia, Cambodia, Fiji, Indonesia)
Sea And South Asia (India, Singapore, Thailand, Taiwan, Malaysia)
Eastern Europe (Poland, Russia, Czech Republic, Romania)
Western Europe (Germany, U.K., France, Spain, Itlay)
Middle East & Africa (GCC Countries, Egypt, Nigeria, South Africa, Israel)
Competitive Landscape
CarbonCure Technologies Inc., CEMEX S.A.B. de C.V., LafargeHolcim Ltd., BASF SE, HeidelbergCement AG, Blue Planet Ltd., Carbon Clean Solutions Limited, Nexii Building Solutions Inc., Katerra Inc., Skanska AB, Ecovative Design LLC, Element 25 Limited, Sika AG, Aggregate Industries, Lafarge U.S., Carbon8 Systems Ltd., Renewable Energy Group Inc., BioMason, Greencastle Associates, TerraCO2 Technology LLC, Hempitecture Inc., Solidia Technologies, Calera Corporation, Made of Air GmbH, C-Crete Technologies, Basilisk Self-Healing Concrete, Carbicrete Inc., Holcim Group (LafargeHolcim), Novacem Ltd., Green Building Council Partners
Customization Scope
Customization for segments, region/country-level will be provided. Moreover, additional customization can be done based on the requirements.
Pricing and Purchase Options
Avail customized purchase options to meet your exact research needs. We have three licenses to opt for: Single User License, Multi-User License (Up to 5 Users), Corporate Use License (Unlimited User and Printable PDF).
TABLE OF CONTENTS
1. EXECUTIVE SUMMARY
1.1. MARKET SNAPSHOT
1.2. KEY FINDINGS & INSIGHTS
1.3. ANALYST RECOMMENDATIONS
1.4. FUTURE OUTLOOK
2. RESEARCH METHODOLOGY
2.1. MARKET DEFINITION & SCOPE
2.2. RESEARCH OBJECTIVES: PRIMARY & SECONDARY DATA SOURCES
2.3. DATA COLLECTION SOURCES
2.3.1. COVERAGE OF 100+ PRIMARY RESEARCH/CONSULTATION CALLS WITH INDUSTRY STAKEHOLDERS
FIGURE 17 NORTH AMERICA CARBON-NEGATIVE BUILDING MATERIALS CURRENT AND FUTURE TYPE ANALYSIS, 2025–2034, (USD MILLION)
FIGURE 18 NORTH AMERICA CARBON-NEGATIVE BUILDING MATERIALS CURRENT AND FUTURE END USER ANALYSIS, 2025–2034, (USD MILLION)
FIGURE 19 MARKET SHARE BY COUNTRY
FIGURE 20 LATIN AMERICA CARBON-NEGATIVE BUILDING MATERIALS CURRENT AND FUTURE TYPE ANALYSIS, 2025–2034, (USD MILLION)
FIGURE 21 LATIN AMERICA CARBON-NEGATIVE BUILDING MATERIALS CURRENT AND FUTURE END USER ANALYSIS, 2025–2034, (USD MILLION)
FIGURE 22 MARKET SHARE BY COUNTRY
FIGURE 23 EASTERN EUROPE CARBON-NEGATIVE BUILDING MATERIALS CURRENT AND FUTURE TYPE ANALYSIS, 2025–2034, (USD MILLION)
FIGURE 24 EASTERN EUROPE CARBON-NEGATIVE BUILDING MATERIALS CURRENT AND FUTURE END USER ANALYSIS, 2025–2034, (USD MILLION)
FIGURE 25 MARKET SHARE BY COUNTRY
FIGURE 26 WESTERN EUROPE CARBON-NEGATIVE BUILDING MATERIALS CURRENT AND FUTURE TYPE ANALYSIS, 2025–2034, (USD MILLION)
FIGURE 27 WESTERN EUROPE CARBON-NEGATIVE BUILDING MATERIALS CURRENT AND FUTURE END USER ANALYSIS, 2025–2034, (USD MILLION)
FIGURE 28 MARKET SHARE BY COUNTRY
FIGURE 29 EAST ASIA AND PACIFIC CARBON-NEGATIVE BUILDING MATERIALS CURRENT AND FUTURE TYPE ANALYSIS, 2025–2034, (USD MILLION)
FIGURE 30 EAST ASIA AND PACIFIC CARBON-NEGATIVE BUILDING MATERIALS CURRENT AND FUTURE END USER ANALYSIS, 2025–2034, (USD MILLION)
FIGURE 31 MARKET SHARE BY COUNTRY
FIGURE 32 SEA AND SOUTH ASIA CARBON-NEGATIVE BUILDING MATERIALS CURRENT AND FUTURE TYPE ANALYSIS, 2025–2034, (USD MILLION)
FIGURE 33 SEA AND SOUTH ASIA CARBON-NEGATIVE BUILDING MATERIALS CURRENT AND FUTURE END USER ANALYSIS, 2025–2034, (USD MILLION)
FIGURE 34 MARKET SHARE BY COUNTRY
FIGURE 35 MIDDLE EAST AND AFRICA CARBON-NEGATIVE BUILDING MATERIALS CURRENT AND FUTURE TYPE ANALYSIS, 2025–2034, (USD MILLION)
FIGURE 36 MIDDLE EAST AND AFRICA CARBON-NEGATIVE BUILDING MATERIALS CURRENT AND FUTURE END USER ANALYSIS, 2025–2034, (USD MILLION)
FIGURE 37 NORTH AMERICA CARBON-NEGATIVE BUILDING MATERIALS CURRENT AND FUTURE MARKET VOLUME SHARE REGIONAL ANALYSIS, 2025–2034, (USD MILLION)
FIGURE 38 U.S. CARBON-NEGATIVE BUILDING MATERIALS CURRENT AND FUTURE TYPE ANALYSIS, 2025–2034, (USD MILLION)
FIGURE 39 U.S. CARBON-NEGATIVE BUILDING MATERIALS CURRENT AND FUTURE END USER ANALYSIS, 2025–2034, (USD MILLION)
FIGURE 40 CANADA CARBON-NEGATIVE BUILDING MATERIALS CURRENT AND FUTURE TYPE ANALYSIS, 2025–2034, (USD MILLION)
FIGURE 41 CANADA CARBON-NEGATIVE BUILDING MATERIALS CURRENT AND FUTURE END USER ANALYSIS, 2025–2034, (USD MILLION)
FIGURE 42 LATIN AMERICA CARBON-NEGATIVE BUILDING MATERIALS CURRENT AND FUTURE MARKET VOLUME SHARE REGIONAL ANALYSIS, 2025–2034, (USD MILLION)
FIGURE 43 MEXICO CARBON-NEGATIVE BUILDING MATERIALS CURRENT AND FUTURE TYPE ANALYSIS, 2025–2034, (USD MILLION)
FIGURE 44 MEXICO CARBON-NEGATIVE BUILDING MATERIALS CURRENT AND FUTURE END USER ANALYSIS, 2025–2034, (USD MILLION)
FIGURE 45 BRAZIL CARBON-NEGATIVE BUILDING MATERIALS CURRENT AND FUTURE TYPE ANALYSIS, 2025–2034, (USD MILLION)
FIGURE 46 BRAZIL CARBON-NEGATIVE BUILDING MATERIALS CURRENT AND FUTURE END USER ANALYSIS, 2025–2034, (USD MILLION)
FIGURE 47 ARGENTINA CARBON-NEGATIVE BUILDING MATERIALS CURRENT AND FUTURE TYPE ANALYSIS, 2025–2034, (USD MILLION)
FIGURE 48 ARGENTINA CARBON-NEGATIVE BUILDING MATERIALS CURRENT AND FUTURE END USER ANALYSIS, 2025–2034, (USD MILLION)
FIGURE 49 COLUMBIA CARBON-NEGATIVE BUILDING MATERIALS CURRENT AND FUTURE TYPE ANALYSIS, 2025–2034, (USD MILLION)
FIGURE 50 COLUMBIA CARBON-NEGATIVE BUILDING MATERIALS CURRENT AND FUTURE END USER ANALYSIS, 2025–2034, (USD MILLION)
FIGURE 51 REST OF LATIN AMERICA CARBON-NEGATIVE BUILDING MATERIALS CURRENT AND FUTURE TYPE ANALYSIS, 2025–2034, (USD MILLION)
FIGURE 52 REST OF LATIN AMERICA CARBON-NEGATIVE BUILDING MATERIALS CURRENT AND FUTURE END USER ANALYSIS, 2025–2034, (USD MILLION)
FIGURE 53 EASTERN EUROPE CARBON-NEGATIVE BUILDING MATERIALS CURRENT AND FUTURE MARKET VOLUME SHARE REGIONAL ANALYSIS, 2025–2034, (USD MILLION)
FIGURE 54 POLAND CARBON-NEGATIVE BUILDING MATERIALS CURRENT AND FUTURE TYPE ANALYSIS, 2025–2034, (USD MILLION)
FIGURE 55 POLAND CARBON-NEGATIVE BUILDING MATERIALS CURRENT AND FUTURE END USER ANALYSIS, 2025–2034, (USD MILLION)
FIGURE 56 RUSSIA CARBON-NEGATIVE BUILDING MATERIALS CURRENT AND FUTURE TYPE ANALYSIS, 2025–2034, (USD MILLION)
FIGURE 57 RUSSIA CARBON-NEGATIVE BUILDING MATERIALS CURRENT AND FUTURE END USER ANALYSIS, 2025–2034, (USD MILLION)
FIGURE 58 CZECH REPUBLIC CARBON-NEGATIVE BUILDING MATERIALS CURRENT AND FUTURE TYPE ANALYSIS, 2025–2034, (USD MILLION)
FIGURE 59 CZECH REPUBLIC CARBON-NEGATIVE BUILDING MATERIALS CURRENT AND FUTURE END USER ANALYSIS, 2025–2034, (USD MILLION)
FIGURE 60 ROMANIA CARBON-NEGATIVE BUILDING MATERIALS CURRENT AND FUTURE TYPE ANALYSIS, 2025–2034, (USD MILLION)
FIGURE 61 ROMANIA CARBON-NEGATIVE BUILDING MATERIALS CURRENT AND FUTURE END USER ANALYSIS, 2025–2034, (USD MILLION)
FIGURE 62 REST OF EASTERN EUROPE CARBON-NEGATIVE BUILDING MATERIALS CURRENT AND FUTURE TYPE ANALYSIS, 2025–2034, (USD MILLION)
FIGURE 63 REST OF EASTERN EUROPE CARBON-NEGATIVE BUILDING MATERIALS CURRENT AND FUTURE END USER ANALYSIS, 2025–2034, (USD MILLION)
FIGURE 64 WESTERN EUROPE CARBON-NEGATIVE BUILDING MATERIALS CURRENT AND FUTURE MARKET VOLUME SHARE REGIONAL ANALYSIS, 2025–2034, (USD MILLION)
FIGURE 65 GERMANY CARBON-NEGATIVE BUILDING MATERIALS CURRENT AND FUTURE TYPE ANALYSIS, 2025–2034, (USD MILLION)
FIGURE 66 GERMANY CARBON-NEGATIVE BUILDING MATERIALS CURRENT AND FUTURE END USER ANALYSIS, 2025–2034, (USD MILLION)
FIGURE 67 FRANCE CARBON-NEGATIVE BUILDING MATERIALS CURRENT AND FUTURE TYPE ANALYSIS, 2025–2034, (USD MILLION)
FIGURE 68 FRANCE CARBON-NEGATIVE BUILDING MATERIALS CURRENT AND FUTURE END USER ANALYSIS, 2025–2034, (USD MILLION)
FIGURE 69 UK CARBON-NEGATIVE BUILDING MATERIALS CURRENT AND FUTURE TYPE ANALYSIS, 2025–2034, (USD MILLION)
FIGURE 70 UK CARBON-NEGATIVE BUILDING MATERIALS CURRENT AND FUTURE END USER ANALYSIS, 2025–2034, (USD MILLION)
FIGURE 71 SPAIN CARBON-NEGATIVE BUILDING MATERIALS CURRENT AND FUTURE TYPE ANALYSIS, 2025–2034, (USD MILLION)
FIGURE 72 SPAIN CARBON-NEGATIVE BUILDING MATERIALS CURRENT AND FUTURE END USER ANALYSIS, 2025–2034, (USD MILLION)
FIGURE 73 ITALY CARBON-NEGATIVE BUILDING MATERIALS CURRENT AND FUTURE TYPE ANALYSIS, 2025–2034, (USD MILLION)
FIGURE 74 ITALY CARBON-NEGATIVE BUILDING MATERIALS CURRENT AND FUTURE END USER ANALYSIS, 2025–2034, (USD MILLION)
FIGURE 75 REST OF WESTERN EUROPE CARBON-NEGATIVE BUILDING MATERIALS CURRENT AND FUTURE TYPE ANALYSIS, 2025–2034, (USD MILLION)
FIGURE 76 REST OF WESTERN EUROPE CARBON-NEGATIVE BUILDING MATERIALS CURRENT AND FUTURE END USER ANALYSIS, 2025–2034, (USD MILLION)
FIGURE 77 EAST ASIA AND PACIFIC CARBON-NEGATIVE BUILDING MATERIALS CURRENT AND FUTURE MARKET VOLUME SHARE REGIONAL ANALYSIS, 2025–2034, (USD MILLION)
FIGURE 78 CHINA CARBON-NEGATIVE BUILDING MATERIALS CURRENT AND FUTURE TYPE ANALYSIS, 2025–2034, (USD MILLION)
FIGURE 79 CHINA CARBON-NEGATIVE BUILDING MATERIALS CURRENT AND FUTURE END USER ANALYSIS, 2025–2034, (USD MILLION)
FIGURE 80 JAPAN CARBON-NEGATIVE BUILDING MATERIALS CURRENT AND FUTURE TYPE ANALYSIS, 2025–2034, (USD MILLION)
FIGURE 81 JAPAN CARBON-NEGATIVE BUILDING MATERIALS CURRENT AND FUTURE END USER ANALYSIS, 2025–2034, (USD MILLION)
FIGURE 82 AUSTRALIA CARBON-NEGATIVE BUILDING MATERIALS CURRENT AND FUTURE TYPE ANALYSIS, 2025–2034, (USD MILLION)
FIGURE 83 AUSTRALIA CARBON-NEGATIVE BUILDING MATERIALS CURRENT AND FUTURE END USER ANALYSIS, 2025–2034, (USD MILLION)
FIGURE 84 CAMBODIA CARBON-NEGATIVE BUILDING MATERIALS CURRENT AND FUTURE TYPE ANALYSIS, 2025–2034, (USD MILLION)
FIGURE 85 CAMBODIA CARBON-NEGATIVE BUILDING MATERIALS CURRENT AND FUTURE END USER ANALYSIS, 2025–2034, (USD MILLION)
FIGURE 86 FIJI CARBON-NEGATIVE BUILDING MATERIALS CURRENT AND FUTURE TYPE ANALYSIS, 2025–2034, (USD MILLION)
FIGURE 87 FIJI CARBON-NEGATIVE BUILDING MATERIALS CURRENT AND FUTURE END USER ANALYSIS, 2025–2034, (USD MILLION)
FIGURE 88 INDONESIA CARBON-NEGATIVE BUILDING MATERIALS CURRENT AND FUTURE TYPE ANALYSIS, 2025–2034, (USD MILLION)
FIGURE 89 INDONESIA CARBON-NEGATIVE BUILDING MATERIALS CURRENT AND FUTURE END USER ANALYSIS, 2025–2034, (USD MILLION)
FIGURE 90 SOUTH KOREA CARBON-NEGATIVE BUILDING MATERIALS CURRENT AND FUTURE TYPE ANALYSIS, 2025–2034, (USD MILLION)
FIGURE 91 SOUTH KOREA CARBON-NEGATIVE BUILDING MATERIALS CURRENT AND FUTURE END USER ANALYSIS, 2025–2034, (USD MILLION)
FIGURE 92 REST OF EAST ASIA AND PACIFIC CARBON-NEGATIVE BUILDING MATERIALS CURRENT AND FUTURE TYPE ANALYSIS, 2025–2034, (USD MILLION)
FIGURE 93 REST OF EAST ASIA AND PACIFIC CARBON-NEGATIVE BUILDING MATERIALS CURRENT AND FUTURE END USER ANALYSIS, 2025–2034, (USD MILLION)
FIGURE 94 SEA AND SOUTH ASIA CARBON-NEGATIVE BUILDING MATERIALS CURRENT AND FUTURE MARKET VOLUME SHARE REGIONAL ANALYSIS, 2025–2034, (USD MILLION)
FIGURE 95 BANGLADESH CARBON-NEGATIVE BUILDING MATERIALS CURRENT AND FUTURE TYPE ANALYSIS, 2025–2034, (USD MILLION)
FIGURE 96 BANGLADESH CARBON-NEGATIVE BUILDING MATERIALS CURRENT AND FUTURE END USER ANALYSIS, 2025–2034, (USD MILLION)
FIGURE 97 NEW ZEALAND CARBON-NEGATIVE BUILDING MATERIALS CURRENT AND FUTURE TYPE ANALYSIS, 2025–2034, (USD MILLION)
FIGURE 98 NEW ZEALAND CARBON-NEGATIVE BUILDING MATERIALS CURRENT AND FUTURE END USER ANALYSIS, 2025–2034, (USD MILLION)
FIGURE 99 INDIA CARBON-NEGATIVE BUILDING MATERIALS CURRENT AND FUTURE TYPE ANALYSIS, 2025–2034, (USD MILLION)
FIGURE 100 INDIA CARBON-NEGATIVE BUILDING MATERIALS CURRENT AND FUTURE END USER ANALYSIS, 2025–2034, (USD MILLION)
FIGURE 101 SINGAPORE CARBON-NEGATIVE BUILDING MATERIALS CURRENT AND FUTURE TYPE ANALYSIS, 2025–2034, (USD MILLION)
FIGURE 102 SINGAPORE CARBON-NEGATIVE BUILDING MATERIALS CURRENT AND FUTURE END USER ANALYSIS, 2025–2034, (USD MILLION)
FIGURE 103 THAILAND CARBON-NEGATIVE BUILDING MATERIALS CURRENT AND FUTURE TYPE ANALYSIS, 2025–2034, (USD MILLION)
FIGURE 104 THAILAND CARBON-NEGATIVE BUILDING MATERIALS CURRENT AND FUTURE END USER ANALYSIS, 2025–2034, (USD MILLION)
FIGURE 105 TAIWAN CARBON-NEGATIVE BUILDING MATERIALS CURRENT AND FUTURE TYPE ANALYSIS, 2025–2034, (USD MILLION)
FIGURE 106 TAIWAN CARBON-NEGATIVE BUILDING MATERIALS CURRENT AND FUTURE END USER ANALYSIS, 2025–2034, (USD MILLION)
FIGURE 107 MALAYSIA CARBON-NEGATIVE BUILDING MATERIALS CURRENT AND FUTURE TYPE ANALYSIS, 2025–2034, (USD MILLION)
FIGURE 108 MALAYSIA CARBON-NEGATIVE BUILDING MATERIALS CURRENT AND FUTURE END USER ANALYSIS, 2025–2034, (USD MILLION)
FIGURE 109 REST OF SEA AND SOUTH ASIA CARBON-NEGATIVE BUILDING MATERIALS CURRENT AND FUTURE TYPE ANALYSIS, 2025–2034, (USD MILLION)
FIGURE 110 REST OF SEA AND SOUTH ASIA CARBON-NEGATIVE BUILDING MATERIALS CURRENT AND FUTURE END USER ANALYSIS, 2025–2034, (USD MILLION)
FIGURE 111 MIDDLE EAST AND AFRICA CARBON-NEGATIVE BUILDING MATERIALS CURRENT AND FUTURE MARKET VOLUME SHARE REGIONAL ANALYSIS, 2025–2034, (USD MILLION)
FIGURE 112 GCC COUNTRIES CARBON-NEGATIVE BUILDING MATERIALS CURRENT AND FUTURE TYPE ANALYSIS, 2025–2034, (USD MILLION)
FIGURE 113 GCC COUNTRIES CARBON-NEGATIVE BUILDING MATERIALS CURRENT AND FUTURE END USER ANALYSIS, 2025–2034, (USD MILLION)
FIGURE 114 SAUDI ARABIA CARBON-NEGATIVE BUILDING MATERIALS CURRENT AND FUTURE TYPE ANALYSIS, 2025–2034, (USD MILLION)
FIGURE 115 SAUDI ARABIA CARBON-NEGATIVE BUILDING MATERIALS CURRENT AND FUTURE END USER ANALYSIS, 2025–2034, (USD MILLION)
FIGURE 116 UAE CARBON-NEGATIVE BUILDING MATERIALS CURRENT AND FUTURE TYPE ANALYSIS, 2025–2034, (USD MILLION)
FIGURE 117 UAE CARBON-NEGATIVE BUILDING MATERIALS CURRENT AND FUTURE END USER ANALYSIS, 2025–2034, (USD MILLION)
FIGURE 118 BAHRAIN CARBON-NEGATIVE BUILDING MATERIALS CURRENT AND FUTURE TYPE ANALYSIS, 2025–2034, (USD MILLION)
FIGURE 119 BAHRAIN CARBON-NEGATIVE BUILDING MATERIALS CURRENT AND FUTURE END USER ANALYSIS, 2025–2034, (USD MILLION)
FIGURE 120 KUWAIT CARBON-NEGATIVE BUILDING MATERIALS CURRENT AND FUTURE TYPE ANALYSIS, 2025–2034, (USD MILLION)
FIGURE 121 KUWAIT CARBON-NEGATIVE BUILDING MATERIALS CURRENT AND FUTURE END USER ANALYSIS, 2025–2034, (USD MILLION)
FIGURE 122 OMAN CARBON-NEGATIVE BUILDING MATERIALS CURRENT AND FUTURE TYPE ANALYSIS, 2025–2034, (USD MILLION)
FIGURE 123 OMAN CARBON-NEGATIVE BUILDING MATERIALS CURRENT AND FUTURE END USER ANALYSIS, 2025–2034, (USD MILLION)
FIGURE 124 QATAR CARBON-NEGATIVE BUILDING MATERIALS CURRENT AND FUTURE TYPE ANALYSIS, 2025–2034, (USD MILLION)
FIGURE 125 QATAR CARBON-NEGATIVE BUILDING MATERIALS CURRENT AND FUTURE END USER ANALYSIS, 2025–2034, (USD MILLION)
FIGURE 126 EGYPT CARBON-NEGATIVE BUILDING MATERIALS CURRENT AND FUTURE TYPE ANALYSIS, 2025–2034, (USD MILLION)
FIGURE 127 EGYPT CARBON-NEGATIVE BUILDING MATERIALS CURRENT AND FUTURE END USER ANALYSIS, 2025–2034, (USD MILLION)
FIGURE 128 NIGERIA CARBON-NEGATIVE BUILDING MATERIALS CURRENT AND FUTURE TYPE ANALYSIS, 2025–2034, (USD MILLION)
FIGURE 129 NIGERIA CARBON-NEGATIVE BUILDING MATERIALS CURRENT AND FUTURE END USER ANALYSIS, 2025–2034, (USD MILLION)
FIGURE 130 SOUTH AFRICA CARBON-NEGATIVE BUILDING MATERIALS CURRENT AND FUTURE TYPE ANALYSIS, 2025–2034, (USD MILLION)
FIGURE 131 SOUTH AFRICA CARBON-NEGATIVE BUILDING MATERIALS CURRENT AND FUTURE END USER ANALYSIS, 2025–2034, (USD MILLION)
FIGURE 132 ISRAEL CARBON-NEGATIVE BUILDING MATERIALS CURRENT AND FUTURE TYPE ANALYSIS, 2025–2034, (USD MILLION)
FIGURE 133 ISRAEL CARBON-NEGATIVE BUILDING MATERIALS CURRENT AND FUTURE END USER ANALYSIS, 2025–2034, (USD MILLION)
FIGURE 134 REST OF MEA CARBON-NEGATIVE BUILDING MATERIALS CURRENT AND FUTURE TYPE ANALYSIS, 2025–2034, (USD MILLION)
FIGURE 135 REST OF MEA CARBON-NEGATIVE BUILDING MATERIALS CURRENT AND FUTURE END USER ANALYSIS, 2025–2034, (USD MILLION)
FIGURE 136 U. S. MARKET SHARE ANALYSIS BY TYPE (2024)
FIGURE 137 U. S. MARKET SHARE ANALYSIS BY END USER (2024)
FIGURE 138 CANADA MARKET SHARE ANALYSIS BY TYPE (2024)
FIGURE 139 CANADA MARKET SHARE ANALYSIS BY END USER (2024)
FIGURE 140 MEXICO MARKET SHARE ANALYSIS BY TYPE (2024)
FIGURE 141 MEXICO MARKET SHARE ANALYSIS BY END USER (2024)
FIGURE 142 CHINA MARKET SHARE ANALYSIS BY TYPE (2024)
FIGURE 143 CHINA MARKET SHARE ANALYSIS BY END USER (2024)
FIGURE 144 JAPAN MARKET SHARE ANALYSIS BY TYPE (2024)
FIGURE 145 JAPAN MARKET SHARE ANALYSIS BY END USER (2024)
FIGURE 146 INDIA MARKET SHARE ANALYSIS BY TYPE (2024)
FIGURE 147 INDIA MARKET SHARE ANALYSIS BY END USER (2024)
FIGURE 148 SOUTH KOREA MARKET SHARE ANALYSIS BY TYPE (2024)
FIGURE 149 SOUTH KOREA MARKET SHARE ANALYSIS BY END USER (2024)
FIGURE 150 SAUDI ARABIA MARKET SHARE ANALYSIS BY TYPE (2024)
FIGURE 151 SAUDI ARABIA MARKET SHARE ANALYSIS BY END USER (2024)
FIGURE 152 UAE MARKET SHARE ANALYSIS BY TYPE (2024)
FIGURE 153 UAE MARKET SHARE ANALYSIS BY END USER (2024)
FIGURE 154 EGYPT MARKET SHARE ANALYSIS BY TYPE (2024)
FIGURE 155 EGYPT MARKET SHARE ANALYSIS BY END USER (2024)
FIGURE 156 NIGERIA MARKET SHARE ANALYSIS BY TYPE (2024)
FIGURE 157 NIGERIA MARKET SHARE ANALYSIS BY END USER (2024)
FIGURE 158 SOUTH AFRICA MARKET SHARE ANALYSIS BY TYPE (2024)
FIGURE 159 SOUTH AFRICA MARKET SHARE ANALYSIS BY END USER (2024)
FIGURE 160 GERMANY MARKET SHARE ANALYSIS BY TYPE (2024)
FIGURE 161 GERMANY MARKET SHARE ANALYSIS BY END USER (2024)
FIGURE 162 FRANCE MARKET SHARE ANALYSIS BY TYPE (2024)
FIGURE 163 FRANCE MARKET SHARE ANALYSIS BY END USER (2024)
FIGURE 164 UK MARKET SHARE ANALYSIS BY TYPE (2024)
FIGURE 165 UK MARKET SHARE ANALYSIS BY END USER (2024)
FIGURE 166 SPAIN MARKET SHARE ANALYSIS BY TYPE (2024)
FIGURE 167 SPAIN MARKET SHARE ANALYSIS BY END USER (2024)
FIGURE 168 ITALY MARKET SHARE ANALYSIS BY TYPE (2024)
FIGURE 169 ITALY MARKET SHARE ANALYSIS BY END USER (2024)
FIGURE 170 BRAZIL MARKET SHARE ANALYSIS BY TYPE (2024)
FIGURE 171 BRAZIL MARKET SHARE ANALYSIS BY END USER (2024)
FIGURE 172 ARGENTINA MARKET SHARE ANALYSIS BY TYPE (2024)
FIGURE 173 ARGENTINA MARKET SHARE ANALYSIS BY END USER (2024)
FIGURE 174 COLUMBIA MARKET SHARE ANALYSIS BY TYPE (2024)
FIGURE 175 COLUMBIA MARKET SHARE ANALYSIS BY END USER (2024)
FIGURE 176 GLOBAL CARBON-NEGATIVE BUILDING MATERIALS CURRENT AND FUTURE MARKET KEY COUNTRY LEVEL ANALYSIS, 2024–2034, (USD MILLION)
FIGURE 177 FINANCIAL OVERVIEW:
Key Players Analysis:
CarbonCure Technologies Inc.: CarbonCure is a Canadian company that focuses on carbon dioxide utilization in the concrete industry. Their flagship product injects recycled CO2 into concrete during mixing, enhancing strength while reducing emissions. The company aims to help the construction industry meet sustainability goals and has partnered with concrete producers across North America to expand its reach.
CEMEX S.A.B. de C.V.: Based in Mexico, CEMEX is a global leader in the building materials sector, offering a wide range of products, including cement, concrete, and aggregates. Their "CEMEX Go" platform enables digital transactions and offers sustainable construction solutions. The company focuses on reducing its carbon footprint through innovative products and operational efficiencies in over 50 countries.
LafargeHolcim Ltd.: LafargeHolcim, headquartered in Switzerland, is a major player in the construction materials industry, providing cement, aggregates, and concrete. They are committed to sustainability and have set ambitious targets to reduce CO2 emissions through carbon capture and the development of low-carbon building materials. The company operates in over 70 countries.
BASF SE: A German multinational, BASF is a leading chemical producer that offers sustainable construction solutions, including additives for concrete that enhance performance and durability. BASF focuses on innovation and sustainability, aiming to help clients achieve green building certifications. Their global presence allows them to collaborate with various stakeholders in the construction sector.
HeidelbergCement AG: Based in Germany, HeidelbergCement is one of the world’s largest building materials companies, specializing in cement and aggregates. Their sustainability initiatives include producing carbon-neutral cement and enhancing the use of alternative fuels. With operations in more than 50 countries, HeidelbergCement is focused on integrating eco-friendly practices into its core business strategy.
Blue Planet Ltd.: Blue Planet, based in California, specializes in producing building materials from captured CO2. Their innovative technology transforms CO2 into synthetic limestone aggregates for concrete. By enabling carbon-negative construction practices, Blue Planet aims to contribute to climate change mitigation. The company collaborates with various stakeholders to promote sustainable building solutions.
Nexii Building Solutions Inc.: Nexii is a Canadian green building technology company that manufactures sustainable construction materials, including Nexiite, a low-carbon building material. Their focus is on providing energy-efficient, carbon-negative solutions for the construction industry. With a commitment to reducing environmental impact, Nexii partners with developers and builders to promote sustainable architecture.
Katerra Inc.: Katerra, headquartered in the U.S., is a technology-driven construction firm that integrates design, materials, and construction into a single platform. They offer sustainable building materials and prefabricated components to streamline construction processes. Katerra's strategy focuses on reducing waste and enhancing efficiency through innovative building practices.
Sika AG: Swiss-based Sika is a global specialty chemicals company that provides innovative solutions for construction and industrial applications. They offer a range of sustainable products, including concrete additives that improve durability and reduce carbon emissions. Sika emphasizes sustainability and innovation, aligning its strategy with global environmental goals.
BioMason: Based in North Carolina, BioMason utilizes a unique biological process to create sustainable building materials, including bricks that are produced using living organisms. Their innovative approach allows for carbon sequestration during manufacturing, making their products carbon-negative. BioMason focuses on sustainable construction and has formed partnerships to expand its market presence.
Market Key Players
CarbonCure Technologies Inc.
CEMEX S.A.B. de C.V.
LafargeHolcim Ltd.
BASF SE
HeidelbergCement AG
Blue Planet Ltd.
Carbon Clean Solutions Limited
Nexii Building Solutions Inc.
Katerra Inc.
Skanska AB
Ecovative Design LLC
Element 25 Limited
Sika AG
Aggregate Industries
Lafarge U.S.
Carbon8 Systems Ltd.
Renewable Energy Group Inc.
BioMason
Greencastle Associates
TerraCO2 Technology LLC
Hempitecture Inc.
Solidia Technologies
Calera Corporation
Made of Air GmbH
C-Crete Technologies
Basilisk Self-Healing Concrete
Carbicrete Inc.
Holcim Group (LafargeHolcim)
Novacem Ltd.
Green Building Council Partners
Driver:
Stringent Environmental Regulations:
Governments worldwide are implementing increasingly stringent environmental regulations aimed at reducing greenhouse gas emissions and promoting sustainable building practices. These regulations create a supportive framework for the adoption of carbon-negative building materials. For instance, in North America and Europe, policies like the Green Deal and various environmental acts incentivize builders to integrate eco-friendly solutions into their projects. This shift is not only driven by compliance but also by a growing public demand for sustainable practices. As construction companies align their operations with these regulations, the market for carbon-negative materials is projected to expand significantly, facilitating a broader acceptance of green alternatives in the construction industry.
Rising Awareness of Climate Change:
Public awareness of climate change and its consequences has surged in recent years, prompting consumers and businesses alike to seek more sustainable options. This heightened awareness influences purchasing decisions, driving demand for eco-friendly building materials. Homeowners and businesses are increasingly prioritizing sustainability, seeking materials that not only reduce their carbon footprint but also contribute to energy efficiency. As a result, builders are compelled to source and utilize carbon-negative materials to meet consumer expectations. This demand for sustainability is reshaping the construction landscape, pushing manufacturers to innovate and supply products that align with these environmentally conscious values.
Technological Advancements:
Technological innovations in the production of carbon-negative building materials are propelling market growth by enhancing product efficiency and performance. Advances in material science have led to the development of carbon-sequestering concrete and bio-based insulation that effectively reduces emissions without compromising quality. Furthermore, improved recycling technologies allow for the efficient use of waste materials in construction, reinforcing the circular economy. These advancements not only increase the availability of sustainable materials but also make them more cost-effective and appealing to builders. As technology continues to evolve, it will further enable the growth of the carbon-negative building materials market, facilitating a shift towards sustainable construction practices.
Restraints
High Production Costs:
One of the significant challenges facing the carbon-negative building materials market is the high production costs associated with many of these eco-friendly alternatives. The manufacturing processes for carbon-sequestering concrete, bio-based insulation, and other sustainable materials often involve advanced technologies and raw materials that can be expensive. These costs may lead to higher pricing compared to conventional building materials, making it challenging for construction companies to justify the switch. As a result, some builders may opt for more cost-effective traditional materials, limiting the market's growth potential. This financial barrier highlights the need for continued innovation and cost reduction in the production of carbon-negative materials.
Limited Awareness Among Stakeholders:
Despite the growing awareness of sustainability, there remains a lack of comprehensive understanding of carbon-negative building materials among various stakeholders in the construction industry. Many architects, contractors, and developers may not be fully informed about the benefits and applications of these materials. This gap in knowledge can hinder the adoption of carbon-negative solutions, as stakeholders may be reluctant to invest in unfamiliar products. Additionally, the complexities involved in integrating these materials into existing construction practices can pose challenges. To overcome this restraint, increased education and outreach efforts are essential to raise awareness and demonstrate the value of carbon-negative materials across the industry.
Opportunities
Growth in Emerging Markets:
Emerging markets, particularly in the Asia-Pacific region, present significant opportunities for the carbon-negative building materials market. Rapid urbanization and increased infrastructure development in countries like India and China create a demand for sustainable construction practices. As governments in these regions implement policies to encourage eco-friendly building, manufacturers have the chance to introduce carbon-negative materials to meet this growing demand. The shift towards sustainability in these markets offers substantial growth potential, allowing companies to establish a foothold in new and expanding markets. By capitalizing on this opportunity, manufacturers can contribute to global sustainability efforts while enhancing their market presence.
Integration of Smart Technologies:
The integration of smart technologies into building design and construction presents another opportunity for the carbon-negative materials market. As the construction industry embraces smart building solutions, there is a growing potential for combining carbon-negative materials with advanced technologies like IoT (Internet of Things) and building information modeling (BIM). This integration can enhance energy efficiency, monitor sustainability metrics, and optimize building performance over time. By developing materials that work seamlessly with smart technologies, manufacturers can position themselves as leaders in innovative building solutions. This convergence of sustainability and technology not only meets consumer demand but also paves the way for more efficient, sustainable buildings.
Trend
Growing Demand for Sustainable Certification:
A significant trend in the carbon-negative building materials market is the increasing demand for sustainability certifications. Certifications such as LEED (Leadership in Energy and Environmental Design) and BREEAM (Building Research Establishment Environmental Assessment Method) are becoming essential for construction projects, as they validate the environmental performance of buildings. This trend is encouraging manufacturers to develop carbon-negative materials that meet the criteria set by these certification bodies. As more builders strive to achieve certified green buildings, the demand for certified sustainable materials will continue to rise. This shift reflects a broader commitment to environmental responsibility and sustainable development within the construction industry.
Recent Development
In October 2024: BamCore, a leader in sustainable prefabricated building solutions, has announced strategic collaborations with D.R. Horton, the largest homebuilder in the U.S., and Builders FirstSource, a premier supplier of building products. This partnership aims to accelerate the adoption of BamCore's innovative carbon-negative framing technology. The collaboration includes the completion of pilot BamCore houses and a pre-purchase agreement for additional homes. Additionally, BamCore is expanding its production capabilities by investing in a new high-capacity fabrication line, positioning itself for significant market growth.
In September 2024: A new study revealed that the modular construction market is expected to see substantial growth, driven by increasing demand for sustainable and efficient building solutions. The research indicates a rising preference for off-site construction methods due to their ability to reduce costs and construction time while minimizing waste. Companies are increasingly adopting advanced technologies to enhance the quality and speed of modular building processes.
Frequently Asked Questions
How big is the Carbon-Negative Building Materials Market?
Discover how the Global Carbon-Negative Building Materials Market is set to grow from USD 36.2M in 2024 to USD 169.8M by 2034 at a CAGR of 16.9%. Rising demand for sustainable construction, bio-based innovations, and green infrastructure drives this eco-friendly market.
Who are the major players in the Carbon-Negative Building Materials Market?
CarbonCure Technologies Inc., CEMEX S.A.B. de C.V., LafargeHolcim Ltd., BASF SE, HeidelbergCement AG, Blue Planet Ltd., Carbon Clean Solutions Limited, Nexii Building Solutions Inc., Katerra Inc., Skanska AB, Ecovative Design LLC, Element 25 Limited, Sika AG, Aggregate Industries, Lafarge U.S., Carbon8 Systems Ltd., Renewable Energy Group Inc., BioMason, Greencastle Associates, TerraCO2 Technology LLC, Hempitecture Inc., Solidia Technologies, Calera Corporation, Made of Air GmbH, C-Crete Technologies, Basilisk Self-Healing Concrete, Carbicrete Inc., Holcim Group (LafargeHolcim), Novacem Ltd., Green Building Council Partners
Which segments covered the Carbon-Negative Building Materials Market?
By Material Type (Carbon-Negative Concrete, Carbon-Negative Bricks & Blocks, Hempcrete & Bio-based Materials, Recycled & Upcycled Materials, Others), By Technology (Carbon Capture & Utilization (CCU), Carbon Sequestration Materials, Bio-Based Innovations, Recycling & Circular Economy Technologies), By End-User: (Construction Companies, Architects & Designers, Government Agencies, Homeowners), By Application (Residential Buildings, Commercial Buildings, Industrial Construction, Public Infrastructure)
How can this market research report help my business make strategic decisions?
Our market research reports provide actionable intelligence, including verified market size data, CAGR projections, competitive benchmarking, and segment-level opportunity analysis. These insights support strategic planning, investment decisions, product development, and market entry strategies for enterprises and startups alike.
How frequently is the data updated?
We continuously monitor industry developments and update our reports to reflect regulatory changes, technological advancements, and macroeconomic shifts. Updated editions ensure you receive the latest market intelligence.

 Aerospace And Defence
 Agriculture
 Automotive And Transportation
 Banking And Finance
 Business
 Chemicals And Materials
 Consumer And Retail
 Electronics And Semiconductors
 Food And Beverages
 Machinery & Equipments
 Manufacturing And Construction
 Medical Devices
 Others
 Pharmaceuticals And Healthcare
 Power And Energy
 Sports
 Technology

, Application (Residential Buildings, Commercial Buildings, Industrial Structures, Infrastructure Projects), End-User (Construction Companies, Architects & Designers, Government Agencies, Homeowners), Region and Key Players - Industry Segment Overview, Market Dynamics, Competitive Strategies, Trends and Forecast 2025-2034")
, Application (Residential Buildings, Commercial Buildings, Industrial Structures, Infrastructure Projects), End-User (Construction Companies, Architects & Designers, Government Agencies, Homeowners), Region and Key Players - Industry Segment Overview, Market Dynamics, Competitive Strategies, Trends and Forecast 2025-2034")
, Application (Residential Buildings, Commercial Buildings, Industrial Structures, Infrastructure Projects), End-User (Construction Companies, Architects & Designers, Government Agencies, Homeowners), Region and Key Players - Industry Segment Overview, Market Dynamics, Competitive Strategies, Trends and Forecast 2025-2034")
, Application (Residential Buildings, Commercial Buildings, Industrial Structures, Infrastructure Projects), End-User (Construction Companies, Architects & Designers, Government Agencies, Homeowners), Region and Key Players - Industry Segment Overview, Market Dynamics, Competitive Strategies, Trends and Forecast 2025-2034")

