Carbon Trading & Blockchain Market to Reach USD 33.8 Bn by 2034 | Net-Zero Future
Global Carbon Trading and Blockchain Integration Market Size, Share, Analysis Report By Type (Compliance Market, Voluntary Market), Technology (Blockchain Technology, Traditional Technology), End User (Power Generation, Transportation, Building and Construction, Manufacturing, Others), Region and Key Players - Industry Segment Overview, Market Dynamics, Competitive Strategies, Trends and Forecast 2025-2034
The Global Carbon Trading and Blockchain Integration Market is poised for remarkable growth. The market size is projected to reach USD 33.8 Billion by 2034, up from USD 12.8 Billion in 2024, growing at a CAGR of 11.9% during the forecast period from 2024 to 2034. This growth is fueled by increasing global focus on carbon neutrality, transparent carbon credit systems, and the rising adoption of blockchain for secure, traceable transactions. As businesses and governments align with net-zero goals, blockchain-enabled carbon trading platforms are set to transform the future of sustainable finance and climate action.
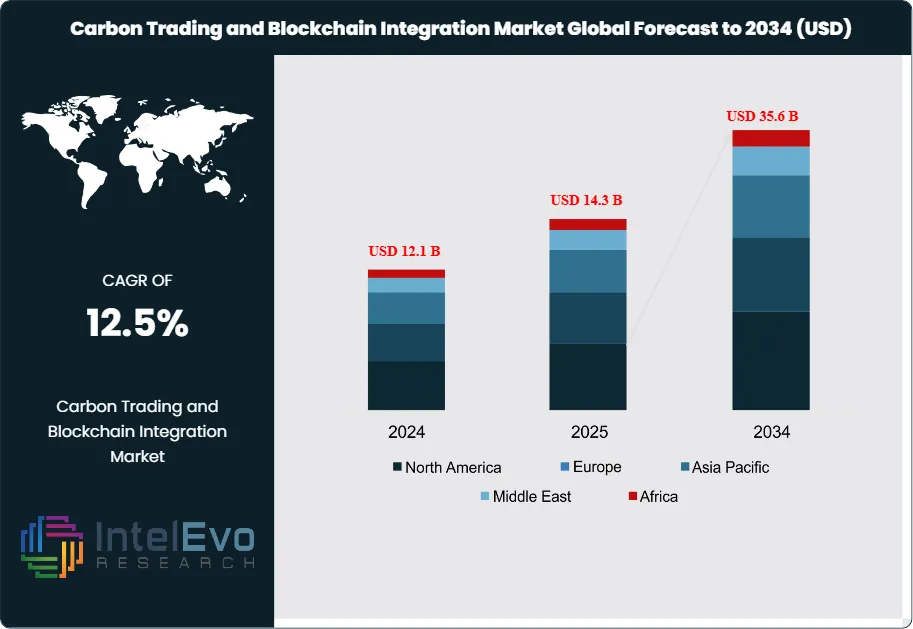
The global carbon trading and blockchain integration market focuses on the trading of carbon credits, allowing companies to offset their carbon emissions by purchasing credits from those with surplus allowances. This market is driven by regulatory frameworks such as the Paris Agreement and national emissions trading systems that mandate emission reductions. The current market, valued at approximately USD 12.1 billion in 2024, is experiencing dynamic growth fueled by the increasing importance of sustainability and corporate social responsibility. Blockchain technology enhances the market by providing a transparent and secure method for tracking transactions, thus increasing trust among stakeholders.
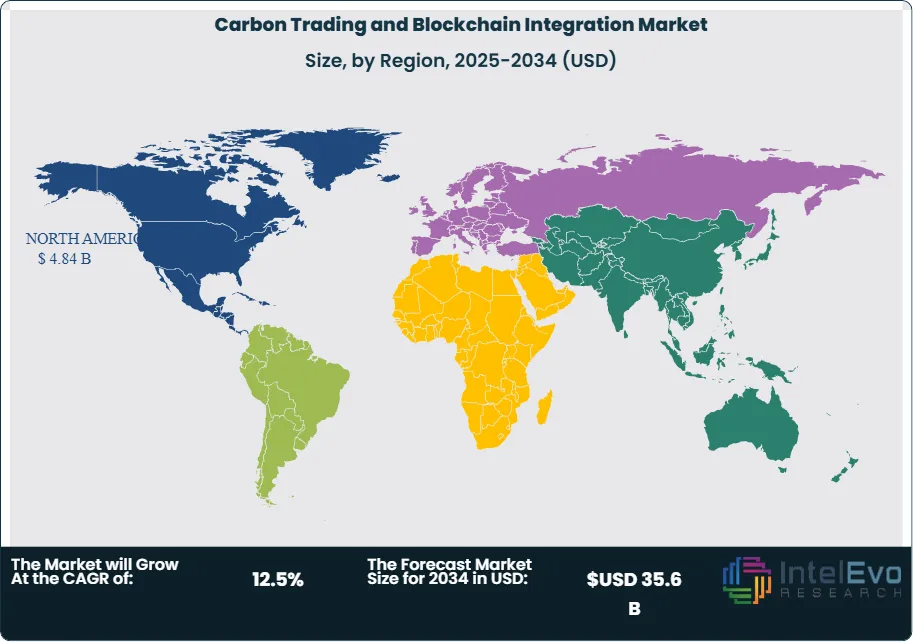
Several key drivers underpin growth dynamics in the carbon trading and blockchain integration market. Regulatory pressures from governments worldwide are pushing organizations to adopt greener practices, thereby increasing demand for carbon credits. The rise in corporate sustainability initiatives, along with significant investments in low-carbon technologies, further propels market growth. Additionally, blockchain’s ability to provide real-time data and improve the efficiency of trading processes offers a compelling advantage. As businesses and investors recognize the potential for carbon markets to mitigate climate change, the market is expected to grow at a CAGR of 12.5%, reaching an estimated USD 35.6 billion by 2034.
North America and Europe currently dominate the carbon trading and blockchain integration market due to stringent regulations and established trading frameworks. The European Union Emission Trading System (EU ETS) is a key player, promoting carbon credit trading across member states. In Asia-Pacific, rapid industrialization and a growing emphasis on environmental sustainability are driving market expansion. Countries like China and India are increasingly adopting carbon trading mechanisms, creating substantial growth opportunities in the region. Emerging markets in Latin America and Africa are also expected to see significant developments as they establish their carbon trading systems.
The COVID-19 pandemic impacted the carbon trading and blockchain integration market in various ways. Initially, the pandemic caused disruptions in trading activities due to economic slowdowns and decreased industrial output. However, it also spurred a renewed focus on environmental sustainability, as governments and organizations recognized the need for green recovery strategies. The pandemic accelerated the adoption of digital technologies, including blockchain, as companies sought more efficient and transparent ways to manage carbon trading. This shift is likely to benefit the market in the long run, as stakeholders prioritize sustainable practices in post-pandemic recovery efforts.
Key Takeaways
Market Growth: The carbon trading and blockchain integration market is expected to reach USD 33.8 Billion by 2034, growing at a robust CAGR of 11.9%, indicating strong market expansion.
Compliance Market Analysis: The compliance segment is anticipated to dominate the market due to regulatory pressures compelling businesses to reduce emissions. This segment's growth is fueled by established frameworks like the EU Emission Trading System, which enhances its prominence.
Voluntary Market Analysis: The voluntary market is gaining traction as companies seek to enhance their sustainability profiles. Organizations are increasingly purchasing carbon credits voluntarily to meet corporate social responsibility goals and improve their public image.
Driver: Growing regulatory pressures and increased corporate focus on sustainability are driving market growth. The adoption of carbon trading mechanisms is vital for organizations aiming to meet emission reduction targets and enhance their environmental credibility.
Restraint: Limited awareness and understanding of carbon trading mechanisms among smaller businesses can restrain market growth. Additionally, fluctuating carbon credit prices and potential regulatory changes may create uncertainties for participants in the market.
Opportunity: The integration of blockchain technology presents significant opportunities for enhancing transaction efficiency and transparency in carbon trading. As businesses seek reliable solutions to track and verify carbon credits, blockchain adoption will likely accelerate.
Trend: Increased digitalization in carbon trading processes is emerging, with organizations leveraging blockchain for enhanced data management, traceability, and transaction security.
Regional Analysis: North America and Europe are projected to be the leading regions in the market, driven by stringent regulations and established trading systems. Asia-Pacific is also expected to grow rapidly as countries adopt their carbon trading frameworks.
Type
The carbon trading market is primarily segmented into two categories: compliance and voluntary markets. The compliance market is driven by regulatory frameworks that require businesses to adhere to emissions reduction targets. It includes systems like the European Union Emission Trading System (EU ETS), which mandates that companies reduce their carbon footprint or purchase credits to offset excess emissions. This market is characterized by a structured approach to trading carbon allowances and is crucial for meeting national and international climate commitments. In contrast, the voluntary market allows organizations to purchase carbon credits beyond regulatory requirements, often to enhance corporate sustainability profiles. This segment is gaining traction as businesses increasingly recognize the value of investing in carbon offsets for brand reputation and corporate social responsibility.
Technology
The technology segment in the carbon trading and blockchain integration market is divided into blockchain and traditional technology. Blockchain technology is revolutionizing the way carbon credits are traded by providing a decentralized, transparent, and secure platform for transactions. It enhances traceability and accountability, allowing stakeholders to verify the authenticity of carbon credits easily. Traditional technology, while still prevalent, often lacks the efficiency and transparency that blockchain offers. This segment includes conventional methods for tracking emissions and trading credits but is becoming increasingly outdated as businesses seek modern solutions. As blockchain technology matures, it is expected to dominate this segment, enabling real-time data sharing and reducing transaction costs, ultimately fostering greater trust among market participants.
End User
The end-user segment of the carbon trading and blockchain integration market encompasses various industries, including power generation, transportation, building and construction, and manufacturing. Power generation is a significant contributor to carbon emissions, making it a primary focus for emissions trading schemes. Companies in this sector are often required to purchase carbon credits to comply with regulations. The transportation sector is also adapting, with initiatives aimed at reducing emissions from vehicles and logistics operations. Building and construction industries are increasingly investing in sustainable practices, leading to demand for carbon credits. Lastly, manufacturing sectors are exploring innovative ways to minimize their carbon footprints. Overall, the end-user segment reflects a growing commitment to sustainability across multiple industries, highlighting the diverse applications of carbon trading.
Region Analysis
North America Leads with 40% Market Share in Carbon Trading and Blockchain Integration Market: North America holds the largest market share in the carbon trading and blockchain integration sector, accounting for approximately 40% of the total market. This dominance can be attributed to the region's proactive regulatory environment, particularly in states like California, which has implemented stringent cap-and-trade programs that stimulate carbon credit transactions. Furthermore, the presence of major technology firms and financial institutions facilitates the integration of blockchain solutions into carbon trading. The U.S. and Canada are also witnessing an increased corporate focus on sustainability, driven by public demand and shareholder expectations. This combination of regulatory frameworks, technological innovation, and corporate commitment to emissions reduction ensures that North America remains a pivotal player in the global carbon trading market.
Asia-Pacific is poised to be the fastest-growing region in the carbon trading and blockchain integration market, with an expected CAGR of 15% over the next decade. Countries like China and India are developing their carbon trading frameworks, driven by escalating environmental concerns and international pressure to meet climate goals. China's national emissions trading system, the largest globally, is a significant catalyst for market expansion in the region. Additionally, the increasing adoption of renewable energy and the push for sustainable practices in industrial operations contribute to this growth. While North America and Europe maintain substantial market shares, the rapid industrialization and urbanization in Asia-Pacific create unique opportunities for carbon trading and blockchain integration, making it an attractive region for investment and innovation. Latin America and the Middle East and Africa are also showing potential, albeit at a slower pace, as they begin to explore regulatory frameworks and sustainable practices.
By Type (Compliance Market, Voluntary Market), By Technology (Blockchain Technology, Traditional Technology), By Blockchain Type (Public Blockchain, Private Blockchain, Consortium Blockchain, Hybrid Blockchain), By End-User (Energy & Utilities, Manufacturing & Industrial, Financial Services & Trading Platforms, Government & Regulatory Bodies, Others), By Application (Carbon Credit Tracking & Trading, Renewable Energy Certificates (RECs), Emission Monitoring & Reporting, Smart Contracts for Carbon Trading, Others)
Research Methodology
Primary Research- 100 Interviews of Stakeholders
Secondary Research
Desk Research
Regional scope
North America (United States, Canada, Mexico)
Latin America (Brazil, Argentina, Columbia)
East Asia And Pacific (China, Japan, South Korea, Australia, Cambodia, Fiji, Indonesia)
Sea And South Asia (India, Singapore, Thailand, Taiwan, Malaysia)
Eastern Europe (Poland, Russia, Czech Republic, Romania)
Western Europe (Germany, U.K., France, Spain, Itlay)
Middle East & Africa (GCC Countries, Egypt, Nigeria, South Africa, Israel)
Competitive Landscape
IBM Corporation, Microsoft Corporation, SAP SE, Nasdaq Inc., AirCarbon Exchange (ACX), CarbonX, Verra, Toucan Protocol, ClimateTrade, Xpansiv CBL, Carbonplace, Everledger, ConsenSys, Flowcarbon, Blockchain for Climate Foundation, Accenture, Goldman Sachs, JP Morgan Chase, Citi, Carbon Trust, South Pole, ClimatePartner, Ecovadis, Baker Hughes, Enel X, Siemens, BP, Shell, TotalEnergies, Carbon Credits International, Climeworks, Nori
Customization Scope
Customization for segments, region/country-level will be provided. Moreover, additional customization can be done based on the requirements.
Pricing and Purchase Options
Avail customized purchase options to meet your exact research needs. We have three licenses to opt for: Single User License, Multi-User License (Up to 5 Users), Corporate Use License (Unlimited User and Printable PDF).
TABLE OF CONTENTS
1. EXECUTIVE SUMMARY
1.1. MARKET SNAPSHOT
1.2. KEY FINDINGS & INSIGHTS
1.3. ANALYST RECOMMENDATIONS
1.4. FUTURE OUTLOOK
2. RESEARCH METHODOLOGY
2.1. MARKET DEFINITION & SCOPE
2.2. RESEARCH OBJECTIVES: PRIMARY & SECONDARY DATA SOURCES
2.3. DATA COLLECTION SOURCES
2.3.1. COVERAGE OF 100+ PRIMARY RESEARCH/CONSULTATION CALLS WITH INDUSTRY STAKEHOLDERS
FIGURE 17 NORTH AMERICA CARBON TRADING AND BLOCKCHAIN INTEGRATION CURRENT AND FUTURE TYPE ANALYSIS, 2025–2034, (USD MILLION)
FIGURE 18 NORTH AMERICA CARBON TRADING AND BLOCKCHAIN INTEGRATION CURRENT AND FUTURE END USER ANALYSIS, 2025–2034, (USD MILLION)
FIGURE 19 MARKET SHARE BY COUNTRY
FIGURE 20 LATIN AMERICA CARBON TRADING AND BLOCKCHAIN INTEGRATION CURRENT AND FUTURE TYPE ANALYSIS, 2025–2034, (USD MILLION)
FIGURE 21 LATIN AMERICA CARBON TRADING AND BLOCKCHAIN INTEGRATION CURRENT AND FUTURE END USER ANALYSIS, 2025–2034, (USD MILLION)
FIGURE 22 MARKET SHARE BY COUNTRY
FIGURE 23 EASTERN EUROPE CARBON TRADING AND BLOCKCHAIN INTEGRATION CURRENT AND FUTURE TYPE ANALYSIS, 2025–2034, (USD MILLION)
FIGURE 24 EASTERN EUROPE CARBON TRADING AND BLOCKCHAIN INTEGRATION CURRENT AND FUTURE END USER ANALYSIS, 2025–2034, (USD MILLION)
FIGURE 25 MARKET SHARE BY COUNTRY
FIGURE 26 WESTERN EUROPE CARBON TRADING AND BLOCKCHAIN INTEGRATION CURRENT AND FUTURE TYPE ANALYSIS, 2025–2034, (USD MILLION)
FIGURE 27 WESTERN EUROPE CARBON TRADING AND BLOCKCHAIN INTEGRATION CURRENT AND FUTURE END USER ANALYSIS, 2025–2034, (USD MILLION)
FIGURE 28 MARKET SHARE BY COUNTRY
FIGURE 29 EAST ASIA AND PACIFIC CARBON TRADING AND BLOCKCHAIN INTEGRATION CURRENT AND FUTURE TYPE ANALYSIS, 2025–2034, (USD MILLION)
FIGURE 30 EAST ASIA AND PACIFIC CARBON TRADING AND BLOCKCHAIN INTEGRATION CURRENT AND FUTURE END USER ANALYSIS, 2025–2034, (USD MILLION)
FIGURE 31 MARKET SHARE BY COUNTRY
FIGURE 32 SEA AND SOUTH ASIA CARBON TRADING AND BLOCKCHAIN INTEGRATION CURRENT AND FUTURE TYPE ANALYSIS, 2025–2034, (USD MILLION)
FIGURE 33 SEA AND SOUTH ASIA CARBON TRADING AND BLOCKCHAIN INTEGRATION CURRENT AND FUTURE END USER ANALYSIS, 2025–2034, (USD MILLION)
FIGURE 34 MARKET SHARE BY COUNTRY
FIGURE 35 MIDDLE EAST AND AFRICA CARBON TRADING AND BLOCKCHAIN INTEGRATION CURRENT AND FUTURE TYPE ANALYSIS, 2025–2034, (USD MILLION)
FIGURE 36 MIDDLE EAST AND AFRICA CARBON TRADING AND BLOCKCHAIN INTEGRATION CURRENT AND FUTURE END USER ANALYSIS, 2025–2034, (USD MILLION)
FIGURE 37 NORTH AMERICA CARBON TRADING AND BLOCKCHAIN INTEGRATION CURRENT AND FUTURE MARKET VOLUME SHARE REGIONAL ANALYSIS, 2025–2034, (USD MILLION)
FIGURE 38 U.S. CARBON TRADING AND BLOCKCHAIN INTEGRATION CURRENT AND FUTURE TYPE ANALYSIS, 2025–2034, (USD MILLION)
FIGURE 39 U.S. CARBON TRADING AND BLOCKCHAIN INTEGRATION CURRENT AND FUTURE END USER ANALYSIS, 2025–2034, (USD MILLION)
FIGURE 40 CANADA CARBON TRADING AND BLOCKCHAIN INTEGRATION CURRENT AND FUTURE TYPE ANALYSIS, 2025–2034, (USD MILLION)
FIGURE 41 CANADA CARBON TRADING AND BLOCKCHAIN INTEGRATION CURRENT AND FUTURE END USER ANALYSIS, 2025–2034, (USD MILLION)
FIGURE 42 LATIN AMERICA CARBON TRADING AND BLOCKCHAIN INTEGRATION CURRENT AND FUTURE MARKET VOLUME SHARE REGIONAL ANALYSIS, 2025–2034, (USD MILLION)
FIGURE 43 MEXICO CARBON TRADING AND BLOCKCHAIN INTEGRATION CURRENT AND FUTURE TYPE ANALYSIS, 2025–2034, (USD MILLION)
FIGURE 44 MEXICO CARBON TRADING AND BLOCKCHAIN INTEGRATION CURRENT AND FUTURE END USER ANALYSIS, 2025–2034, (USD MILLION)
FIGURE 45 BRAZIL CARBON TRADING AND BLOCKCHAIN INTEGRATION CURRENT AND FUTURE TYPE ANALYSIS, 2025–2034, (USD MILLION)
FIGURE 46 BRAZIL CARBON TRADING AND BLOCKCHAIN INTEGRATION CURRENT AND FUTURE END USER ANALYSIS, 2025–2034, (USD MILLION)
FIGURE 47 ARGENTINA CARBON TRADING AND BLOCKCHAIN INTEGRATION CURRENT AND FUTURE TYPE ANALYSIS, 2025–2034, (USD MILLION)
FIGURE 48 ARGENTINA CARBON TRADING AND BLOCKCHAIN INTEGRATION CURRENT AND FUTURE END USER ANALYSIS, 2025–2034, (USD MILLION)
FIGURE 49 COLUMBIA CARBON TRADING AND BLOCKCHAIN INTEGRATION CURRENT AND FUTURE TYPE ANALYSIS, 2025–2034, (USD MILLION)
FIGURE 50 COLUMBIA CARBON TRADING AND BLOCKCHAIN INTEGRATION CURRENT AND FUTURE END USER ANALYSIS, 2025–2034, (USD MILLION)
FIGURE 51 REST OF LATIN AMERICA CARBON TRADING AND BLOCKCHAIN INTEGRATION CURRENT AND FUTURE TYPE ANALYSIS, 2025–2034, (USD MILLION)
FIGURE 52 REST OF LATIN AMERICA CARBON TRADING AND BLOCKCHAIN INTEGRATION CURRENT AND FUTURE END USER ANALYSIS, 2025–2034, (USD MILLION)
FIGURE 53 EASTERN EUROPE CARBON TRADING AND BLOCKCHAIN INTEGRATION CURRENT AND FUTURE MARKET VOLUME SHARE REGIONAL ANALYSIS, 2025–2034, (USD MILLION)
FIGURE 54 POLAND CARBON TRADING AND BLOCKCHAIN INTEGRATION CURRENT AND FUTURE TYPE ANALYSIS, 2025–2034, (USD MILLION)
FIGURE 55 POLAND CARBON TRADING AND BLOCKCHAIN INTEGRATION CURRENT AND FUTURE END USER ANALYSIS, 2025–2034, (USD MILLION)
FIGURE 56 RUSSIA CARBON TRADING AND BLOCKCHAIN INTEGRATION CURRENT AND FUTURE TYPE ANALYSIS, 2025–2034, (USD MILLION)
FIGURE 57 RUSSIA CARBON TRADING AND BLOCKCHAIN INTEGRATION CURRENT AND FUTURE END USER ANALYSIS, 2025–2034, (USD MILLION)
FIGURE 58 CZECH REPUBLIC CARBON TRADING AND BLOCKCHAIN INTEGRATION CURRENT AND FUTURE TYPE ANALYSIS, 2025–2034, (USD MILLION)
FIGURE 59 CZECH REPUBLIC CARBON TRADING AND BLOCKCHAIN INTEGRATION CURRENT AND FUTURE END USER ANALYSIS, 2025–2034, (USD MILLION)
FIGURE 60 ROMANIA CARBON TRADING AND BLOCKCHAIN INTEGRATION CURRENT AND FUTURE TYPE ANALYSIS, 2025–2034, (USD MILLION)
FIGURE 61 ROMANIA CARBON TRADING AND BLOCKCHAIN INTEGRATION CURRENT AND FUTURE END USER ANALYSIS, 2025–2034, (USD MILLION)
FIGURE 62 REST OF EASTERN EUROPE CARBON TRADING AND BLOCKCHAIN INTEGRATION CURRENT AND FUTURE TYPE ANALYSIS, 2025–2034, (USD MILLION)
FIGURE 63 REST OF EASTERN EUROPE CARBON TRADING AND BLOCKCHAIN INTEGRATION CURRENT AND FUTURE END USER ANALYSIS, 2025–2034, (USD MILLION)
FIGURE 64 WESTERN EUROPE CARBON TRADING AND BLOCKCHAIN INTEGRATION CURRENT AND FUTURE MARKET VOLUME SHARE REGIONAL ANALYSIS, 2025–2034, (USD MILLION)
FIGURE 65 GERMANY CARBON TRADING AND BLOCKCHAIN INTEGRATION CURRENT AND FUTURE TYPE ANALYSIS, 2025–2034, (USD MILLION)
FIGURE 66 GERMANY CARBON TRADING AND BLOCKCHAIN INTEGRATION CURRENT AND FUTURE END USER ANALYSIS, 2025–2034, (USD MILLION)
FIGURE 67 FRANCE CARBON TRADING AND BLOCKCHAIN INTEGRATION CURRENT AND FUTURE TYPE ANALYSIS, 2025–2034, (USD MILLION)
FIGURE 68 FRANCE CARBON TRADING AND BLOCKCHAIN INTEGRATION CURRENT AND FUTURE END USER ANALYSIS, 2025–2034, (USD MILLION)
FIGURE 69 UK CARBON TRADING AND BLOCKCHAIN INTEGRATION CURRENT AND FUTURE TYPE ANALYSIS, 2025–2034, (USD MILLION)
FIGURE 70 UK CARBON TRADING AND BLOCKCHAIN INTEGRATION CURRENT AND FUTURE END USER ANALYSIS, 2025–2034, (USD MILLION)
FIGURE 71 SPAIN CARBON TRADING AND BLOCKCHAIN INTEGRATION CURRENT AND FUTURE TYPE ANALYSIS, 2025–2034, (USD MILLION)
FIGURE 72 SPAIN CARBON TRADING AND BLOCKCHAIN INTEGRATION CURRENT AND FUTURE END USER ANALYSIS, 2025–2034, (USD MILLION)
FIGURE 73 ITALY CARBON TRADING AND BLOCKCHAIN INTEGRATION CURRENT AND FUTURE TYPE ANALYSIS, 2025–2034, (USD MILLION)
FIGURE 74 ITALY CARBON TRADING AND BLOCKCHAIN INTEGRATION CURRENT AND FUTURE END USER ANALYSIS, 2025–2034, (USD MILLION)
FIGURE 75 REST OF WESTERN EUROPE CARBON TRADING AND BLOCKCHAIN INTEGRATION CURRENT AND FUTURE TYPE ANALYSIS, 2025–2034, (USD MILLION)
FIGURE 76 REST OF WESTERN EUROPE CARBON TRADING AND BLOCKCHAIN INTEGRATION CURRENT AND FUTURE END USER ANALYSIS, 2025–2034, (USD MILLION)
FIGURE 77 EAST ASIA AND PACIFIC CARBON TRADING AND BLOCKCHAIN INTEGRATION CURRENT AND FUTURE MARKET VOLUME SHARE REGIONAL ANALYSIS, 2025–2034, (USD MILLION)
FIGURE 78 CHINA CARBON TRADING AND BLOCKCHAIN INTEGRATION CURRENT AND FUTURE TYPE ANALYSIS, 2025–2034, (USD MILLION)
FIGURE 79 CHINA CARBON TRADING AND BLOCKCHAIN INTEGRATION CURRENT AND FUTURE END USER ANALYSIS, 2025–2034, (USD MILLION)
FIGURE 80 JAPAN CARBON TRADING AND BLOCKCHAIN INTEGRATION CURRENT AND FUTURE TYPE ANALYSIS, 2025–2034, (USD MILLION)
FIGURE 81 JAPAN CARBON TRADING AND BLOCKCHAIN INTEGRATION CURRENT AND FUTURE END USER ANALYSIS, 2025–2034, (USD MILLION)
FIGURE 82 AUSTRALIA CARBON TRADING AND BLOCKCHAIN INTEGRATION CURRENT AND FUTURE TYPE ANALYSIS, 2025–2034, (USD MILLION)
FIGURE 83 AUSTRALIA CARBON TRADING AND BLOCKCHAIN INTEGRATION CURRENT AND FUTURE END USER ANALYSIS, 2025–2034, (USD MILLION)
FIGURE 84 CAMBODIA CARBON TRADING AND BLOCKCHAIN INTEGRATION CURRENT AND FUTURE TYPE ANALYSIS, 2025–2034, (USD MILLION)
FIGURE 85 CAMBODIA CARBON TRADING AND BLOCKCHAIN INTEGRATION CURRENT AND FUTURE END USER ANALYSIS, 2025–2034, (USD MILLION)
FIGURE 86 FIJI CARBON TRADING AND BLOCKCHAIN INTEGRATION CURRENT AND FUTURE TYPE ANALYSIS, 2025–2034, (USD MILLION)
FIGURE 87 FIJI CARBON TRADING AND BLOCKCHAIN INTEGRATION CURRENT AND FUTURE END USER ANALYSIS, 2025–2034, (USD MILLION)
FIGURE 88 INDONESIA CARBON TRADING AND BLOCKCHAIN INTEGRATION CURRENT AND FUTURE TYPE ANALYSIS, 2025–2034, (USD MILLION)
FIGURE 89 INDONESIA CARBON TRADING AND BLOCKCHAIN INTEGRATION CURRENT AND FUTURE END USER ANALYSIS, 2025–2034, (USD MILLION)
FIGURE 90 SOUTH KOREA CARBON TRADING AND BLOCKCHAIN INTEGRATION CURRENT AND FUTURE TYPE ANALYSIS, 2025–2034, (USD MILLION)
FIGURE 91 SOUTH KOREA CARBON TRADING AND BLOCKCHAIN INTEGRATION CURRENT AND FUTURE END USER ANALYSIS, 2025–2034, (USD MILLION)
FIGURE 92 REST OF EAST ASIA AND PACIFIC CARBON TRADING AND BLOCKCHAIN INTEGRATION CURRENT AND FUTURE TYPE ANALYSIS, 2025–2034, (USD MILLION)
FIGURE 93 REST OF EAST ASIA AND PACIFIC CARBON TRADING AND BLOCKCHAIN INTEGRATION CURRENT AND FUTURE END USER ANALYSIS, 2025–2034, (USD MILLION)
FIGURE 94 SEA AND SOUTH ASIA CARBON TRADING AND BLOCKCHAIN INTEGRATION CURRENT AND FUTURE MARKET VOLUME SHARE REGIONAL ANALYSIS, 2025–2034, (USD MILLION)
FIGURE 95 BANGLADESH CARBON TRADING AND BLOCKCHAIN INTEGRATION CURRENT AND FUTURE TYPE ANALYSIS, 2025–2034, (USD MILLION)
FIGURE 96 BANGLADESH CARBON TRADING AND BLOCKCHAIN INTEGRATION CURRENT AND FUTURE END USER ANALYSIS, 2025–2034, (USD MILLION)
FIGURE 97 NEW ZEALAND CARBON TRADING AND BLOCKCHAIN INTEGRATION CURRENT AND FUTURE TYPE ANALYSIS, 2025–2034, (USD MILLION)
FIGURE 98 NEW ZEALAND CARBON TRADING AND BLOCKCHAIN INTEGRATION CURRENT AND FUTURE END USER ANALYSIS, 2025–2034, (USD MILLION)
FIGURE 99 INDIA CARBON TRADING AND BLOCKCHAIN INTEGRATION CURRENT AND FUTURE TYPE ANALYSIS, 2025–2034, (USD MILLION)
FIGURE 100 INDIA CARBON TRADING AND BLOCKCHAIN INTEGRATION CURRENT AND FUTURE END USER ANALYSIS, 2025–2034, (USD MILLION)
FIGURE 101 SINGAPORE CARBON TRADING AND BLOCKCHAIN INTEGRATION CURRENT AND FUTURE TYPE ANALYSIS, 2025–2034, (USD MILLION)
FIGURE 102 SINGAPORE CARBON TRADING AND BLOCKCHAIN INTEGRATION CURRENT AND FUTURE END USER ANALYSIS, 2025–2034, (USD MILLION)
FIGURE 103 THAILAND CARBON TRADING AND BLOCKCHAIN INTEGRATION CURRENT AND FUTURE TYPE ANALYSIS, 2025–2034, (USD MILLION)
FIGURE 104 THAILAND CARBON TRADING AND BLOCKCHAIN INTEGRATION CURRENT AND FUTURE END USER ANALYSIS, 2025–2034, (USD MILLION)
FIGURE 105 TAIWAN CARBON TRADING AND BLOCKCHAIN INTEGRATION CURRENT AND FUTURE TYPE ANALYSIS, 2025–2034, (USD MILLION)
FIGURE 106 TAIWAN CARBON TRADING AND BLOCKCHAIN INTEGRATION CURRENT AND FUTURE END USER ANALYSIS, 2025–2034, (USD MILLION)
FIGURE 107 MALAYSIA CARBON TRADING AND BLOCKCHAIN INTEGRATION CURRENT AND FUTURE TYPE ANALYSIS, 2025–2034, (USD MILLION)
FIGURE 108 MALAYSIA CARBON TRADING AND BLOCKCHAIN INTEGRATION CURRENT AND FUTURE END USER ANALYSIS, 2025–2034, (USD MILLION)
FIGURE 109 REST OF SEA AND SOUTH ASIA CARBON TRADING AND BLOCKCHAIN INTEGRATION CURRENT AND FUTURE TYPE ANALYSIS, 2025–2034, (USD MILLION)
FIGURE 110 REST OF SEA AND SOUTH ASIA CARBON TRADING AND BLOCKCHAIN INTEGRATION CURRENT AND FUTURE END USER ANALYSIS, 2025–2034, (USD MILLION)
FIGURE 111 MIDDLE EAST AND AFRICA CARBON TRADING AND BLOCKCHAIN INTEGRATION CURRENT AND FUTURE MARKET VOLUME SHARE REGIONAL ANALYSIS, 2025–2034, (USD MILLION)
FIGURE 112 GCC COUNTRIES CARBON TRADING AND BLOCKCHAIN INTEGRATION CURRENT AND FUTURE TYPE ANALYSIS, 2025–2034, (USD MILLION)
FIGURE 113 GCC COUNTRIES CARBON TRADING AND BLOCKCHAIN INTEGRATION CURRENT AND FUTURE END USER ANALYSIS, 2025–2034, (USD MILLION)
FIGURE 114 SAUDI ARABIA CARBON TRADING AND BLOCKCHAIN INTEGRATION CURRENT AND FUTURE TYPE ANALYSIS, 2025–2034, (USD MILLION)
FIGURE 115 SAUDI ARABIA CARBON TRADING AND BLOCKCHAIN INTEGRATION CURRENT AND FUTURE END USER ANALYSIS, 2025–2034, (USD MILLION)
FIGURE 116 UAE CARBON TRADING AND BLOCKCHAIN INTEGRATION CURRENT AND FUTURE TYPE ANALYSIS, 2025–2034, (USD MILLION)
FIGURE 117 UAE CARBON TRADING AND BLOCKCHAIN INTEGRATION CURRENT AND FUTURE END USER ANALYSIS, 2025–2034, (USD MILLION)
FIGURE 118 BAHRAIN CARBON TRADING AND BLOCKCHAIN INTEGRATION CURRENT AND FUTURE TYPE ANALYSIS, 2025–2034, (USD MILLION)
FIGURE 119 BAHRAIN CARBON TRADING AND BLOCKCHAIN INTEGRATION CURRENT AND FUTURE END USER ANALYSIS, 2025–2034, (USD MILLION)
FIGURE 120 KUWAIT CARBON TRADING AND BLOCKCHAIN INTEGRATION CURRENT AND FUTURE TYPE ANALYSIS, 2025–2034, (USD MILLION)
FIGURE 121 KUWAIT CARBON TRADING AND BLOCKCHAIN INTEGRATION CURRENT AND FUTURE END USER ANALYSIS, 2025–2034, (USD MILLION)
FIGURE 122 OMAN CARBON TRADING AND BLOCKCHAIN INTEGRATION CURRENT AND FUTURE TYPE ANALYSIS, 2025–2034, (USD MILLION)
FIGURE 123 OMAN CARBON TRADING AND BLOCKCHAIN INTEGRATION CURRENT AND FUTURE END USER ANALYSIS, 2025–2034, (USD MILLION)
FIGURE 124 QATAR CARBON TRADING AND BLOCKCHAIN INTEGRATION CURRENT AND FUTURE TYPE ANALYSIS, 2025–2034, (USD MILLION)
FIGURE 125 QATAR CARBON TRADING AND BLOCKCHAIN INTEGRATION CURRENT AND FUTURE END USER ANALYSIS, 2025–2034, (USD MILLION)
FIGURE 126 EGYPT CARBON TRADING AND BLOCKCHAIN INTEGRATION CURRENT AND FUTURE TYPE ANALYSIS, 2025–2034, (USD MILLION)
FIGURE 127 EGYPT CARBON TRADING AND BLOCKCHAIN INTEGRATION CURRENT AND FUTURE END USER ANALYSIS, 2025–2034, (USD MILLION)
FIGURE 128 NIGERIA CARBON TRADING AND BLOCKCHAIN INTEGRATION CURRENT AND FUTURE TYPE ANALYSIS, 2025–2034, (USD MILLION)
FIGURE 129 NIGERIA CARBON TRADING AND BLOCKCHAIN INTEGRATION CURRENT AND FUTURE END USER ANALYSIS, 2025–2034, (USD MILLION)
FIGURE 130 SOUTH AFRICA CARBON TRADING AND BLOCKCHAIN INTEGRATION CURRENT AND FUTURE TYPE ANALYSIS, 2025–2034, (USD MILLION)
FIGURE 131 SOUTH AFRICA CARBON TRADING AND BLOCKCHAIN INTEGRATION CURRENT AND FUTURE END USER ANALYSIS, 2025–2034, (USD MILLION)
FIGURE 132 ISRAEL CARBON TRADING AND BLOCKCHAIN INTEGRATION CURRENT AND FUTURE TYPE ANALYSIS, 2025–2034, (USD MILLION)
FIGURE 133 ISRAEL CARBON TRADING AND BLOCKCHAIN INTEGRATION CURRENT AND FUTURE END USER ANALYSIS, 2025–2034, (USD MILLION)
FIGURE 134 REST OF MEA CARBON TRADING AND BLOCKCHAIN INTEGRATION CURRENT AND FUTURE TYPE ANALYSIS, 2025–2034, (USD MILLION)
FIGURE 135 REST OF MEA CARBON TRADING AND BLOCKCHAIN INTEGRATION CURRENT AND FUTURE END USER ANALYSIS, 2025–2034, (USD MILLION)
FIGURE 136 U. S. MARKET SHARE ANALYSIS BY TYPE (2024)
FIGURE 137 U. S. MARKET SHARE ANALYSIS BY END USER (2024)
FIGURE 138 CANADA MARKET SHARE ANALYSIS BY TYPE (2024)
FIGURE 139 CANADA MARKET SHARE ANALYSIS BY END USER (2024)
FIGURE 140 MEXICO MARKET SHARE ANALYSIS BY TYPE (2024)
FIGURE 141 MEXICO MARKET SHARE ANALYSIS BY END USER (2024)
FIGURE 142 CHINA MARKET SHARE ANALYSIS BY TYPE (2024)
FIGURE 143 CHINA MARKET SHARE ANALYSIS BY END USER (2024)
FIGURE 144 JAPAN MARKET SHARE ANALYSIS BY TYPE (2024)
FIGURE 145 JAPAN MARKET SHARE ANALYSIS BY END USER (2024)
FIGURE 146 INDIA MARKET SHARE ANALYSIS BY TYPE (2024)
FIGURE 147 INDIA MARKET SHARE ANALYSIS BY END USER (2024)
FIGURE 148 SOUTH KOREA MARKET SHARE ANALYSIS BY TYPE (2024)
FIGURE 149 SOUTH KOREA MARKET SHARE ANALYSIS BY END USER (2024)
FIGURE 150 SAUDI ARABIA MARKET SHARE ANALYSIS BY TYPE (2024)
FIGURE 151 SAUDI ARABIA MARKET SHARE ANALYSIS BY END USER (2024)
FIGURE 152 UAE MARKET SHARE ANALYSIS BY TYPE (2024)
FIGURE 153 UAE MARKET SHARE ANALYSIS BY END USER (2024)
FIGURE 154 EGYPT MARKET SHARE ANALYSIS BY TYPE (2024)
FIGURE 155 EGYPT MARKET SHARE ANALYSIS BY END USER (2024)
FIGURE 156 NIGERIA MARKET SHARE ANALYSIS BY TYPE (2024)
FIGURE 157 NIGERIA MARKET SHARE ANALYSIS BY END USER (2024)
FIGURE 158 SOUTH AFRICA MARKET SHARE ANALYSIS BY TYPE (2024)
FIGURE 159 SOUTH AFRICA MARKET SHARE ANALYSIS BY END USER (2024)
FIGURE 160 GERMANY MARKET SHARE ANALYSIS BY TYPE (2024)
FIGURE 161 GERMANY MARKET SHARE ANALYSIS BY END USER (2024)
FIGURE 162 FRANCE MARKET SHARE ANALYSIS BY TYPE (2024)
FIGURE 163 FRANCE MARKET SHARE ANALYSIS BY END USER (2024)
FIGURE 164 UK MARKET SHARE ANALYSIS BY TYPE (2024)
FIGURE 165 UK MARKET SHARE ANALYSIS BY END USER (2024)
FIGURE 166 SPAIN MARKET SHARE ANALYSIS BY TYPE (2024)
FIGURE 167 SPAIN MARKET SHARE ANALYSIS BY END USER (2024)
FIGURE 168 ITALY MARKET SHARE ANALYSIS BY TYPE (2024)
FIGURE 169 ITALY MARKET SHARE ANALYSIS BY END USER (2024)
FIGURE 170 BRAZIL MARKET SHARE ANALYSIS BY TYPE (2024)
FIGURE 171 BRAZIL MARKET SHARE ANALYSIS BY END USER (2024)
FIGURE 172 ARGENTINA MARKET SHARE ANALYSIS BY TYPE (2024)
FIGURE 173 ARGENTINA MARKET SHARE ANALYSIS BY END USER (2024)
FIGURE 174 COLUMBIA MARKET SHARE ANALYSIS BY TYPE (2024)
FIGURE 175 COLUMBIA MARKET SHARE ANALYSIS BY END USER (2024)
FIGURE 176 GLOBAL CARBON TRADING AND BLOCKCHAIN INTEGRATION CURRENT AND FUTURE MARKET KEY COUNTRY LEVEL ANALYSIS, 2024–2034, (USD MILLION)
FIGURE 177 FINANCIAL OVERVIEW:
Key Players Analysis:
IBM: IBM offers blockchain solutions that enhance transparency and efficiency in carbon credit transactions. Their IBM Blockchain platform enables organizations to track carbon emissions and trade credits securely. With a global presence, including offices in North America and Europe, IBM focuses on partnering with businesses to drive sustainability through innovative technology solutions.
Microsoft: Microsoft's sustainability initiatives include the use of blockchain technology for carbon credits through its Azure Blockchain Service. The company aims to become carbon negative by 2030. Based in the U.S. with a global reach, Microsoft's strategy focuses on leveraging its cloud computing capabilities to provide scalable solutions for carbon management and trading.
Accenture: Accenture offers consulting services that help companies integrate sustainability and carbon trading into their business models. Their blockchain solutions provide transparency in carbon credit transactions. Operating worldwide, Accenture's strategy involves collaborating with organizations to develop tailored sustainability frameworks that enhance operational efficiency and support compliance with environmental regulations.
Goldman Sachs: Goldman Sachs is actively involved in carbon trading, providing financial services to facilitate investments in carbon credits and sustainable projects. With a strong presence in North America and Europe, their strategy focuses on expanding their ESG (Environmental, Social, and Governance) investment portfolio and leveraging market insights to guide clients in carbon markets.
JP Morgan Chase: JP Morgan Chase engages in carbon trading and offers services to help clients navigate carbon credit investments. Their commitment to sustainability includes financing renewable energy projects. With a global footprint, the company's strategy focuses on integrating sustainability into their core operations and expanding their advisory services related to carbon markets.
Citi: Citi provides carbon trading services and investment solutions, supporting clients in navigating the complexities of carbon markets. Their sustainability strategy includes financing green projects globally. With offices across North America, Europe, and Asia, Citi focuses on leveraging its financial expertise to drive sustainability initiatives and promote responsible investment practices.
Carbon Trust: The Carbon Trust is dedicated to accelerating the transition to a sustainable, low-carbon economy. They offer consulting services, carbon management tools, and verification for carbon credits. Based in the UK with international operations, the Carbon Trust focuses on partnering with businesses and governments to develop strategies for reducing carbon footprints and enhancing energy efficiency.
Verra: Verra operates the Verified Carbon Standard (VCS), one of the world's leading carbon credit certification programs. Their services help organizations quantify and verify carbon emissions reductions. With a global reach, Verra’s strategy involves expanding its standards and methodologies to encourage sustainable project development across various sectors.
South Pole: South Pole provides comprehensive climate solutions, including carbon credit trading and project development. They focus on renewable energy and sustainable forestry projects worldwide. Based in Switzerland with a global presence, South Pole's strategy emphasizes innovation in climate finance and helping businesses achieve their sustainability targets through effective carbon management solutions.
ClimatePartner: ClimatePartner offers solutions for businesses to calculate, reduce, and offset their carbon emissions. Their services include carbon footprint calculation and certification of climate-neutral products. Headquartered in Germany, ClimatePartner's strategy revolves around creating partnerships with companies to develop climate action plans and integrate sustainability into their business operations.
Market Key Players
IBM Corporation
Microsoft Corporation
SAP SE
Nasdaq Inc.
AirCarbon Exchange (ACX)
CarbonX
Verra
Toucan Protocol
ClimateTrade
Xpansiv CBL
Carbonplace
Everledger
ConsenSys
Flowcarbon
Blockchain for Climate Foundation
Accenture
Goldman Sachs
JP Morgan Chase
Citi
Carbon Trust
South Pole
ClimatePartner
Ecovadis
Baker Hughes
Enel X
Siemens
BP
Shell
TotalEnergies
Carbon Credits International
Climeworks
Nori
Driver
Regulatory Pressure for Emission Reductions
Governments worldwide are enacting stringent regulations to curb greenhouse gas emissions, significantly driving the carbon trading market. Initiatives like the Paris Agreement have set ambitious targets for countries, compelling businesses to comply with emissions reduction mandates. In regions like North America and Europe, cap-and-trade programs and carbon taxes incentivize organizations to adopt carbon trading practices actively. This regulatory framework ensures that companies factor the costs of emissions into their operations, making carbon credits a vital instrument for achieving compliance. The emphasis on sustainability by regulatory bodies not only fosters market growth but also encourages the adoption of innovative technologies, including blockchain, which enhances transparency and efficiency in trading processes.
Corporate Sustainability Initiatives
There is a growing trend among corporations to enhance their sustainability profiles, which is significantly propelling the carbon trading market. As consumers increasingly demand environmentally responsible practices, businesses are proactively investing in carbon offset programs to improve their public image and meet corporate social responsibility (CSR) goals. Many companies are purchasing carbon credits voluntarily, even in the absence of stringent regulatory requirements, as part of their sustainability strategies. This movement is particularly strong in sectors such as manufacturing, transportation, and energy, where carbon footprints are substantial. As organizations set ambitious net-zero targets, the demand for carbon credits will continue to rise, further fueling market expansion.
Technological Advancements in Blockchain
The integration of blockchain technology is revolutionizing the carbon trading market by enhancing transparency, traceability, and efficiency in transactions. Blockchain provides a decentralized and secure platform for tracking carbon credits, allowing stakeholders to verify the authenticity and origin of credits in real-time. This technology reduces the risk of fraud and improves trust among market participants, making trading more efficient and accessible. As blockchain solutions continue to evolve, they facilitate seamless trading processes and improve data management, making carbon trading more attractive to businesses. This technological innovation is anticipated to streamline carbon credit transactions and open new avenues for market growth as organizations seek reliable systems for emissions tracking.
Restraints
Limited Awareness and Understanding
One of the significant restraints affecting the carbon trading and blockchain integration market is the limited awareness and understanding of carbon trading mechanisms among smaller businesses. Many organizations, particularly small and medium-sized enterprises (SMEs), lack the knowledge required to navigate complex carbon markets. This knowledge gap can result in hesitation to participate in carbon trading, thus limiting market growth. Additionally, the intricacies involved in compliance with emissions regulations can be daunting, causing businesses to avoid engagement in carbon markets altogether. Educating and providing resources for these companies is crucial to unlocking their participation and fostering a more extensive carbon trading ecosystem.
Volatility of Carbon Credit Prices
The carbon trading market is inherently susceptible to fluctuations in carbon credit prices, which can be a significant restraint. Price volatility may deter companies from investing in carbon credits or participating in trading systems, as businesses seek to avoid financial risks associated with sudden price changes. Factors such as regulatory shifts, changes in supply and demand, and market speculation can impact carbon credit pricing unpredictably. This unpredictability can lead to reluctance among potential market participants, particularly those who may already be financially constrained. Establishing more stable pricing mechanisms and improving market transparency are essential to mitigate this restraint and encourage broader participation in carbon trading.
Opportunities
Expansion of Voluntary Carbon Markets
The growth of voluntary carbon markets presents a significant opportunity for expansion in the carbon trading sector. As more corporations recognize the value of sustainable practices and the importance of mitigating their carbon footprints, the demand for voluntary carbon credits is likely to surge. Companies are increasingly willing to invest in carbon offset projects to enhance their environmental credibility and fulfill CSR commitments. This growing trend offers immense potential for market participants to develop innovative carbon offset projects, from reforestation initiatives to renewable energy investments. By tapping into this opportunity, businesses can foster long-term growth while contributing to global sustainability efforts.
Adoption of Blockchain Solutions
The increasing adoption of blockchain technology in carbon trading presents a lucrative opportunity for market growth. As organizations seek efficient and transparent ways to manage carbon credits, blockchain offers a robust solution that enhances trust and accountability among stakeholders. This technology can streamline carbon credit transactions, reducing administrative burdens and costs associated with traditional trading methods. Furthermore, the integration of smart contracts within blockchain platforms can automate trading processes, making them faster and more secure. Companies that invest in blockchain solutions can differentiate themselves in a competitive market, positioning themselves as leaders in innovation and sustainability.
Trend
Rise of Digitalization in Carbon Trading
A notable trend in the carbon trading market is the increasing digitalization of trading processes. As businesses seek more efficient methods for tracking and trading carbon credits, digital platforms are becoming the norm. This trend encompasses the use of online trading platforms, advanced analytics, and blockchain technology to enhance transaction speed and accuracy. The digital transformation is expected to reduce operational costs and improve the accessibility of carbon markets for all participants, from large corporations to small businesses. As digital solutions gain traction, they will facilitate broader participation in carbon trading, ultimately contributing to more effective emissions reduction strategies across various industries.
Recent Development
In September 2024: The United Nations launched a new initiative aimed at enhancing the effectiveness and transparency of carbon markets globally. This initiative, part of the UN Climate Change Conference, aims to establish guidelines for monitoring and reporting carbon emissions and removals. The focus is on creating standardized practices that will improve trust in carbon credits and encourage more investment in carbon reduction projects.
In October 2024: Ripple, a leader in enterprise blockchain solutions, announced a $100 million commitment to strengthen and scale global carbon markets. This funding will support innovative carbon removal companies and climate-focused fintechs, as well as develop functionalities for carbon credit tokenization on the XRP Ledger. Ripple's initiative aims to improve market transparency and efficiency, addressing the pressing challenges of verification and certification in carbon markets.
Frequently Asked Questions
How big is the Carbon Trading and Blockchain Integration Market?
Explore the Global Carbon Trading and Blockchain Integration Market, projected to hit USD 33.8 Billion by 2034 from USD 12.8 Billion in 2024 at a CAGR of 11.9%. Driven by net-zero goals, transparent carbon credit systems, and blockchain adoption, this market is redefining sustainable finance worldwide.
Who are the major players in the Carbon Trading and Blockchain Integration Market?
IBM Corporation, Microsoft Corporation, SAP SE, Nasdaq Inc., AirCarbon Exchange (ACX), CarbonX, Verra, Toucan Protocol, ClimateTrade, Xpansiv CBL, Carbonplace, Everledger, ConsenSys, Flowcarbon, Blockchain for Climate Foundation, Accenture, Goldman Sachs, JP Morgan Chase, Citi, Carbon Trust, South Pole, ClimatePartner, Ecovadis, Baker Hughes, Enel X, Siemens, BP, Shell, TotalEnergies, Carbon Credits International, Climeworks, Nori
Which segments covered the Carbon Trading and Blockchain Integration Market?
By Type (Compliance Market, Voluntary Market), By Technology (Blockchain Technology, Traditional Technology), By Blockchain Type (Public Blockchain, Private Blockchain, Consortium Blockchain, Hybrid Blockchain), By End-User (Energy & Utilities, Manufacturing & Industrial, Financial Services & Trading Platforms, Government & Regulatory Bodies, Others), By Application (Carbon Credit Tracking & Trading, Renewable Energy Certificates (RECs), Emission Monitoring & Reporting, Smart Contracts for Carbon Trading, Others)
How can this market research report help my business make strategic decisions?
Our market research reports provide actionable intelligence, including verified market size data, CAGR projections, competitive benchmarking, and segment-level opportunity analysis. These insights support strategic planning, investment decisions, product development, and market entry strategies for enterprises and startups alike.
How frequently is the data updated?
We continuously monitor industry developments and update our reports to reflect regulatory changes, technological advancements, and macroeconomic shifts. Updated editions ensure you receive the latest market intelligence.

 Aerospace And Defence
 Agriculture
 Automotive And Transportation
 Banking And Finance
 Business
 Chemicals And Materials
 Consumer And Retail
 Electronics And Semiconductors
 Food And Beverages
 Machinery & Equipments
 Manufacturing And Construction
 Medical Devices
 Others
 Pharmaceuticals And Healthcare
 Power And Energy
 Sports
 Technology

, Technology (Blockchain Technology, Traditional Technology), End User (Power Generation, Transportation, Building and Construction, Manufacturing, Others), Region and Key Players - Industry Segment Overview, Market Dynamics, Competitive Strategies, Trends and Forecast 2025-2034")
, Technology (Blockchain Technology, Traditional Technology), End User (Power Generation, Transportation, Building and Construction, Manufacturing, Others), Region and Key Players - Industry Segment Overview, Market Dynamics, Competitive Strategies, Trends and Forecast 2025-2034")
, Technology (Blockchain Technology, Traditional Technology), End User (Power Generation, Transportation, Building and Construction, Manufacturing, Others), Region and Key Players - Industry Segment Overview, Market Dynamics, Competitive Strategies, Trends and Forecast 2025-2034")
, Technology (Blockchain Technology, Traditional Technology), End User (Power Generation, Transportation, Building and Construction, Manufacturing, Others), Region and Key Players - Industry Segment Overview, Market Dynamics, Competitive Strategies, Trends and Forecast 2025-2034")

