Global Caviar Market Size, Share & Luxury Food Industry Analysis By Product Type (Beluga, Osetra, Sevruga), By Source (Wild, Farmed), By Distribution Channel, Consumer Trends, Regional Demand Outlook, Key Producers & Forecast 2025–2034
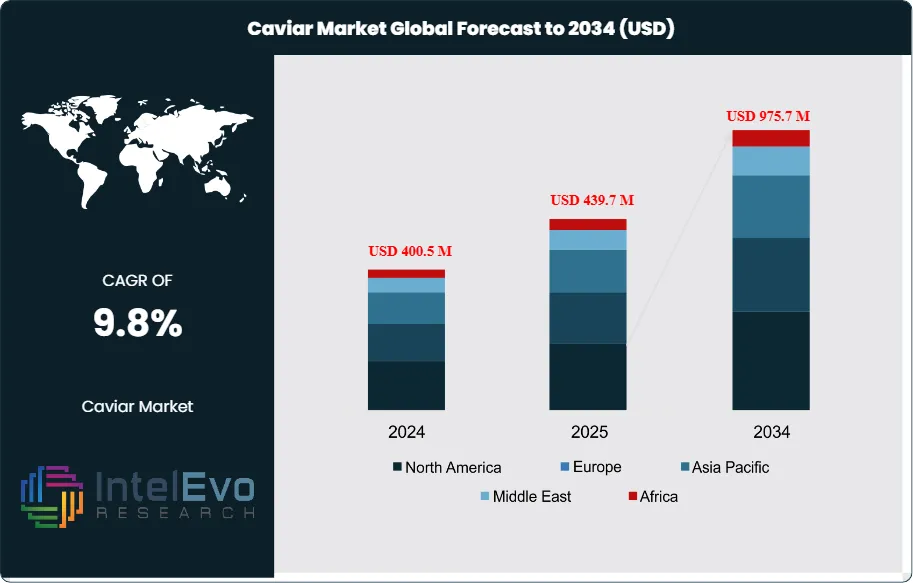
The Caviar Market is estimated at USD 400.5 million in 2024 and is projected to reach approximately USD 975.7 million by 2034, registering a CAGR of about 9.8% during 2025–2034. Market growth is increasingly value-driven rather than volume-led, supported by premium pricing, controlled supply, and rising demand from luxury food and gifting segments. Legal aquaculture now supplies over 95% of global volumes, following strict trade controls enforced under CITES, which have effectively constrained wild sturgeon harvesting.
Average retail prices remain elevated, ranging from USD 1,200–6,000 per kilogram for Osetra and USD 5,000–10,000 per kilogram for Beluga, sustaining revenue expansion even during periods of volume volatility. Between 2019 and 2023, global production volumes increased at an estimated 5–6% CAGR, while market value grew faster at 7–8% CAGR, driven by premium product mix, improved traceability, and brand differentiation. Beluga, Osetra, and Sevruga together account for nearly 70% of premium-grade sales, while American sturgeon species have regained traction in the U.S., now representing around 15% of domestic consumption.
From an end-use perspective, foodservice continues to dominate, accounting for roughly 60% of global demand, supported by fine-dining, chef-driven tasting menus, and luxury hospitality. At the same time, online gourmet retail has expanded rapidly and now represents approximately 18% of sales in key markets, reflecting growth in direct-to-consumer luxury food purchasing. Non-food applications—including cosmetics and nutraceuticals—contribute 5–7% of total revenue, with demand rising on the back of protein, omega-rich lipid, and vitamin B12 positioning.
Supply-side advancements are reinforcing long-term growth potential. Increased aquaculture investment is expanding production capacity through recirculating aquaculture systems, while improved broodstock management has shortened harvest cycles by 6–12 months. Technologies such as machine vision, ultrasound-based sex identification, DNA barcoding, and tamper-proof labeling are improving roe yield, enhancing quality consistency, and reducing fraud risk—critical factors for sustaining premium pricing and consumer trust.
However, structural constraints remain. Long biological maturation cycles of 6–10 years continue to tie up capital, while feed, energy, and cold-chain logistics costs pressure producer margins. Trade restrictions, sanctions, and quota regimes are reshaping global flows, while poaching and counterfeit products pose ongoing brand risks. Regionally, Europe leads consumption with an estimated 47–50% share, followed by North America at 26–28%, characterized by strong holiday seasonality. China is the largest producer and a rapidly growing consumer, with Asia Pacific projected to expand at 10–12% CAGR through 2034. The Gulf region is emerging as an investment hotspot as luxury hospitality accelerates in the UAE and Saudi Arabia, with leading opportunities centered on farm automation, branded D2C channels, and certified sustainability labels that can command 8–15% price premiums.
Key Takeaways
Market Growth: The global caviar market stood at USD 400.5 million in 2024. It is projected to reach USD 975.7 million by 2034 at 9.8% CAGR, driven by premium pricing, expanding aquaculture capacity, and high-end dining demand.
Product Type: Sevruga leads with a 39.4% share due to wider farm availability and more accessible pricing than Beluga. Osetra continues to gain in premium retail mixes where price elasticity is lower.
Sales Channel: On-trade captures 67.2% of sales; restaurants account for 62.3% by application, underscoring foodservice dependence. You should plan for Q4 holiday peaks and chef-driven tasting menus.
Driver: Legal aquaculture supplies exceed 90% of volumes under CITES oversight, stabilizing availability. Online gourmet retail has reached roughly 15–20% of sales in key markets, with brands such as Kaluga Queen, Petrossian, and Marky’s expanding D2C offerings.
Restraint: Long sturgeon maturation cycles of 6–10 years limit rapid supply response and tie up working capital. Feed and energy together comprise over 50% of farm operating costs, squeezing margins during input price spikes.
Opportunity: Certified sustainability and full-traceability labels command 8–15% price premiums; you can convert mix upgrades in luxury retail and hospitality. Asia Pacific offers a 9–11% CAGR through 2034, anchored by China’s producer-consumer role.
Trend: Farms are scaling recirculating aquaculture systems and using imaging and ultrasound to improve sexing accuracy and roe yields. DNA barcoding and QR-backed traceability are spreading across top exporters, with Caviar House & Prunier and Kaluga Queen showcasing end-to-end provenance.
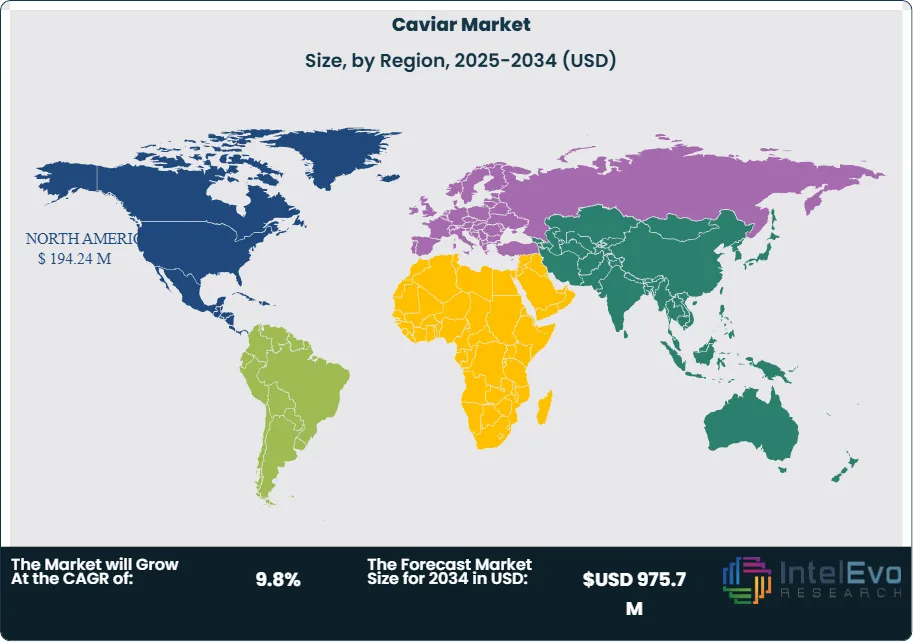
Regional Analysis: North America leads with 48.5% of revenue. Europe ranks second at roughly one-third of sales, while Asia Pacific is the fastest-growing region at 9–11% CAGR; the Gulf states are investment hotspots linked to luxury hospitality in the UAE and Saudi Arabia.
Product Analysis
Sevruga remains the anchor of premium demand. It held 39.4% of global revenue in 2024 on the back of consistent farmed supply, refined flavor, and pricing that sits below Beluga but above mass-market roe. You see steady menu placement in fine dining and luxury hospitality, supported by CITES-compliant aquaculture that now supplies more than 90% of volumes. Leading brands such as Kaluga Queen, Caviar House & Prunier, Petrossian, and Marky’s continue to shape assortment and provenance standards.
Osetra is gaining share in premium retail and direct-to-consumer channels due to its broader flavor range and stable availability. Salmon roe and “sushi” formats push volume in mid-tier foodservice and retail, where price sensitivity is higher and portion sizes are smaller. Expect mix upgrades in 2025–2028 as traceability, lot-level quality data, and chef-led pairings raise willingness to pay for labeled origin and sustainable practices.
Form Analysis
Fresh caviar led with 42.2% share in 2024. Fine dining prefers fresh for texture integrity and aroma; it carries a clear price premium versus preserved or frozen alternatives. Adoption benefits from tighter cold-chain control, shorter farm-to-kitchen lead times, and batch-level certificates that reassure buyers on species and feed practices.
Preserved and frozen formats scale exports and expand reach in specialty retail and e-commerce. These formats sustain quality over longer transits and reduce waste for smaller buyers. You should expect mid-single-digit growth in preserved volumes through 2029 as online gourmet marketplaces widen assortment and as QR-linked authenticity checks reduce substitution risk. Dried products remain niche and occasion-led.
Application Analysis
Restaurants accounted for 62.3% of demand in 2024. Tasting menus, omakase counters, and event catering drive consistent throughput, particularly in Q4 holiday periods. Higher check sizes and curated service support premium pricing for Sevruga and Osetra, while salmon roe underpins volume-led dishes.
Household consumption is smaller but rising with D2C fulfillment and insulated packaging. Online gourmet retail has reached roughly 15–20% of sales in key markets, improving access for first-time buyers. Expect growth from 10–50 gram packs, curated gift sets, and subscription models that emphasize provenance, freshness windows, and serving guidance.
Sales Channel Analysis
On-trade dominated with 67.2% share in 2024. Hotels, restaurants, and bars monetize presentation, pairing, and service, which reinforce brand equity and reduce perceived risk at the point of consumption. Seasonal events and luxury hospitality pipelines in North America and the Gulf sustain volume resilience.
Off-trade is building momentum via specialty retailers and brand-owned storefronts. Petrossian, Marky’s, and Kaluga Queen have expanded D2C assortments with smaller formats and temperature-stable logistics. Certified sustainability and full-traceability labels capture 8–15% price premiums, improving margins even as basket sizes remain modest. You should plan for steady off-trade growth through 2028 as authentication tools and consumer education improve trust.
Regional Analysis
North America led with 48.5% of revenue in 2024 and is set to maintain leadership through 2030. The United States anchors demand with luxury dining, corporate gifting, and event-led spikes. Health positioning around omega-3 and high-quality protein supports adoption in high-income households, while specialty retailers and online channels expand reach across tier-1 metros.
Europe ranked second at roughly one-third of global sales, sustained by France, Italy, Germany, and the UK. Asia Pacific is the fastest-growing region with an expected 9–11% CAGR through 2034. China is both the largest producer and a rising consumer; Japan and South Korea add stable sushi-driven demand; Australia is expanding luxury hospitality.
Latin America remains a small but growing destination, led by Mexico and Brazil in premium retail and high-end hotels. The Middle East and Africa are investment hotspots. The UAE and Saudi Arabia continue to open luxury properties that raise on-trade throughput and support year-round availability via air-freight cold chains.
Product Type (Beluga Caviar, Osetra Caviar, Sevruga Caviar, American Sturgeon Varieties, Salmon Roe and Alternative Roe Products, Others (Hybrid and Farm-Specific Grades)), Form (Fresh Caviar, Preserved and Frozen Caviar, Dried and Specialty Formats), Source (Aquaculture-Based Caviar, Wild-Sourced (Restricted / Legacy Trade), Sustainability and Certification Status), Sales Channel (On-Trade Channel, Off-Trade Channel), Application (Restaurants and Foodservice, Household Consumption, Gifting and Subscription-Based Consumption, Others)
Research Methodology
Primary Research- 100 Interviews of Stakeholders
Secondary Research
Desk Research
Regional scope
North America (United States, Canada, Mexico)
Latin America (Brazil, Argentina, Columbia)
East Asia And Pacific (China, Japan, South Korea, Australia, Cambodia, Fiji, Indonesia)
Sea And South Asia (India, Singapore, Thailand, Taiwan, Malaysia)
Eastern Europe (Poland, Russia, Czech Republic, Romania)
Western Europe (Germany, U.K., France, Spain, Itlay)
Middle East & Africa (GCC Countries, Egypt, Nigeria, South Africa, Israel)
Competitive Landscape
Caviar House & Prunier, Agroittica Lombarda, Calvisius Caviar, Sterling Caviar, Sturgeon AquaFarms, Beluga Farm, Caspian Tradition, Karat Caviar, Plaza Caviar, Ossetra Caviar Company
Customization Scope
Customization for segments, region/country-level will be provided. Moreover, additional customization can be done based on the requirements.
Pricing and Purchase Options
Avail customized purchase options to meet your exact research needs. We have three licenses to opt for: Single User License, Multi-User License (Up to 5 Users), Corporate Use License (Unlimited User and Printable PDF).
TABLE OF CONTENTS
1. EXECUTIVE SUMMARY
1.1. MARKET SNAPSHOT
1.2. KEY FINDINGS & INSIGHTS
1.3. ANALYST RECOMMENDATIONS
1.4. FUTURE OUTLOOK
2. RESEARCH METHODOLOGY
2.1. MARKET DEFINITION & SCOPE
2.2. RESEARCH OBJECTIVES: PRIMARY & SECONDARY DATA SOURCES
2.3. DATA COLLECTION SOURCES
2.3.1. COVERAGE OF 100+ PRIMARY RESEARCH/CONSULTATION CALLS WITH INDUSTRY STAKEHOLDERS
FIGURE 17 NORTH AMERICA CAVIAR CURRENT AND FUTURE TYPE ANALYSIS, 2025–2034, (USD MILLION)
FIGURE 18 NORTH AMERICA CAVIAR CURRENT AND FUTURE END USER ANALYSIS, 2025–2034, (USD MILLION)
FIGURE 19 MARKET SHARE BY COUNTRY
FIGURE 20 LATIN AMERICA CAVIAR CURRENT AND FUTURE TYPE ANALYSIS, 2025–2034, (USD MILLION)
FIGURE 21 LATIN AMERICA CAVIAR CURRENT AND FUTURE END USER ANALYSIS, 2025–2034, (USD MILLION)
FIGURE 22 MARKET SHARE BY COUNTRY
FIGURE 23 EASTERN EUROPE CAVIAR CURRENT AND FUTURE TYPE ANALYSIS, 2025–2034, (USD MILLION)
FIGURE 24 EASTERN EUROPE CAVIAR CURRENT AND FUTURE END USER ANALYSIS, 2025–2034, (USD MILLION)
FIGURE 25 MARKET SHARE BY COUNTRY
FIGURE 26 WESTERN EUROPE CAVIAR CURRENT AND FUTURE TYPE ANALYSIS, 2025–2034, (USD MILLION)
FIGURE 27 WESTERN EUROPE CAVIAR CURRENT AND FUTURE END USER ANALYSIS, 2025–2034, (USD MILLION)
FIGURE 28 MARKET SHARE BY COUNTRY
FIGURE 29 EAST ASIA AND PACIFIC CAVIAR CURRENT AND FUTURE TYPE ANALYSIS, 2025–2034, (USD MILLION)
FIGURE 30 EAST ASIA AND PACIFIC CAVIAR CURRENT AND FUTURE END USER ANALYSIS, 2025–2034, (USD MILLION)
FIGURE 31 MARKET SHARE BY COUNTRY
FIGURE 32 SEA AND SOUTH ASIA CAVIAR CURRENT AND FUTURE TYPE ANALYSIS, 2025–2034, (USD MILLION)
FIGURE 33 SEA AND SOUTH ASIA CAVIAR CURRENT AND FUTURE END USER ANALYSIS, 2025–2034, (USD MILLION)
FIGURE 34 MARKET SHARE BY COUNTRY
FIGURE 35 MIDDLE EAST AND AFRICA CAVIAR CURRENT AND FUTURE TYPE ANALYSIS, 2025–2034, (USD MILLION)
FIGURE 36 MIDDLE EAST AND AFRICA CAVIAR CURRENT AND FUTURE END USER ANALYSIS, 2025–2034, (USD MILLION)
FIGURE 37 NORTH AMERICA CAVIAR CURRENT AND FUTURE MARKET VOLUME SHARE REGIONAL ANALYSIS, 2025–2034, (USD MILLION)
FIGURE 38 U.S. CAVIAR CURRENT AND FUTURE TYPE ANALYSIS, 2025–2034, (USD MILLION)
FIGURE 39 U.S. CAVIAR CURRENT AND FUTURE END USER ANALYSIS, 2025–2034, (USD MILLION)
FIGURE 40 CANADA CAVIAR CURRENT AND FUTURE TYPE ANALYSIS, 2025–2034, (USD MILLION)
FIGURE 41 CANADA CAVIAR CURRENT AND FUTURE END USER ANALYSIS, 2025–2034, (USD MILLION)
FIGURE 42 LATIN AMERICA CAVIAR CURRENT AND FUTURE MARKET VOLUME SHARE REGIONAL ANALYSIS, 2025–2034, (USD MILLION)
FIGURE 43 MEXICO CAVIAR CURRENT AND FUTURE TYPE ANALYSIS, 2025–2034, (USD MILLION)
FIGURE 44 MEXICO CAVIAR CURRENT AND FUTURE END USER ANALYSIS, 2025–2034, (USD MILLION)
FIGURE 45 BRAZIL CAVIAR CURRENT AND FUTURE TYPE ANALYSIS, 2025–2034, (USD MILLION)
FIGURE 46 BRAZIL CAVIAR CURRENT AND FUTURE END USER ANALYSIS, 2025–2034, (USD MILLION)
FIGURE 47 ARGENTINA CAVIAR CURRENT AND FUTURE TYPE ANALYSIS, 2025–2034, (USD MILLION)
FIGURE 48 ARGENTINA CAVIAR CURRENT AND FUTURE END USER ANALYSIS, 2025–2034, (USD MILLION)
FIGURE 49 COLUMBIA CAVIAR CURRENT AND FUTURE TYPE ANALYSIS, 2025–2034, (USD MILLION)
FIGURE 50 COLUMBIA CAVIAR CURRENT AND FUTURE END USER ANALYSIS, 2025–2034, (USD MILLION)
FIGURE 51 REST OF LATIN AMERICA CAVIAR CURRENT AND FUTURE TYPE ANALYSIS, 2025–2034, (USD MILLION)
FIGURE 52 REST OF LATIN AMERICA CAVIAR CURRENT AND FUTURE END USER ANALYSIS, 2025–2034, (USD MILLION)
FIGURE 53 EASTERN EUROPE CAVIAR CURRENT AND FUTURE MARKET VOLUME SHARE REGIONAL ANALYSIS, 2025–2034, (USD MILLION)
FIGURE 54 POLAND CAVIAR CURRENT AND FUTURE TYPE ANALYSIS, 2025–2034, (USD MILLION)
FIGURE 55 POLAND CAVIAR CURRENT AND FUTURE END USER ANALYSIS, 2025–2034, (USD MILLION)
FIGURE 56 RUSSIA CAVIAR CURRENT AND FUTURE TYPE ANALYSIS, 2025–2034, (USD MILLION)
FIGURE 57 RUSSIA CAVIAR CURRENT AND FUTURE END USER ANALYSIS, 2025–2034, (USD MILLION)
FIGURE 58 CZECH REPUBLIC CAVIAR CURRENT AND FUTURE TYPE ANALYSIS, 2025–2034, (USD MILLION)
FIGURE 59 CZECH REPUBLIC CAVIAR CURRENT AND FUTURE END USER ANALYSIS, 2025–2034, (USD MILLION)
FIGURE 60 ROMANIA CAVIAR CURRENT AND FUTURE TYPE ANALYSIS, 2025–2034, (USD MILLION)
FIGURE 61 ROMANIA CAVIAR CURRENT AND FUTURE END USER ANALYSIS, 2025–2034, (USD MILLION)
FIGURE 62 REST OF EASTERN EUROPE CAVIAR CURRENT AND FUTURE TYPE ANALYSIS, 2025–2034, (USD MILLION)
FIGURE 63 REST OF EASTERN EUROPE CAVIAR CURRENT AND FUTURE END USER ANALYSIS, 2025–2034, (USD MILLION)
FIGURE 64 WESTERN EUROPE CAVIAR CURRENT AND FUTURE MARKET VOLUME SHARE REGIONAL ANALYSIS, 2025–2034, (USD MILLION)
FIGURE 65 GERMANY CAVIAR CURRENT AND FUTURE TYPE ANALYSIS, 2025–2034, (USD MILLION)
FIGURE 66 GERMANY CAVIAR CURRENT AND FUTURE END USER ANALYSIS, 2025–2034, (USD MILLION)
FIGURE 67 FRANCE CAVIAR CURRENT AND FUTURE TYPE ANALYSIS, 2025–2034, (USD MILLION)
FIGURE 68 FRANCE CAVIAR CURRENT AND FUTURE END USER ANALYSIS, 2025–2034, (USD MILLION)
FIGURE 69 UK CAVIAR CURRENT AND FUTURE TYPE ANALYSIS, 2025–2034, (USD MILLION)
FIGURE 70 UK CAVIAR CURRENT AND FUTURE END USER ANALYSIS, 2025–2034, (USD MILLION)
FIGURE 71 SPAIN CAVIAR CURRENT AND FUTURE TYPE ANALYSIS, 2025–2034, (USD MILLION)
FIGURE 72 SPAIN CAVIAR CURRENT AND FUTURE END USER ANALYSIS, 2025–2034, (USD MILLION)
FIGURE 73 ITALY CAVIAR CURRENT AND FUTURE TYPE ANALYSIS, 2025–2034, (USD MILLION)
FIGURE 74 ITALY CAVIAR CURRENT AND FUTURE END USER ANALYSIS, 2025–2034, (USD MILLION)
FIGURE 75 REST OF WESTERN EUROPE CAVIAR CURRENT AND FUTURE TYPE ANALYSIS, 2025–2034, (USD MILLION)
FIGURE 76 REST OF WESTERN EUROPE CAVIAR CURRENT AND FUTURE END USER ANALYSIS, 2025–2034, (USD MILLION)
FIGURE 77 EAST ASIA AND PACIFIC CAVIAR CURRENT AND FUTURE MARKET VOLUME SHARE REGIONAL ANALYSIS, 2025–2034, (USD MILLION)
FIGURE 78 CHINA CAVIAR CURRENT AND FUTURE TYPE ANALYSIS, 2025–2034, (USD MILLION)
FIGURE 79 CHINA CAVIAR CURRENT AND FUTURE END USER ANALYSIS, 2025–2034, (USD MILLION)
FIGURE 80 JAPAN CAVIAR CURRENT AND FUTURE TYPE ANALYSIS, 2025–2034, (USD MILLION)
FIGURE 81 JAPAN CAVIAR CURRENT AND FUTURE END USER ANALYSIS, 2025–2034, (USD MILLION)
FIGURE 82 AUSTRALIA CAVIAR CURRENT AND FUTURE TYPE ANALYSIS, 2025–2034, (USD MILLION)
FIGURE 83 AUSTRALIA CAVIAR CURRENT AND FUTURE END USER ANALYSIS, 2025–2034, (USD MILLION)
FIGURE 84 CAMBODIA CAVIAR CURRENT AND FUTURE TYPE ANALYSIS, 2025–2034, (USD MILLION)
FIGURE 85 CAMBODIA CAVIAR CURRENT AND FUTURE END USER ANALYSIS, 2025–2034, (USD MILLION)
FIGURE 86 FIJI CAVIAR CURRENT AND FUTURE TYPE ANALYSIS, 2025–2034, (USD MILLION)
FIGURE 87 FIJI CAVIAR CURRENT AND FUTURE END USER ANALYSIS, 2025–2034, (USD MILLION)
FIGURE 88 INDONESIA CAVIAR CURRENT AND FUTURE TYPE ANALYSIS, 2025–2034, (USD MILLION)
FIGURE 89 INDONESIA CAVIAR CURRENT AND FUTURE END USER ANALYSIS, 2025–2034, (USD MILLION)
FIGURE 90 SOUTH KOREA CAVIAR CURRENT AND FUTURE TYPE ANALYSIS, 2025–2034, (USD MILLION)
FIGURE 91 SOUTH KOREA CAVIAR CURRENT AND FUTURE END USER ANALYSIS, 2025–2034, (USD MILLION)
FIGURE 92 REST OF EAST ASIA AND PACIFIC CAVIAR CURRENT AND FUTURE TYPE ANALYSIS, 2025–2034, (USD MILLION)
FIGURE 93 REST OF EAST ASIA AND PACIFIC CAVIAR CURRENT AND FUTURE END USER ANALYSIS, 2025–2034, (USD MILLION)
FIGURE 94 SEA AND SOUTH ASIA CAVIAR CURRENT AND FUTURE MARKET VOLUME SHARE REGIONAL ANALYSIS, 2025–2034, (USD MILLION)
FIGURE 95 BANGLADESH CAVIAR CURRENT AND FUTURE TYPE ANALYSIS, 2025–2034, (USD MILLION)
FIGURE 96 BANGLADESH CAVIAR CURRENT AND FUTURE END USER ANALYSIS, 2025–2034, (USD MILLION)
FIGURE 97 NEW ZEALAND CAVIAR CURRENT AND FUTURE TYPE ANALYSIS, 2025–2034, (USD MILLION)
FIGURE 98 NEW ZEALAND CAVIAR CURRENT AND FUTURE END USER ANALYSIS, 2025–2034, (USD MILLION)
FIGURE 99 INDIA CAVIAR CURRENT AND FUTURE TYPE ANALYSIS, 2025–2034, (USD MILLION)
FIGURE 100 INDIA CAVIAR CURRENT AND FUTURE END USER ANALYSIS, 2025–2034, (USD MILLION)
FIGURE 101 SINGAPORE CAVIAR CURRENT AND FUTURE TYPE ANALYSIS, 2025–2034, (USD MILLION)
FIGURE 102 SINGAPORE CAVIAR CURRENT AND FUTURE END USER ANALYSIS, 2025–2034, (USD MILLION)
FIGURE 103 THAILAND CAVIAR CURRENT AND FUTURE TYPE ANALYSIS, 2025–2034, (USD MILLION)
FIGURE 104 THAILAND CAVIAR CURRENT AND FUTURE END USER ANALYSIS, 2025–2034, (USD MILLION)
FIGURE 105 TAIWAN CAVIAR CURRENT AND FUTURE TYPE ANALYSIS, 2025–2034, (USD MILLION)
FIGURE 106 TAIWAN CAVIAR CURRENT AND FUTURE END USER ANALYSIS, 2025–2034, (USD MILLION)
FIGURE 107 MALAYSIA CAVIAR CURRENT AND FUTURE TYPE ANALYSIS, 2025–2034, (USD MILLION)
FIGURE 108 MALAYSIA CAVIAR CURRENT AND FUTURE END USER ANALYSIS, 2025–2034, (USD MILLION)
FIGURE 109 REST OF SEA AND SOUTH ASIA CAVIAR CURRENT AND FUTURE TYPE ANALYSIS, 2025–2034, (USD MILLION)
FIGURE 110 REST OF SEA AND SOUTH ASIA CAVIAR CURRENT AND FUTURE END USER ANALYSIS, 2025–2034, (USD MILLION)
FIGURE 111 MIDDLE EAST AND AFRICA CAVIAR CURRENT AND FUTURE MARKET VOLUME SHARE REGIONAL ANALYSIS, 2025–2034, (USD MILLION)
FIGURE 112 GCC COUNTRIES CAVIAR CURRENT AND FUTURE TYPE ANALYSIS, 2025–2034, (USD MILLION)
FIGURE 113 GCC COUNTRIES CAVIAR CURRENT AND FUTURE END USER ANALYSIS, 2025–2034, (USD MILLION)
FIGURE 114 SAUDI ARABIA CAVIAR CURRENT AND FUTURE TYPE ANALYSIS, 2025–2034, (USD MILLION)
FIGURE 115 SAUDI ARABIA CAVIAR CURRENT AND FUTURE END USER ANALYSIS, 2025–2034, (USD MILLION)
FIGURE 116 UAE CAVIAR CURRENT AND FUTURE TYPE ANALYSIS, 2025–2034, (USD MILLION)
FIGURE 117 UAE CAVIAR CURRENT AND FUTURE END USER ANALYSIS, 2025–2034, (USD MILLION)
FIGURE 118 BAHRAIN CAVIAR CURRENT AND FUTURE TYPE ANALYSIS, 2025–2034, (USD MILLION)
FIGURE 119 BAHRAIN CAVIAR CURRENT AND FUTURE END USER ANALYSIS, 2025–2034, (USD MILLION)
FIGURE 120 KUWAIT CAVIAR CURRENT AND FUTURE TYPE ANALYSIS, 2025–2034, (USD MILLION)
FIGURE 121 KUWAIT CAVIAR CURRENT AND FUTURE END USER ANALYSIS, 2025–2034, (USD MILLION)
FIGURE 122 OMAN CAVIAR CURRENT AND FUTURE TYPE ANALYSIS, 2025–2034, (USD MILLION)
FIGURE 123 OMAN CAVIAR CURRENT AND FUTURE END USER ANALYSIS, 2025–2034, (USD MILLION)
FIGURE 124 QATAR CAVIAR CURRENT AND FUTURE TYPE ANALYSIS, 2025–2034, (USD MILLION)
FIGURE 125 QATAR CAVIAR CURRENT AND FUTURE END USER ANALYSIS, 2025–2034, (USD MILLION)
FIGURE 126 EGYPT CAVIAR CURRENT AND FUTURE TYPE ANALYSIS, 2025–2034, (USD MILLION)
FIGURE 127 EGYPT CAVIAR CURRENT AND FUTURE END USER ANALYSIS, 2025–2034, (USD MILLION)
FIGURE 128 NIGERIA CAVIAR CURRENT AND FUTURE TYPE ANALYSIS, 2025–2034, (USD MILLION)
FIGURE 129 NIGERIA CAVIAR CURRENT AND FUTURE END USER ANALYSIS, 2025–2034, (USD MILLION)
FIGURE 130 SOUTH AFRICA CAVIAR CURRENT AND FUTURE TYPE ANALYSIS, 2025–2034, (USD MILLION)
FIGURE 131 SOUTH AFRICA CAVIAR CURRENT AND FUTURE END USER ANALYSIS, 2025–2034, (USD MILLION)
FIGURE 132 ISRAEL CAVIAR CURRENT AND FUTURE TYPE ANALYSIS, 2025–2034, (USD MILLION)
FIGURE 133 ISRAEL CAVIAR CURRENT AND FUTURE END USER ANALYSIS, 2025–2034, (USD MILLION)
FIGURE 134 REST OF MEA CAVIAR CURRENT AND FUTURE TYPE ANALYSIS, 2025–2034, (USD MILLION)
FIGURE 135 REST OF MEA CAVIAR CURRENT AND FUTURE END USER ANALYSIS, 2025–2034, (USD MILLION)
FIGURE 136 U. S. MARKET SHARE ANALYSIS BY TYPE (2024)
FIGURE 137 U. S. MARKET SHARE ANALYSIS BY END USER (2024)
FIGURE 138 CANADA MARKET SHARE ANALYSIS BY TYPE (2024)
FIGURE 139 CANADA MARKET SHARE ANALYSIS BY END USER (2024)
FIGURE 140 MEXICO MARKET SHARE ANALYSIS BY TYPE (2024)
FIGURE 141 MEXICO MARKET SHARE ANALYSIS BY END USER (2024)
FIGURE 142 CHINA MARKET SHARE ANALYSIS BY TYPE (2024)
FIGURE 143 CHINA MARKET SHARE ANALYSIS BY END USER (2024)
FIGURE 144 JAPAN MARKET SHARE ANALYSIS BY TYPE (2024)
FIGURE 145 JAPAN MARKET SHARE ANALYSIS BY END USER (2024)
FIGURE 146 INDIA MARKET SHARE ANALYSIS BY TYPE (2024)
FIGURE 147 INDIA MARKET SHARE ANALYSIS BY END USER (2024)
FIGURE 148 SOUTH KOREA MARKET SHARE ANALYSIS BY TYPE (2024)
FIGURE 149 SOUTH KOREA MARKET SHARE ANALYSIS BY END USER (2024)
FIGURE 150 SAUDI ARABIA MARKET SHARE ANALYSIS BY TYPE (2024)
FIGURE 151 SAUDI ARABIA MARKET SHARE ANALYSIS BY END USER (2024)
FIGURE 152 UAE MARKET SHARE ANALYSIS BY TYPE (2024)
FIGURE 153 UAE MARKET SHARE ANALYSIS BY END USER (2024)
FIGURE 154 EGYPT MARKET SHARE ANALYSIS BY TYPE (2024)
FIGURE 155 EGYPT MARKET SHARE ANALYSIS BY END USER (2024)
FIGURE 156 NIGERIA MARKET SHARE ANALYSIS BY TYPE (2024)
FIGURE 157 NIGERIA MARKET SHARE ANALYSIS BY END USER (2024)
FIGURE 158 SOUTH AFRICA MARKET SHARE ANALYSIS BY TYPE (2024)
FIGURE 159 SOUTH AFRICA MARKET SHARE ANALYSIS BY END USER (2024)
FIGURE 160 GERMANY MARKET SHARE ANALYSIS BY TYPE (2024)
FIGURE 161 GERMANY MARKET SHARE ANALYSIS BY END USER (2024)
FIGURE 162 FRANCE MARKET SHARE ANALYSIS BY TYPE (2024)
FIGURE 163 FRANCE MARKET SHARE ANALYSIS BY END USER (2024)
FIGURE 164 UK MARKET SHARE ANALYSIS BY TYPE (2024)
FIGURE 165 UK MARKET SHARE ANALYSIS BY END USER (2024)
FIGURE 166 SPAIN MARKET SHARE ANALYSIS BY TYPE (2024)
FIGURE 167 SPAIN MARKET SHARE ANALYSIS BY END USER (2024)
FIGURE 168 ITALY MARKET SHARE ANALYSIS BY TYPE (2024)
FIGURE 169 ITALY MARKET SHARE ANALYSIS BY END USER (2024)
FIGURE 170 BRAZIL MARKET SHARE ANALYSIS BY TYPE (2024)
FIGURE 171 BRAZIL MARKET SHARE ANALYSIS BY END USER (2024)
FIGURE 172 ARGENTINA MARKET SHARE ANALYSIS BY TYPE (2024)
FIGURE 173 ARGENTINA MARKET SHARE ANALYSIS BY END USER (2024)
FIGURE 174 COLUMBIA MARKET SHARE ANALYSIS BY TYPE (2024)
FIGURE 175 COLUMBIA MARKET SHARE ANALYSIS BY END USER (2024)
FIGURE 176 GLOBAL CAVIAR CURRENT AND FUTURE MARKET KEY COUNTRY LEVEL ANALYSIS, 2024–2034, (USD MILLION)
FIGURE 177 FINANCIAL OVERVIEW:
Key Player Analysis
Black River Caviar: Black River Caviar operates the world’s first Southern Hemisphere sturgeon farm in Uruguay and focuses on Russian Oscietra, positioning it as an innovator with provenance and sustainability at the core of its brand story. The company runs a vertically integrated breeding program with authentic Caspian-origin Oscietra broodstock and emphasizes zero-waste practices and locally sourced feed inputs, which appeal to Michelin-rated restaurants and premium hospitality buyers. Workforce scale sits in the 11–50 employee range, reinforcing a focused, specialty-player profile with direct relationships across fine dining and luxury travel. As aquaculture-led supply expands globally, the brand’s early-mover credentials and Southern Hemisphere terroir give you a differentiated sourcing narrative for premium menus and curated retail.
Agroittica Lombarda: Agroittica Lombarda, owner of Calvisius and Ars Italica, is one of the largest caviar producers globally and operates the largest sturgeon farm in Europe, with Friend of the Sea certification supporting its sustainability claims and export-led growth. The company has reported production capacity figures exceeding 20% of global caviar output and utilizes surplus industrial heat to stabilize optimal water temperatures, which improves biological performance and cost control at scale. Brand partnerships extend into aviation and premium channels, with historical placements cited on Lufthansa and Singapore Airlines, reinforcing visibility among high-spend travelers and corporate buyers. Expect steady institutional demand as Calvisius expands premium assortments across the EU and U.S., supported by diversified species portfolios and a mature export network.
California Caviar Company: California Caviar Company markets itself as a vertically integrated, sustainability-led producer serving top chefs and high-end consumers, led by founder Deborah Keane with a “spawn-to-serving” model and traceability focus. The portfolio spans premium Osetra and Siberian lines with retail pricing that can exceed USD 6,000 per jar for top grades, signaling strong positioning in the ultra-premium tier and the ability to capture gifting and tasting-menu occasions. The firm’s brand equity in sustainability and education underpins partnerships with culinary influencers and specialty retail, giving you access to consistent quality and certified sourcing for on-trade and D2C channels. U.S. market momentum in sustainable aquaculture and chef-driven assortments supports a challenger stance against larger European producers through 2025.
Caviar Blanc: Caviar Blanc is identified among key global players in multiple market assessments, indicating recognized participation in premium and specialty segments despite limited public disclosures on scale. Analyst coverage also cites the brand within leading-company cohorts and references a unified product focus, positioning it to compete on consistency, quality control, and targeted channel execution. In 2025, the brand’s relevance tracks with broader market growth of about 8–9% CAGR and the expansion of specialty retail and on-trade placements, giving you optionality for portfolio breadth where price and presentation tiers matter. As vegan and alternative caviar formats see rising adoption in select channels, adjacencies to sustainability narratives can support premium positioning if backed by transparent sourcing and certification.
Market Players
Caviar House & Prunier
Agroittica Lombarda
Calvisius Caviar
Sterling Caviar
Sturgeon AquaFarms
Beluga Farm
Caspian Tradition
Karat Caviar
Plaza Caviar
Ossetra Caviar Company
Driver
Channel expansion and format innovation broaden demand base
Caviar demand is growing in 2025 as chefs and premium brands introduce new formats and flavors in both high-end and mid-tier markets. While on-trade consumption stays strong at 67.2% of total sales, online gourmet retail has increased to 15 to 20% in key markets, making it easier to access beyond fine dining. Flavored and infused caviar lines now represent an estimated 12 to 15% of premium retail SKUs, showing a shift towards experimentation and occasion-driven consumption.
Legal aquaculture now provides over 90% of global volumes under CITES oversight, ensuring consistent availability and year-round menu integration. This stable supply supports a wider range of strategies, such as small-format SKUs, curated gift sets, and collaborations with chefs. Consequently, the market is expected to track an approximate 8.3% CAGR, reaching around USD 875 to 877 million by 2034, with growth increasingly influenced by premium mix optimization rather than just volume increases.
Restraint
Long biological cycles constrain rapid supply scaling
High unit prices and lengthy biological production cycles remain significant constraints. Female sturgeon typically need 6 to 10 years to reach roe harvest maturity, with spawning intervals of 1 to 3 years. This ties up capital and limits supply responsiveness. Such long cycles hinder rapid capacity expansion and raise financial risks, especially during periods of increasing demand.
Cost intensity and premium pricing limit mass adoption
Operating expenses are high, with feed and energy making up 50 to 60% of costs in recirculating aquaculture systems. Premium prices—USD 5,000 to 10,000 per kilogram for Beluga and USD 1,200 to 6,000 per kilogram for Osetra—further narrow household market penetration, focusing demand on restaurants and luxury retail. Margin volatility during spikes in input costs pushes producers to maintain value through provenance claims, portion control, and careful management of product mixes.
Opportunity
Cosmetics and nutraceuticals open high-margin adjacent markets
Non-food applications are growing from a small base, with cosmetics and nutraceuticals accounting for 5 to 7% of current caviar-related revenues. This share could increase to 10 to 12% by 2030, driven by omega-3 and vitamin B12 benefits. In the beauty sector, caviar extracts achieve 12 to 18% price premiums in serums, eye creams, and spa treatments, highlighting their margin potential.
Ingredient supply and clinical positioning strengthen value capture
In the supplements market, caviar-based complexes aim at anti-aging, energy, and cognitive wellness segments, with distribution expanding through clinics and premium e-commerce channels. Producers can create higher-margin portfolios by combining certified sourcing with clinical backing, while securing long-term B2B ingredient supply deals with beauty and wellness brands to stabilize demand and pricing.
Trend
Plant-based alternatives gain entry-level consumer traction
Sustainability is changing buying habits and boosting interest in plant-based and no-kill options. Seaweed-based caviar substitutes are projected to grow at about 20 to 25% CAGR through 2030, with unit penetration reaching 4 to 6% in specialty retail by 2025. Price points of USD 20 to 50 per 100 grams, along with allergen transparency, are drawing in first-time and environmentally conscious consumers.
No-kill harvesting and digital traceability reinforce premium positioning
Traditional producers are experimenting with no-kill stripping methods, which improve animal welfare and preserve broodstock value, though uptake is still limited. To maintain premium pricing on conventional roe, leading players are implementing QR-backed traceability, origin data, and sustainability certifications. A dual strategy of testing plant-based products for new consumers, while ensuring authenticity and provenance in premium offerings, helps brands meet evolving demand without compromising equity.
Recent Developments
Dec 2024 – Caviar House & Prunier: Announced Asian expansion with a new Tokyo boutique at Azabudai Hills and signaled a path to 40 outlets worldwide as it scales its French caviar retail footprint. The move strengthens brand reach in premium urban hubs and deepens access to high-spend travelers and luxury dining traffic in Asia.
Feb 2025 – Marky’s Caviar: Confirmed a Boston opening for spring 2025 and highlighted supply from its Sturgeon Aquafarms, the only legal producer of Beluga caviar in the U.S., to anchor ultra-premium assortments. The expansion builds a Northeast corridor presence and positions the brand to capture Q2–Q4 event and gifting demand.
Mar 2025 – Agroittica Lombarda: Divested its Fjord smoked seafood unit and named a new CEO to refocus on core caviar operations under the Calvisius and Ars Italica brands, with the transaction valued at over EUR XX million. The portfolio reshaping concentrates capital and management on higher-margin caviar and export-led growth.
Apr 2025 – Marky’s Caviar: Opened an eight-seat caviar bar and retail shop in Brookline with caviar flights, Champagne pairings, and curated gourmet assortments. The site extends direct-to-consumer reach and supports premium pricing through experiential on-premise service.
Jul 2025 – Kaluga Queen: Parent company Hangzhou Qiandaohu Xunlong Sci-Tech was reported to be weighing a Hong Kong IPO, with proceeds potentially over USD XX million to fund capacity and channel expansion. A listing would enhance balance sheet strength and global visibility for the world’s largest farmed caviar producer.
Sep 2025 – Caviar House & Prunier: Relocated its Hong Kong boutique to Landmark Prince’s to capture luxury retail footfall and align with flagship positioning. The relocation supports higher throughput per square foot and elevates brand presence ahead of the holiday season.