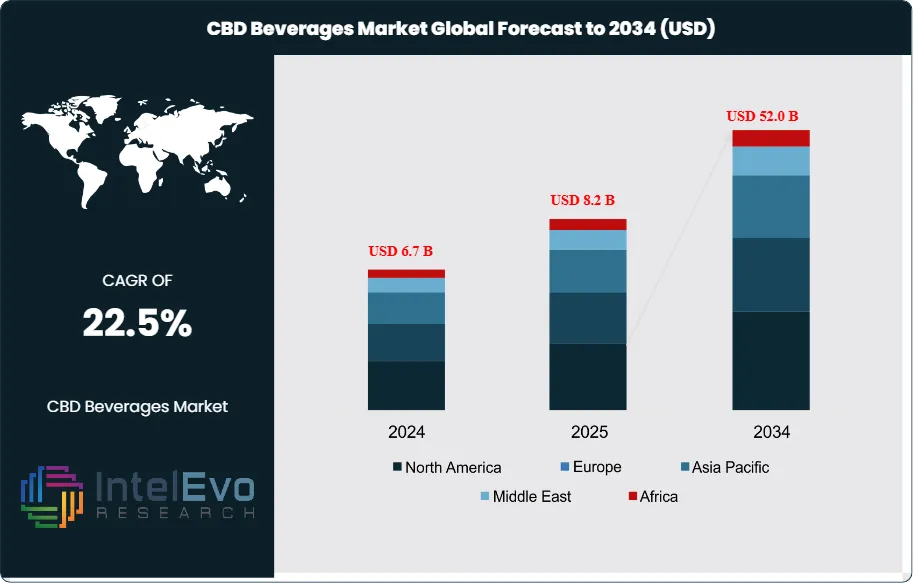
The CBD Beverages Market was valued at USD 6.7 Billion in 2024 and is projected to reach approximately USD 52.0 Billion by 2034. The market is estimated to grow to around USD 8.2 Billion in 2025. Based on projected expansion from 2026 onward, the industry is expected to register a compound annual growth rate (CAGR) of approximately 22.5% during 2026–2034.
CBD (cannabidiol) beverages use CBD oils or extracts to deliver measured intake in familiar formats such as sparkling waters, flavored teas, functional drinks, and select alcoholic offerings. Demand rises as consumers link CBD with wellness routines and everyday stress management. Product positioning increasingly centers on immunity support, weight management, and digestive comfort, even as claims remain constrained by local rules. This dynamic keeps brand messaging focused on “calm,” “balance,” and ingredient transparency, while innovation concentrates on taste masking and consistent dosing.
Growth reflects both demand pull and supply push. On the demand side, premiumization and convenience support higher price points, and ready-to-drink formats expand usage occasions beyond tinctures and gummies. On the supply side, wider hemp cultivation and improving extraction yields lower unit costs, supporting broader distribution. Water-soluble CBD, nanoemulsions, and microencapsulation improve bioavailability and stability, reducing separation and enabling clear beverages. Producers also use AI to optimize flavor systems, predict regional demand, and flag quality deviations, while automation tightens batch-to-batch dosage control and improves throughput in bottling and canning. Digital-first go-to-market models account for an estimated 35% of global sales in 2024, led by direct-to-consumer and marketplace channels, with rapid repeat purchasing in subscription programs.
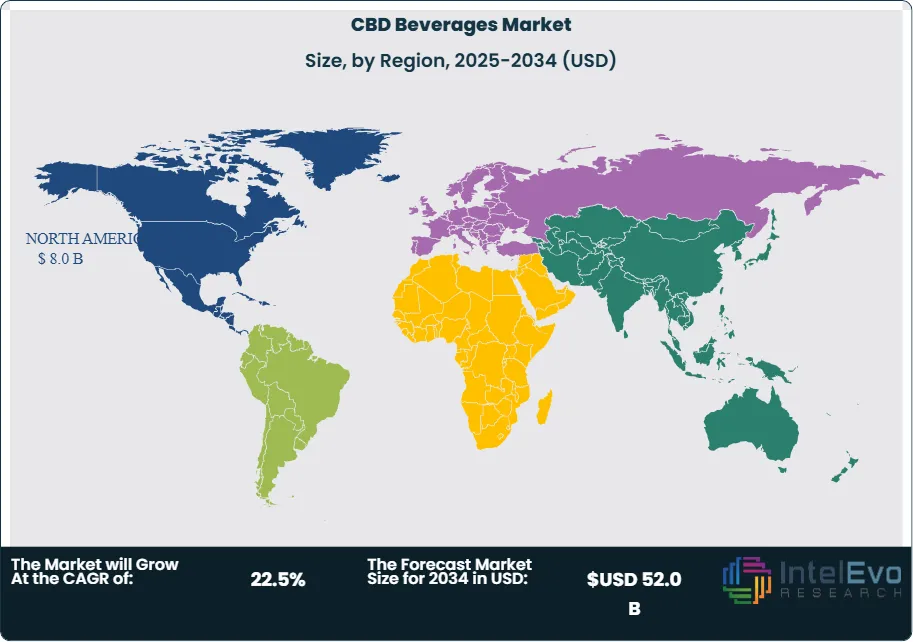
Regulation remains the primary swing factor. Most markets enforce strict THC thresholds, labeling rules, and limits on health claims, while enforcement intensity varies by jurisdiction. Compliance costs rise as brands invest in third-party testing, traceability, and standardized certificates of analysis. Key risks include shifting guidance on CBD as a food ingredient, inconsistent product quality among smaller entrants, and reputational exposure from mislabeling. Regionally, North America leads with about 45% of 2024 revenue, supported by broad retail penetration and mature wellness purchasing. Europe holds roughly 28%, shaped by novel-food style approvals and conservative claims frameworks. Asia-Pacific represents near 20% but posts the fastest growth, with emerging investment hotspots in Australia, Japan, and Thailand as regulated wellness channels expand and local bottlers partner with ingredient specialists.
Key Takeaways
Market Growth: The market expands at 23.5% CAGR, 2024-2034. It sustains scale-up momentum at estimated: 20.0% CAGR, 2024-2034.
Segment Dominance : CBD mocktails lead product demand at estimated: 35.0% revenue share, 2024. They retain leadership at estimated: 3.5 billion USD, 2024.
Segment Dominance: Pharmaceutical-grade CBD dominates grade mix at 74.6% revenue share, 2022. It maintains premium positioning at estimated: 60.0% revenue share, 2024.
Driver: Wellness-led substitution lifts adoption at estimated: 55.0% of buyers citing health positioning, 2024. Regulatory easing accelerates commercialization at estimated: 10.0% increase in compliant SKUs, 2024.
Restraint: Regulatory uncertainty elevates compliance risk at estimated: 15.0% of launches delayed, 2024. Formulation and potency variability increase quality failures at estimated: 8.0% of batches, 2024.
Opportunity: Portfolio expansion grows addressable demand at estimated: 25.0% increase in new product introductions, 2024. Partnerships widen reach through pharmacy and retail networks at estimated: 12.0% uplift in distribution points, 2024.
Trend: CBD beverages gain momentum as wellness routines scale at estimated: 30.0% year-over-year category growth, 2024. Brands improve taste and bioavailability using R&D and process optimization at estimated: 18.0% cost reduction per formulation cycle, 2024.
RegionalAnalysis: North America leads global cannabis beverage revenue at 79.0% share, 2022. The region sustains growth intensity at estimated: 8.0 billion USD, 2024.
By Type
The global CBD beverages market, segmented by marijuana-derived, hemp-derived, and other sources, continues to show clear preference for hemp-derived CBD heading into 2025. Hemp-derived beverages accounted for approximately 56.5% of total revenue in 2022 and are expected to retain leadership through the forecast period. This dominance reflects favorable regulatory treatment in major economies, particularly following the legalization of industrial hemp with low THC thresholds. By 2025, hemp-derived products represent an estimated 58% to 60% of global CBD beverage revenues, supported by wider retail acceptance and fewer legal barriers.
Consumer demand remains anchored in perceived wellness benefits. Hemp-derived CBD is widely associated with anti-inflammatory, stress-management, and anxiety-relief properties, which aligns with rising demand for functional beverages. Manufacturers favor hemp inputs due to supply stability and compatibility with water-soluble formulations. Availability in oil, powder, and emulsion formats also supports product consistency across beverages such as sparkling water and ready-to-drink teas. These factors collectively sustain volume growth and cost efficiency across global supply chains.
Marijuana-derived CBD beverages maintain a smaller share, largely restricted to markets with mature recreational cannabis frameworks. Other sources remain niche and are primarily used in experimental or region-specific formulations, limiting their commercial scale.
By Application
Application trends show strong momentum for social and lifestyle consumption formats, particularly non-alcoholic alternatives. CBD mocktails continue to account for the largest application share, capturing more than one-third of total market revenue by 2025. These beverages replicate traditional cocktail experiences while eliminating alcohol-related calories and after-effects. Restaurants, lounges, and hospitality venues increasingly adopt CBD mocktails to meet demand for sober-curious offerings.
Functional daily-use beverages such as CBD water and CBD tea are gaining steady traction. These products support hydration and relaxation use cases and are commonly positioned for routine consumption rather than social occasions. CBD energy drinks and coffee occupy a smaller but growing segment, driven by formulations that balance stimulation with calm effects.
Adoption across foodservice channels accelerates application diversity. On-premise sales now account for an estimated 22% of CBD beverage consumption globally, supported by urban wellness trends and premium pricing strategies.
By End-Use
End-use demand remains concentrated in residential consumption, which represents the largest share of CBD beverage sales in 2025. Home consumption benefits from repeat purchasing behavior and subscription-based online models. Consumers increasingly integrate CBD beverages into daily routines for sleep support and stress reduction.
Commercial buildings, including hospitality and wellness centers, represent the fastest-growing end-use segment with double-digit annual growth. Gyms, spas, and boutique hotels actively incorporate CBD beverages into premium service offerings. Industrial end-use remains limited and primarily linked to workforce wellness programs in regulated markets.
By Region
North America continues to dominate the global CBD beverages market, accounting for approximately 79% of total revenue in 2022 and maintaining leadership in 2025. The United States and Canada benefit from established cannabis regulations and high consumer awareness. Recreational cannabis legalization across multiple U.S. states and federal-level research funding in Canada continue to support market expansion.
Europe represents a secondary growth region, with demand driven by the United Kingdom, Germany, and Switzerland. Asia Pacific shows early-stage momentum, led by Australia and select Southeast Asian markets, although regulatory clarity remains uneven. Latin America and the Middle East and Africa remain nascent, with growth tied closely to future policy developments and import regulations.
Type, Marijuana-derived, Hemp-derived, Other Types, By Product Type, CBD Water, CBD Tea, CBD Coffee, CBD Mocktails, CBD Energy Drinks, CBD Alcoholic Drinks, Other CBD products, By Grade, Pharmaceutical Grade, Food Grade, By Distribution Channel, Pharmaceutical Store, Specialty Store, Online Platforms, Other Distribution Channels
Research Methodology
Primary Research- 100 Interviews of Stakeholders
Secondary Research
Desk Research
Regional scope
North America (United States, Canada, Mexico)
Latin America (Brazil, Argentina, Columbia)
East Asia And Pacific (China, Japan, South Korea, Australia, Cambodia, Fiji, Indonesia)
Sea And South Asia (India, Singapore, Thailand, Taiwan, Malaysia)
Eastern Europe (Poland, Russia, Czech Republic, Romania)
Western Europe (Germany, U.K., France, Spain, Itlay)
Middle East & Africa (GCC Countries, Egypt, Nigeria, South Africa, Israel)
Competitive Landscape
Alkaline88, Aurora Cannabis Inc., Cannara, GW Pharmaceuticals plc., Ablis CBD, Canopy Growth Corporation, NewAge Inc., VIVO Cannabis Inc., The Cronos Group, CannTrust, Hexo, Other Key Players
Customization Scope
Customization for segments, region/country-level will be provided. Moreover, additional customization can be done based on the requirements.
Pricing and Purchase Options
Avail customized purchase options to meet your exact research needs. We have three licenses to opt for: Single User License, Multi-User License (Up to 5 Users), Corporate Use License (Unlimited User and Printable PDF).
TABLE OF CONTENTS
1. EXECUTIVE SUMMARY
1.1. MARKET SNAPSHOT
1.2. KEY FINDINGS & INSIGHTS
1.3. ANALYST RECOMMENDATIONS
1.4. FUTURE OUTLOOK
2. RESEARCH METHODOLOGY
2.1. MARKET DEFINITION & SCOPE
2.2. RESEARCH OBJECTIVES: PRIMARY & SECONDARY DATA SOURCES
2.3. DATA COLLECTION SOURCES
2.3.1. COVERAGE OF 100+ PRIMARY RESEARCH/CONSULTATION CALLS WITH INDUSTRY STAKEHOLDERS
FIGURE 17 NORTH AMERICA CBD BEVERAGESCURRENT AND FUTURE TYPE ANALYSIS, 2025–2034, (USD MILLION)
FIGURE 18 NORTH AMERICA CBD BEVERAGESCURRENT AND FUTURE END USER ANALYSIS, 2025–2034, (USD MILLION)
FIGURE 19 MARKET SHARE BY COUNTRY
FIGURE 20 LATIN AMERICA CBD BEVERAGESCURRENT AND FUTURE TYPE ANALYSIS, 2025–2034, (USD MILLION)
FIGURE 21 LATIN AMERICA CBD BEVERAGESCURRENT AND FUTURE END USER ANALYSIS, 2025–2034, (USD MILLION)
FIGURE 22 MARKET SHARE BY COUNTRY
FIGURE 23 EASTERN EUROPE CBD BEVERAGESCURRENT AND FUTURE TYPE ANALYSIS, 2025–2034, (USD MILLION)
FIGURE 24 EASTERN EUROPE CBD BEVERAGESCURRENT AND FUTURE END USER ANALYSIS, 2025–2034, (USD MILLION)
FIGURE 25 MARKET SHARE BY COUNTRY
FIGURE 26 WESTERN EUROPE CBD BEVERAGESCURRENT AND FUTURE TYPE ANALYSIS, 2025–2034, (USD MILLION)
FIGURE 27 WESTERN EUROPE CBD BEVERAGESCURRENT AND FUTURE END USER ANALYSIS, 2025–2034, (USD MILLION)
FIGURE 28 MARKET SHARE BY COUNTRY
FIGURE 29 EAST ASIA AND PACIFIC CBD BEVERAGESCURRENT AND FUTURE TYPE ANALYSIS, 2025–2034, (USD MILLION)
FIGURE 30 EAST ASIA AND PACIFIC CBD BEVERAGESCURRENT AND FUTURE END USER ANALYSIS, 2025–2034, (USD MILLION)
FIGURE 31 MARKET SHARE BY COUNTRY
FIGURE 32 SEA AND SOUTH ASIA CBD BEVERAGESCURRENT AND FUTURE TYPE ANALYSIS, 2025–2034, (USD MILLION)
FIGURE 33 SEA AND SOUTH ASIA CBD BEVERAGESCURRENT AND FUTURE END USER ANALYSIS, 2025–2034, (USD MILLION)
FIGURE 34 MARKET SHARE BY COUNTRY
FIGURE 35 MIDDLE EAST AND AFRICA CBD BEVERAGESCURRENT AND FUTURE TYPE ANALYSIS, 2025–2034, (USD MILLION)
FIGURE 36 MIDDLE EAST AND AFRICA CBD BEVERAGESCURRENT AND FUTURE END USER ANALYSIS, 2025–2034, (USD MILLION)
FIGURE 37 NORTH AMERICA CBD BEVERAGESCURRENT AND FUTURE MARKET VOLUME SHARE REGIONAL ANALYSIS, 2025–2034, (USD MILLION)
FIGURE 38 U.S. CBD BEVERAGESCURRENT AND FUTURE TYPE ANALYSIS, 2025–2034, (USD MILLION)
FIGURE 39 U.S. CBD BEVERAGESCURRENT AND FUTURE END USER ANALYSIS, 2025–2034, (USD MILLION)
FIGURE 40 CANADA CBD BEVERAGESCURRENT AND FUTURE TYPE ANALYSIS, 2025–2034, (USD MILLION)
FIGURE 41 CANADA CBD BEVERAGESCURRENT AND FUTURE END USER ANALYSIS, 2025–2034, (USD MILLION)
FIGURE 42 LATIN AMERICA CBD BEVERAGESCURRENT AND FUTURE MARKET VOLUME SHARE REGIONAL ANALYSIS, 2025–2034, (USD MILLION)
FIGURE 43 MEXICO CBD BEVERAGESCURRENT AND FUTURE TYPE ANALYSIS, 2025–2034, (USD MILLION)
FIGURE 44 MEXICO CBD BEVERAGESCURRENT AND FUTURE END USER ANALYSIS, 2025–2034, (USD MILLION)
FIGURE 45 BRAZIL CBD BEVERAGESCURRENT AND FUTURE TYPE ANALYSIS, 2025–2034, (USD MILLION)
FIGURE 46 BRAZIL CBD BEVERAGESCURRENT AND FUTURE END USER ANALYSIS, 2025–2034, (USD MILLION)
FIGURE 47 ARGENTINA CBD BEVERAGESCURRENT AND FUTURE TYPE ANALYSIS, 2025–2034, (USD MILLION)
FIGURE 48 ARGENTINA CBD BEVERAGESCURRENT AND FUTURE END USER ANALYSIS, 2025–2034, (USD MILLION)
FIGURE 49 COLUMBIA CBD BEVERAGESCURRENT AND FUTURE TYPE ANALYSIS, 2025–2034, (USD MILLION)
FIGURE 50 COLUMBIA CBD BEVERAGESCURRENT AND FUTURE END USER ANALYSIS, 2025–2034, (USD MILLION)
FIGURE 51 REST OF LATIN AMERICA CBD BEVERAGESCURRENT AND FUTURE TYPE ANALYSIS, 2025–2034, (USD MILLION)
FIGURE 52 REST OF LATIN AMERICA CBD BEVERAGESCURRENT AND FUTURE END USER ANALYSIS, 2025–2034, (USD MILLION)
FIGURE 53 EASTERN EUROPE CBD BEVERAGESCURRENT AND FUTURE MARKET VOLUME SHARE REGIONAL ANALYSIS, 2025–2034, (USD MILLION)
FIGURE 54 POLAND CBD BEVERAGESCURRENT AND FUTURE TYPE ANALYSIS, 2025–2034, (USD MILLION)
FIGURE 55 POLAND CBD BEVERAGESCURRENT AND FUTURE END USER ANALYSIS, 2025–2034, (USD MILLION)
FIGURE 56 RUSSIA CBD BEVERAGESCURRENT AND FUTURE TYPE ANALYSIS, 2025–2034, (USD MILLION)
FIGURE 57 RUSSIA CBD BEVERAGESCURRENT AND FUTURE END USER ANALYSIS, 2025–2034, (USD MILLION)
FIGURE 58 CZECH REPUBLIC CBD BEVERAGESCURRENT AND FUTURE TYPE ANALYSIS, 2025–2034, (USD MILLION)
FIGURE 59 CZECH REPUBLIC CBD BEVERAGESCURRENT AND FUTURE END USER ANALYSIS, 2025–2034, (USD MILLION)
FIGURE 60 ROMANIA CBD BEVERAGESCURRENT AND FUTURE TYPE ANALYSIS, 2025–2034, (USD MILLION)
FIGURE 61 ROMANIA CBD BEVERAGESCURRENT AND FUTURE END USER ANALYSIS, 2025–2034, (USD MILLION)
FIGURE 62 REST OF EASTERN EUROPE CBD BEVERAGESCURRENT AND FUTURE TYPE ANALYSIS, 2025–2034, (USD MILLION)
FIGURE 63 REST OF EASTERN EUROPE CBD BEVERAGESCURRENT AND FUTURE END USER ANALYSIS, 2025–2034, (USD MILLION)
FIGURE 64 WESTERN EUROPE CBD BEVERAGESCURRENT AND FUTURE MARKET VOLUME SHARE REGIONAL ANALYSIS, 2025–2034, (USD MILLION)
FIGURE 65 GERMANY CBD BEVERAGESCURRENT AND FUTURE TYPE ANALYSIS, 2025–2034, (USD MILLION)
FIGURE 66 GERMANY CBD BEVERAGESCURRENT AND FUTURE END USER ANALYSIS, 2025–2034, (USD MILLION)
FIGURE 67 FRANCE CBD BEVERAGESCURRENT AND FUTURE TYPE ANALYSIS, 2025–2034, (USD MILLION)
FIGURE 68 FRANCE CBD BEVERAGESCURRENT AND FUTURE END USER ANALYSIS, 2025–2034, (USD MILLION)
FIGURE 69 UK CBD BEVERAGESCURRENT AND FUTURE TYPE ANALYSIS, 2025–2034, (USD MILLION)
FIGURE 70 UK CBD BEVERAGESCURRENT AND FUTURE END USER ANALYSIS, 2025–2034, (USD MILLION)
FIGURE 71 SPAIN CBD BEVERAGESCURRENT AND FUTURE TYPE ANALYSIS, 2025–2034, (USD MILLION)
FIGURE 72 SPAIN CBD BEVERAGESCURRENT AND FUTURE END USER ANALYSIS, 2025–2034, (USD MILLION)
FIGURE 73 ITALY CBD BEVERAGESCURRENT AND FUTURE TYPE ANALYSIS, 2025–2034, (USD MILLION)
FIGURE 74 ITALY CBD BEVERAGESCURRENT AND FUTURE END USER ANALYSIS, 2025–2034, (USD MILLION)
FIGURE 75 REST OF WESTERN EUROPE CBD BEVERAGESCURRENT AND FUTURE TYPE ANALYSIS, 2025–2034, (USD MILLION)
FIGURE 76 REST OF WESTERN EUROPE CBD BEVERAGESCURRENT AND FUTURE END USER ANALYSIS, 2025–2034, (USD MILLION)
FIGURE 77 EAST ASIA AND PACIFIC CBD BEVERAGESCURRENT AND FUTURE MARKET VOLUME SHARE REGIONAL ANALYSIS, 2025–2034, (USD MILLION)
FIGURE 78 CHINA CBD BEVERAGESCURRENT AND FUTURE TYPE ANALYSIS, 2025–2034, (USD MILLION)
FIGURE 79 CHINA CBD BEVERAGESCURRENT AND FUTURE END USER ANALYSIS, 2025–2034, (USD MILLION)
FIGURE 80 JAPAN CBD BEVERAGESCURRENT AND FUTURE TYPE ANALYSIS, 2025–2034, (USD MILLION)
FIGURE 81 JAPAN CBD BEVERAGESCURRENT AND FUTURE END USER ANALYSIS, 2025–2034, (USD MILLION)
FIGURE 82 AUSTRALIA CBD BEVERAGESCURRENT AND FUTURE TYPE ANALYSIS, 2025–2034, (USD MILLION)
FIGURE 83 AUSTRALIA CBD BEVERAGESCURRENT AND FUTURE END USER ANALYSIS, 2025–2034, (USD MILLION)
FIGURE 84 CAMBODIA CBD BEVERAGESCURRENT AND FUTURE TYPE ANALYSIS, 2025–2034, (USD MILLION)
FIGURE 85 CAMBODIA CBD BEVERAGESCURRENT AND FUTURE END USER ANALYSIS, 2025–2034, (USD MILLION)
FIGURE 86 FIJI CBD BEVERAGESCURRENT AND FUTURE TYPE ANALYSIS, 2025–2034, (USD MILLION)
FIGURE 87 FIJI CBD BEVERAGESCURRENT AND FUTURE END USER ANALYSIS, 2025–2034, (USD MILLION)
FIGURE 88 INDONESIA CBD BEVERAGESCURRENT AND FUTURE TYPE ANALYSIS, 2025–2034, (USD MILLION)
FIGURE 89 INDONESIA CBD BEVERAGESCURRENT AND FUTURE END USER ANALYSIS, 2025–2034, (USD MILLION)
FIGURE 90 SOUTH KOREA CBD BEVERAGESCURRENT AND FUTURE TYPE ANALYSIS, 2025–2034, (USD MILLION)
FIGURE 91 SOUTH KOREA CBD BEVERAGESCURRENT AND FUTURE END USER ANALYSIS, 2025–2034, (USD MILLION)
FIGURE 92 REST OF EAST ASIA AND PACIFIC CBD BEVERAGESCURRENT AND FUTURE TYPE ANALYSIS, 2025–2034, (USD MILLION)
FIGURE 93 REST OF EAST ASIA AND PACIFIC CBD BEVERAGESCURRENT AND FUTURE END USER ANALYSIS, 2025–2034, (USD MILLION)
FIGURE 94 SEA AND SOUTH ASIA CBD BEVERAGESCURRENT AND FUTURE MARKET VOLUME SHARE REGIONAL ANALYSIS, 2025–2034, (USD MILLION)
FIGURE 95 BANGLADESH CBD BEVERAGESCURRENT AND FUTURE TYPE ANALYSIS, 2025–2034, (USD MILLION)
FIGURE 96 BANGLADESH CBD BEVERAGESCURRENT AND FUTURE END USER ANALYSIS, 2025–2034, (USD MILLION)
FIGURE 97 NEW ZEALAND CBD BEVERAGESCURRENT AND FUTURE TYPE ANALYSIS, 2025–2034, (USD MILLION)
FIGURE 98 NEW ZEALAND CBD BEVERAGESCURRENT AND FUTURE END USER ANALYSIS, 2025–2034, (USD MILLION)
FIGURE 99 INDIA CBD BEVERAGESCURRENT AND FUTURE TYPE ANALYSIS, 2025–2034, (USD MILLION)
FIGURE 100 INDIA CBD BEVERAGESCURRENT AND FUTURE END USER ANALYSIS, 2025–2034, (USD MILLION)
FIGURE 101 SINGAPORE CBD BEVERAGESCURRENT AND FUTURE TYPE ANALYSIS, 2025–2034, (USD MILLION)
FIGURE 102 SINGAPORE CBD BEVERAGESCURRENT AND FUTURE END USER ANALYSIS, 2025–2034, (USD MILLION)
FIGURE 103 THAILAND CBD BEVERAGESCURRENT AND FUTURE TYPE ANALYSIS, 2025–2034, (USD MILLION)
FIGURE 104 THAILAND CBD BEVERAGESCURRENT AND FUTURE END USER ANALYSIS, 2025–2034, (USD MILLION)
FIGURE 105 TAIWAN CBD BEVERAGESCURRENT AND FUTURE TYPE ANALYSIS, 2025–2034, (USD MILLION)
FIGURE 106 TAIWAN CBD BEVERAGESCURRENT AND FUTURE END USER ANALYSIS, 2025–2034, (USD MILLION)
FIGURE 107 MALAYSIA CBD BEVERAGESCURRENT AND FUTURE TYPE ANALYSIS, 2025–2034, (USD MILLION)
FIGURE 108 MALAYSIA CBD BEVERAGESCURRENT AND FUTURE END USER ANALYSIS, 2025–2034, (USD MILLION)
FIGURE 109 REST OF SEA AND SOUTH ASIA CBD BEVERAGESCURRENT AND FUTURE TYPE ANALYSIS, 2025–2034, (USD MILLION)
FIGURE 110 REST OF SEA AND SOUTH ASIA CBD BEVERAGESCURRENT AND FUTURE END USER ANALYSIS, 2025–2034, (USD MILLION)
FIGURE 111 MIDDLE EAST AND AFRICA CBD BEVERAGESCURRENT AND FUTURE MARKET VOLUME SHARE REGIONAL ANALYSIS, 2025–2034, (USD MILLION)
FIGURE 112 GCC COUNTRIES CBD BEVERAGESCURRENT AND FUTURE TYPE ANALYSIS, 2025–2034, (USD MILLION)
FIGURE 113 GCC COUNTRIES CBD BEVERAGESCURRENT AND FUTURE END USER ANALYSIS, 2025–2034, (USD MILLION)
FIGURE 114 SAUDI ARABIA CBD BEVERAGESCURRENT AND FUTURE TYPE ANALYSIS, 2025–2034, (USD MILLION)
FIGURE 115 SAUDI ARABIA CBD BEVERAGESCURRENT AND FUTURE END USER ANALYSIS, 2025–2034, (USD MILLION)
FIGURE 116 UAE CBD BEVERAGESCURRENT AND FUTURE TYPE ANALYSIS, 2025–2034, (USD MILLION)
FIGURE 117 UAE CBD BEVERAGESCURRENT AND FUTURE END USER ANALYSIS, 2025–2034, (USD MILLION)
FIGURE 118 BAHRAIN CBD BEVERAGESCURRENT AND FUTURE TYPE ANALYSIS, 2025–2034, (USD MILLION)
FIGURE 119 BAHRAIN CBD BEVERAGESCURRENT AND FUTURE END USER ANALYSIS, 2025–2034, (USD MILLION)
FIGURE 120 KUWAIT CBD BEVERAGESCURRENT AND FUTURE TYPE ANALYSIS, 2025–2034, (USD MILLION)
FIGURE 121 KUWAIT CBD BEVERAGESCURRENT AND FUTURE END USER ANALYSIS, 2025–2034, (USD MILLION)
FIGURE 122 OMAN CBD BEVERAGESCURRENT AND FUTURE TYPE ANALYSIS, 2025–2034, (USD MILLION)
FIGURE 123 OMAN CBD BEVERAGESCURRENT AND FUTURE END USER ANALYSIS, 2025–2034, (USD MILLION)
FIGURE 124 QATAR CBD BEVERAGESCURRENT AND FUTURE TYPE ANALYSIS, 2025–2034, (USD MILLION)
FIGURE 125 QATAR CBD BEVERAGESCURRENT AND FUTURE END USER ANALYSIS, 2025–2034, (USD MILLION)
FIGURE 126 EGYPT CBD BEVERAGESCURRENT AND FUTURE TYPE ANALYSIS, 2025–2034, (USD MILLION)
FIGURE 127 EGYPT CBD BEVERAGESCURRENT AND FUTURE END USER ANALYSIS, 2025–2034, (USD MILLION)
FIGURE 128 NIGERIA CBD BEVERAGESCURRENT AND FUTURE TYPE ANALYSIS, 2025–2034, (USD MILLION)
FIGURE 129 NIGERIA CBD BEVERAGESCURRENT AND FUTURE END USER ANALYSIS, 2025–2034, (USD MILLION)
FIGURE 130 SOUTH AFRICA CBD BEVERAGESCURRENT AND FUTURE TYPE ANALYSIS, 2025–2034, (USD MILLION)
FIGURE 131 SOUTH AFRICA CBD BEVERAGESCURRENT AND FUTURE END USER ANALYSIS, 2025–2034, (USD MILLION)
FIGURE 132 ISRAEL CBD BEVERAGESCURRENT AND FUTURE TYPE ANALYSIS, 2025–2034, (USD MILLION)
FIGURE 133 ISRAEL CBD BEVERAGESCURRENT AND FUTURE END USER ANALYSIS, 2025–2034, (USD MILLION)
FIGURE 134 REST OF MEA CBD BEVERAGESCURRENT AND FUTURE TYPE ANALYSIS, 2025–2034, (USD MILLION)
FIGURE 135 REST OF MEA CBD BEVERAGESCURRENT AND FUTURE END USER ANALYSIS, 2025–2034, (USD MILLION)
FIGURE 136 U. S. MARKET SHARE ANALYSIS BY TYPE (2024)
FIGURE 137 U. S. MARKET SHARE ANALYSIS BY END USER (2024)
FIGURE 138 CANADA MARKET SHARE ANALYSIS BY TYPE (2024)
FIGURE 139 CANADA MARKET SHARE ANALYSIS BY END USER (2024)
FIGURE 140 MEXICO MARKET SHARE ANALYSIS BY TYPE (2024)
FIGURE 141 MEXICO MARKET SHARE ANALYSIS BY END USER (2024)
FIGURE 142 CHINA MARKET SHARE ANALYSIS BY TYPE (2024)
FIGURE 143 CHINA MARKET SHARE ANALYSIS BY END USER (2024)
FIGURE 144 JAPAN MARKET SHARE ANALYSIS BY TYPE (2024)
FIGURE 145 JAPAN MARKET SHARE ANALYSIS BY END USER (2024)
FIGURE 146 INDIA MARKET SHARE ANALYSIS BY TYPE (2024)
FIGURE 147 INDIA MARKET SHARE ANALYSIS BY END USER (2024)
FIGURE 148 SOUTH KOREA MARKET SHARE ANALYSIS BY TYPE (2024)
FIGURE 149 SOUTH KOREA MARKET SHARE ANALYSIS BY END USER (2024)
FIGURE 150 SAUDI ARABIA MARKET SHARE ANALYSIS BY TYPE (2024)
FIGURE 151 SAUDI ARABIA MARKET SHARE ANALYSIS BY END USER (2024)
FIGURE 152 UAE MARKET SHARE ANALYSIS BY TYPE (2024)
FIGURE 153 UAE MARKET SHARE ANALYSIS BY END USER (2024)
FIGURE 154 EGYPT MARKET SHARE ANALYSIS BY TYPE (2024)
FIGURE 155 EGYPT MARKET SHARE ANALYSIS BY END USER (2024)
FIGURE 156 NIGERIA MARKET SHARE ANALYSIS BY TYPE (2024)
FIGURE 157 NIGERIA MARKET SHARE ANALYSIS BY END USER (2024)
FIGURE 158 SOUTH AFRICA MARKET SHARE ANALYSIS BY TYPE (2024)
FIGURE 159 SOUTH AFRICA MARKET SHARE ANALYSIS BY END USER (2024)
FIGURE 160 GERMANY MARKET SHARE ANALYSIS BY TYPE (2024)
FIGURE 161 GERMANY MARKET SHARE ANALYSIS BY END USER (2024)
FIGURE 162 FRANCE MARKET SHARE ANALYSIS BY TYPE (2024)
FIGURE 163 FRANCE MARKET SHARE ANALYSIS BY END USER (2024)
FIGURE 164 UK MARKET SHARE ANALYSIS BY TYPE (2024)
FIGURE 165 UK MARKET SHARE ANALYSIS BY END USER (2024)
FIGURE 166 SPAIN MARKET SHARE ANALYSIS BY TYPE (2024)
FIGURE 167 SPAIN MARKET SHARE ANALYSIS BY END USER (2024)
FIGURE 168 ITALY MARKET SHARE ANALYSIS BY TYPE (2024)
FIGURE 169 ITALY MARKET SHARE ANALYSIS BY END USER (2024)
FIGURE 170 BRAZIL MARKET SHARE ANALYSIS BY TYPE (2024)
FIGURE 171 BRAZIL MARKET SHARE ANALYSIS BY END USER (2024)
FIGURE 172 ARGENTINA MARKET SHARE ANALYSIS BY TYPE (2024)
FIGURE 173 ARGENTINA MARKET SHARE ANALYSIS BY END USER (2024)
FIGURE 174 COLUMBIA MARKET SHARE ANALYSIS BY TYPE (2024)
FIGURE 175 COLUMBIA MARKET SHARE ANALYSIS BY END USER (2024)
FIGURE 176 GLOBAL CBD BEVERAGESCURRENT AND FUTURE MARKET KEY COUNTRY LEVEL ANALYSIS, 2024–2034, (USD MILLION)
FIGURE 177 FINANCIAL OVERVIEW:
Key Player Analysis
The Cronos Group: The Cronos Group positions itself as a challenger with a strong science-led approach in the CBD beverages market. The company focuses on hemp-derived cannabinoids and ingredient-grade CBD inputs that support beverage formulation at scale. Its portfolio emphasizes consistency, safety, and regulatory alignment, which resonates with beverage partners targeting mainstream wellness consumers. In 2025, Cronos continues to prioritize the United States and Canada, where regulated CBD beverages show double-digit annual growth.
Strategically, the company invests heavily in R&D and biosynthesis capabilities to ensure repeatable cannabinoid profiles and cost control. Cronos allocates an estimated 12% to 14% of annual operating spend toward research and product development. This focus supports beverage manufacturers seeking stable supply and predictable dosing. The company differentiates through pharmaceutical-style quality standards and long-term supply agreements rather than branded retail beverages.
Hexo: Hexo operates as a market challenger with a consumer-facing orientation in cannabis-infused and CBD-aligned beverages. The company holds a visible presence in Canada, where cannabis beverages represent one of the fastest-growing subcategories, expanding at an estimated CAGR of over 20% through 2030. Hexo’s beverage strategy centers on flavor-forward, low-calorie formulations that appeal to younger adult consumers shifting away from alcohol.
In 2025, Hexo continues to rationalize its portfolio and focus on margin improvement. Strategic partnerships with beverage bottlers and distribution specialists allow broader retail penetration without heavy capital deployment. The company differentiates through brand recognition, pricing accessibility, and experience in regulated cannabis drinks. This background supports faster product rollout as CBD beverage regulations mature in additional markets.
CannTrust: CannTrust functions as a niche player with emphasis on medical-grade cannabis and CBD applications. Its positioning in the CBD beverages market remains selective, targeting pharmacy-linked and wellness-focused distribution rather than mass retail. In 2025, CannTrust’s beverage-related revenue remains a small share of total sales but benefits from higher average selling prices due to pharmaceutical-grade inputs.
The company’s strategy prioritizes compliance, traceability, and clinical credibility. CannTrust invests in controlled cultivation and processing systems to maintain consistent cannabinoid profiles. This approach appeals to partners focused on therapeutic positioning and regulated health channels. Differentiation stems from medical market experience, strict quality protocols, and strong alignment with healthcare-adjacent distribution networks.
As of 2025, wider legalization of cannabis for medical and adult-use consumption continues to expand the addressable market for CBD beverages. You are seeing demand rise as more than 60 countries permit some form of medical cannabis use, while over 20 allow regulated recreational access. Consumer awareness of CBD benefits related to stress control, inflammation management, and pain relief has moved from niche to mainstream. This shift supports a global CBD beverages CAGR of about 23% through the early 2030s, with wellness-positioned drinks accounting for over 45% of category revenue in 2025.
Health-driven substitution further accelerates growth. You are witnessing consumers move away from smoked cannabis due to respiratory concerns and toward ingestible formats such as beverages. Rising incidence of neurological and mental health conditions also supports demand, particularly for non-psychoactive CBD products that avoid impairment risks. Willingness to pay remains strong. Average spending per CBD beverage consumer increased by an estimated 18% between 2023 and 2025, reinforcing revenue expansion across both retail and on-premise channels.
Regulatory complexity remains the most material constraint on market execution. You must navigate fragmented rules governing CBD dosage limits, THC thresholds, labeling standards, and licensing. These requirements vary sharply across countries and even between U.S. states. In 2025, compliance costs represent an estimated 12% to 15% of operating expenses for multi-market CBD beverage brands, directly pressuring margins.
Unclear frameworks also affect consumer confidence. Inconsistent quality standards result in uneven product potency and formulation outcomes, which can slow repeat purchases. For you as an operator or investor, regulatory uncertainty increases time-to-market and raises the risk of product recalls or reformulation. This environment favors larger firms with legal resources while limiting scalability for smaller entrants.
Opportunity:
Integration with the Functional Beverages Category
The strongest opportunity lies in aligning CBD beverages with the broader functional drinks category, which exceeds USD 160 billion in global value in 2025. You can capture incremental demand by positioning CBD beverages alongside stress-relief, sleep-support, and mood-focused products. Education-led marketing plays a critical role. Brands that invest in consumer education report conversion rates up to 30% higher than those relying solely on lifestyle branding.
Innovation in Bioavailability and Strategic Distribution
Product innovation also opens growth paths. Advances in water-soluble CBD and improved bioavailability allow consistent dosing and better taste profiles. Strategic partnerships with pharmacies, wellness chains, and hospitality operators expand distribution reach. These factors support sustained double-digit growth and improve long-term category credibility.
Trend:
Positioning as a Natural Alternative to OTC Pain Relief
CBD beverages increasingly position themselves as alternatives to over-the-counter painkillers. You are seeing consumers seek options that avoid gastrointestinal and dependency risks associated with common analgesics. Surveys in 2025 indicate that nearly 28% of CBD beverage users consume these products for mild pain or anxiety management.
Research momentum reinforces this shift. Ongoing clinical studies examining CBD’s effects on anxiety modulation and neural health continue to influence consumer perception. As research-backed formulations enter the market, beverage makers gain access to medically adjacent use cases. This trend strengthens demand durability and supports premium pricing across the category.
Recent Developments
Dec 2024 – Canopy Growth Corporation: The company expanded its CBD beverage portfolio in North America with a new line of hemp-derived sparkling drinks, supported by an estimated USD 40 million production scale-up and distribution coverage across more than 18,000 retail outlets. This move strengthens Canopy Growth’s position in regulated wellness beverages and improves shelf visibility in high-volume retail channels.
Feb 2025 – The Cronos Group: Cronos announced a long-term supply partnership with a U.S.-based beverage co-packer to provide biosynthesized CBD ingredients for functional drinks, valued at over USD 25 million over five years. The agreement reinforces Cronos’ role as a formulation-focused supplier and supports predictable dosing for large beverage brands.
Apr 2025 – Hexo: Hexo launched a reformulated range of low-calorie CBD mocktails in Canada and select U.S. states, targeting alcohol replacement use cases and aiming for 20% year-on-year volume growth. The launch improves portfolio alignment with sober-curious consumption trends and supports higher-margin ready-to-drink formats.
Jul 2025 – Alkaline88: Alkaline88 expanded its CBD-infused water distribution into Western Europe through regional beverage distributors, with initial rollout expected to reach nearly 12% of specialty wellness retailers in the region. This expansion broadens geographic exposure and reduces reliance on North American sales.
Sep 2025 – NewAge Inc.: NewAge entered a joint marketing collaboration with hospitality chains to pilot CBD mocktails across hotels and lounges in Asia Pacific, targeting pilot revenues of approximately USD 10 million in the first year. The initiative positions the company to capture early on-premise demand in emerging regulated markets.