Cerebral and Tissue Oximetry Devices Market 2024–2034 | 7.9% CAGR
Global Cerebral and Tissue Oximetry Devices Market Size, Share & Analysis By Type (Handheld, Tabletop), By End-Use (Hospitals, Clinics, Others) Industry Outlook, Clinical Accuracy Trends & Forecast 2025–2034
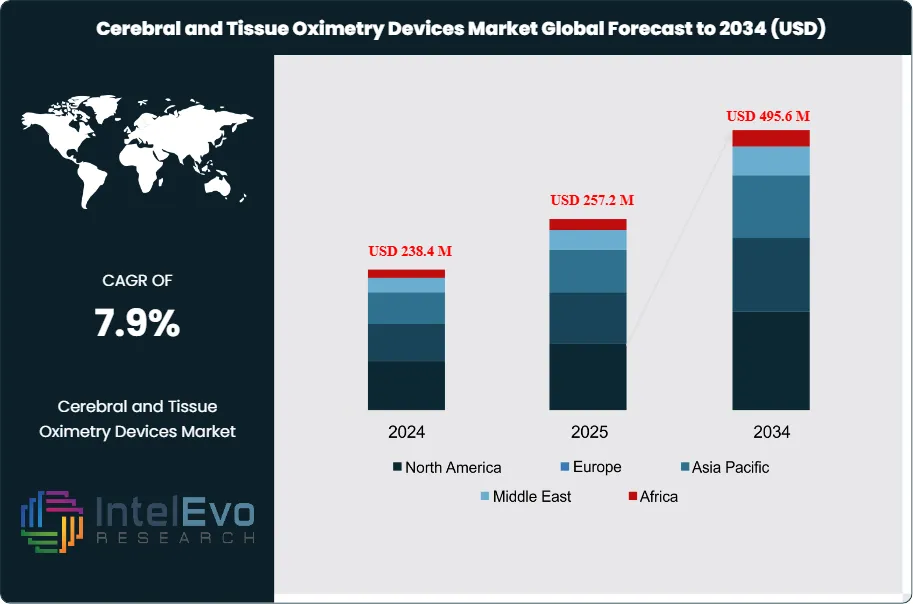
The Cerebral and Tissue Oximetry Devices Market is estimated at USD 238.4 million in 2024 and is projected to reach approximately USD 495.6 million by 2034, reflecting a strong CAGR of about 7.9% during 2025–2034. This growth outlook is supported by rising adoption of non-invasive monitoring technologies, expanding usage in cardiac and neurocritical care, and increasing preference for real-time cerebral oxygenation assessment. As hospitals modernize surgical infrastructure, demand for advanced oximetry solutions continues to accelerate, positioning the segment among the fastest-growing perioperative monitoring markets this decade.
This market is expanding as healthcare systems increasingly prioritize real-time, non-invasive monitoring tools to manage critical care. The use of cerebral and tissue oximetry devices—particularly those using near-infrared spectroscopy (NIRS)—has grown in surgical environments, intensive care units, and neonatal settings. These devices allow clinicians to track oxygen saturation in the brain and other organs with high accuracy, directly impacting outcomes in high-risk procedures and early-stage infant care.
Between 2018 and 2023, the market showed steady uptake, driven by rising global healthcare expenditure, technological improvements in sensor accuracy, and the growing prevalence of chronic diseases among aging populations. Demand has notably increased in neonatal intensive care, where accurate oxygenation monitoring can significantly reduce complications in premature infants. The broadening scope of application across other organs—such as liver and muscle tissue—has also helped diversify use cases beyond traditional neuromonitoring.
On the supply side, competition is intensifying. A mix of established manufacturers and new entrants are investing in multi-parameter oximetry systems, real-time analytics integration, and form-factor improvements. Regulatory frameworks in North America and Europe support the clinical adoption of these devices, while reimbursement policies remain a key factor in influencing purchasing decisions in hospital networks. However, pricing pressures and approval hurdles in emerging markets may slow penetration rates in some regions.
Technological progress continues to shape the market. Enhanced miniaturization, AI-powered data interpretation, and wireless monitoring capabilities are streamlining workflows and improving diagnostic speed. These advances are especially relevant in surgical and post-operative care, where time-sensitive data is critical.
North America remains the largest regional market, supported by high per capita healthcare spending and strong institutional adoption. Europe follows closely, while Asia Pacific shows the fastest projected growth. Countries such as China, India, and South Korea are increasing investments in hospital infrastructure and neonatal care equipment, making them strategic targets for global suppliers. Investors should closely monitor regional procurement trends and shifts in clinical practice guidelines to identify growth opportunities.
Key Takeaways
Market Growth: The global cerebral and tissue oximetry devices market reached USD 238.4 million in 2024 and is projected to hit USD 495.6 million by 2034, registering a CAGR of 7.9%. Growth is driven by increased surgical procedures, rising neonatal care demand, and improved monitoring capabilities in critical care.
Product Type: Tabletop devices accounted for 56.5% of global revenue in 2023 due to their robust clinical performance, integration with hospital systems, and suitability for continuous patient monitoring in high-acuity settings.
End Use: Hospitals held a leading 52.1% market share in 2023. This dominance reflects their role as primary centers for surgeries, intensive care, and neonatal units where oximetry devices are routinely used.
Driver: The rising number of surgeries worldwide is accelerating device demand. Inpatient and outpatient surgical volumes are pushing hospitals to invest in real-time cerebral and tissue oxygenation monitoring to reduce complications.
Restraint: High acquisition costs and reimbursement gaps remain major barriers, particularly for small- and mid-sized facilities. Additionally, performance variability in certain clinical conditions affects physician confidence.
Opportunity: The neonatal care segment presents strong upside potential, especially in emerging economies. Expanding NICU infrastructure and greater focus on preterm infant survival are expected to drive adoption.
Trend: Wireless connectivity, miniaturized sensors, and AI-enabled data analytics are reshaping device design and usability. Manufacturers are increasingly integrating advanced features to support remote and continuous monitoring.
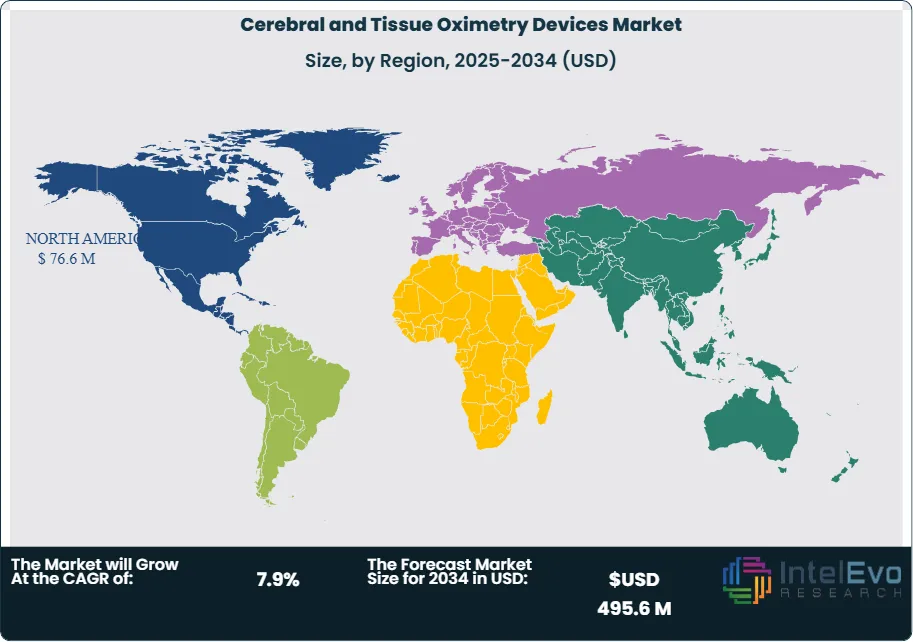
Regional Analysis: North America led the market in 2023, generating USD 76.6 million and capturing 36.5% of total revenue. Asia Pacific is projected to post the fastest CAGR through 2033, driven by expanding healthcare infrastructure and rising investment in critical care and neonatal services.
Type Analysis
As of 2025, tabletop cerebral and tissue oximetry devices continue to lead the market, accounting for over 56% of global revenue. These systems are widely adopted in hospital environments due to their stable performance, intuitive interfaces, and compatibility with other clinical monitoring tools. Their fixed setup allows for continuous, real-time tracking of cerebral and tissue oxygen saturation during surgeries and in intensive care units. The growing emphasis on intraoperative monitoring and early detection of hypoxia has further strengthened demand for tabletop units.
Despite their smaller footprint in the market, handheld oximetry devices remain essential in settings where mobility and speed are critical. These portable units are particularly useful in emergency care, outpatient procedures, and in-home health assessments. While they lack some advanced functionalities of tabletop systems, their flexibility makes them an attractive option for clinicians operating in space-constrained or fast-paced environments. However, growth in this segment is slower, as hospitals increasingly favor stationary solutions for long-term monitoring and integration into digital health infrastructure.
End-Use Analysis
Hospitals represent the largest end-use segment for cerebral and tissue oximetry devices, holding over 52% of the global market in 2025. These institutions rely on real-time monitoring systems to support surgical decision-making, manage critically ill patients, and monitor neonatal oxygenation levels. The demand is particularly strong in neurosurgery, cardiovascular operations, and intensive care, where oxygen desaturation poses significant clinical risk. Hospitals also benefit from purchasing power and streamlined procurement channels, enabling large-scale adoption.
Clinics and other healthcare settings, including ambulatory surgical centers and specialized diagnostic facilities, are showing increasing interest in these devices. Although they currently hold a smaller share, their growth trajectory is positive. Rising demand for minimally invasive procedures and enhanced patient monitoring outside of tertiary care settings supports this expansion. As device prices become more competitive and user training improves, smaller healthcare providers are expected to adopt cerebral and tissue oximetry technologies more broadly.
Regional Analysis
North America continues to dominate the global market in 2025, with an estimated 36.5% share and revenues exceeding USD 80 million. This leadership is supported by strong healthcare infrastructure, high surgical volumes, and favorable reimbursement frameworks for advanced monitoring equipment. The region’s early adoption of cerebral oximetry, particularly in cardiac and neonatal care, has established a mature market landscape with consistent demand across public and private sectors.
Europe follows closely, driven by national health systems investing in patient safety and perioperative care. Countries like Germany, France, and the UK are integrating cerebral oximetry into clinical guidelines, particularly for pediatric and elderly care. Meanwhile, Asia Pacific is emerging as the fastest-growing region, with annual growth exceeding 8%. Expanding hospital infrastructure in India, China, and Southeast Asia, coupled with government-led healthcare initiatives, is increasing access to advanced monitoring tools. Latin America and the Middle East & Africa are in earlier stages of adoption but are expected to see steady growth as healthcare modernization efforts continue and surgical volumes rise.
By Type (Handheld, Tabletop), By End-Use (Hospitals, Clinics, Others)
Research Methodology
Primary Research- 100 Interviews of Stakeholders
Secondary Research
Desk Research
Regional scope
North America (United States, Canada, Mexico)
Latin America (Brazil, Argentina, Columbia)
East Asia And Pacific (China, Japan, South Korea, Australia, Cambodia, Fiji, Indonesia)
Sea And South Asia (India, Singapore, Thailand, Taiwan, Malaysia)
Eastern Europe (Poland, Russia, Czech Republic, Romania)
Western Europe (Germany, U.K., France, Spain, Itlay)
Middle East & Africa (GCC Countries, Egypt, Nigeria, South Africa, Israel)
Competitive Landscape
Masimo Corp., Moor Instruments Ltd., Spectros Medical Devices Inc., Nonin Medical Inc., ISS Inc., HyperMed Imaging Inc., Medtronic Plc, Artinis Medical Systems, Hamamatsu Photonics KK, Edwards Lifesciences Corp., Sotera Health Co.
Customization Scope
Customization for segments, region/country-level will be provided. Moreover, additional customization can be done based on the requirements.
Pricing and Purchase Options
Avail customized purchase options to meet your exact research needs. We have three licenses to opt for: Single User License, Multi-User License (Up to 5 Users), Corporate Use License (Unlimited User and Printable PDF).
TABLE OF CONTENTS
1. EXECUTIVE SUMMARY
1.1. MARKET SNAPSHOT
1.2. KEY FINDINGS & INSIGHTS
1.3. ANALYST RECOMMENDATIONS
1.4. FUTURE OUTLOOK
2. RESEARCH METHODOLOGY
2.1. MARKET DEFINITION & SCOPE
2.2. RESEARCH OBJECTIVES: PRIMARY & SECONDARY DATA SOURCES
2.3. DATA COLLECTION SOURCES
2.3.1. COVERAGE OF 100+ PRIMARY RESEARCH/CONSULTATION CALLS WITH INDUSTRY STAKEHOLDERS
FIGURE 17 NORTH AMERICA CEREBRAL AND TISSUE OXIMETRY DEVICES CURRENT AND FUTURE TYPE ANALYSIS, 2025–2034, (USD MILLION)
FIGURE 18 NORTH AMERICA CEREBRAL AND TISSUE OXIMETRY DEVICES CURRENT AND FUTURE END USER ANALYSIS, 2025–2034, (USD MILLION)
FIGURE 19 MARKET SHARE BY COUNTRY
FIGURE 20 LATIN AMERICA CEREBRAL AND TISSUE OXIMETRY DEVICES CURRENT AND FUTURE TYPE ANALYSIS, 2025–2034, (USD MILLION)
FIGURE 21 LATIN AMERICA CEREBRAL AND TISSUE OXIMETRY DEVICES CURRENT AND FUTURE END USER ANALYSIS, 2025–2034, (USD MILLION)
FIGURE 22 MARKET SHARE BY COUNTRY
FIGURE 23 EASTERN EUROPE CEREBRAL AND TISSUE OXIMETRY DEVICES CURRENT AND FUTURE TYPE ANALYSIS, 2025–2034, (USD MILLION)
FIGURE 24 EASTERN EUROPE CEREBRAL AND TISSUE OXIMETRY DEVICES CURRENT AND FUTURE END USER ANALYSIS, 2025–2034, (USD MILLION)
FIGURE 25 MARKET SHARE BY COUNTRY
FIGURE 26 WESTERN EUROPE CEREBRAL AND TISSUE OXIMETRY DEVICES CURRENT AND FUTURE TYPE ANALYSIS, 2025–2034, (USD MILLION)
FIGURE 27 WESTERN EUROPE CEREBRAL AND TISSUE OXIMETRY DEVICES CURRENT AND FUTURE END USER ANALYSIS, 2025–2034, (USD MILLION)
FIGURE 28 MARKET SHARE BY COUNTRY
FIGURE 29 EAST ASIA AND PACIFIC CEREBRAL AND TISSUE OXIMETRY DEVICES CURRENT AND FUTURE TYPE ANALYSIS, 2025–2034, (USD MILLION)
FIGURE 30 EAST ASIA AND PACIFIC CEREBRAL AND TISSUE OXIMETRY DEVICES CURRENT AND FUTURE END USER ANALYSIS, 2025–2034, (USD MILLION)
FIGURE 31 MARKET SHARE BY COUNTRY
FIGURE 32 SEA AND SOUTH ASIA CEREBRAL AND TISSUE OXIMETRY DEVICES CURRENT AND FUTURE TYPE ANALYSIS, 2025–2034, (USD MILLION)
FIGURE 33 SEA AND SOUTH ASIA CEREBRAL AND TISSUE OXIMETRY DEVICES CURRENT AND FUTURE END USER ANALYSIS, 2025–2034, (USD MILLION)
FIGURE 34 MARKET SHARE BY COUNTRY
FIGURE 35 MIDDLE EAST AND AFRICA CEREBRAL AND TISSUE OXIMETRY DEVICES CURRENT AND FUTURE TYPE ANALYSIS, 2025–2034, (USD MILLION)
FIGURE 36 MIDDLE EAST AND AFRICA CEREBRAL AND TISSUE OXIMETRY DEVICES CURRENT AND FUTURE END USER ANALYSIS, 2025–2034, (USD MILLION)
FIGURE 37 NORTH AMERICA CEREBRAL AND TISSUE OXIMETRY DEVICES CURRENT AND FUTURE MARKET VOLUME SHARE REGIONAL ANALYSIS, 2025–2034, (USD MILLION)
FIGURE 38 U.S. CEREBRAL AND TISSUE OXIMETRY DEVICES CURRENT AND FUTURE TYPE ANALYSIS, 2025–2034, (USD MILLION)
FIGURE 39 U.S. CEREBRAL AND TISSUE OXIMETRY DEVICES CURRENT AND FUTURE END USER ANALYSIS, 2025–2034, (USD MILLION)
FIGURE 40 CANADA CEREBRAL AND TISSUE OXIMETRY DEVICES CURRENT AND FUTURE TYPE ANALYSIS, 2025–2034, (USD MILLION)
FIGURE 41 CANADA CEREBRAL AND TISSUE OXIMETRY DEVICES CURRENT AND FUTURE END USER ANALYSIS, 2025–2034, (USD MILLION)
FIGURE 42 LATIN AMERICA CEREBRAL AND TISSUE OXIMETRY DEVICES CURRENT AND FUTURE MARKET VOLUME SHARE REGIONAL ANALYSIS, 2025–2034, (USD MILLION)
FIGURE 43 MEXICO CEREBRAL AND TISSUE OXIMETRY DEVICES CURRENT AND FUTURE TYPE ANALYSIS, 2025–2034, (USD MILLION)
FIGURE 44 MEXICO CEREBRAL AND TISSUE OXIMETRY DEVICES CURRENT AND FUTURE END USER ANALYSIS, 2025–2034, (USD MILLION)
FIGURE 45 BRAZIL CEREBRAL AND TISSUE OXIMETRY DEVICES CURRENT AND FUTURE TYPE ANALYSIS, 2025–2034, (USD MILLION)
FIGURE 46 BRAZIL CEREBRAL AND TISSUE OXIMETRY DEVICES CURRENT AND FUTURE END USER ANALYSIS, 2025–2034, (USD MILLION)
FIGURE 47 ARGENTINA CEREBRAL AND TISSUE OXIMETRY DEVICES CURRENT AND FUTURE TYPE ANALYSIS, 2025–2034, (USD MILLION)
FIGURE 48 ARGENTINA CEREBRAL AND TISSUE OXIMETRY DEVICES CURRENT AND FUTURE END USER ANALYSIS, 2025–2034, (USD MILLION)
FIGURE 49 COLUMBIA CEREBRAL AND TISSUE OXIMETRY DEVICES CURRENT AND FUTURE TYPE ANALYSIS, 2025–2034, (USD MILLION)
FIGURE 50 COLUMBIA CEREBRAL AND TISSUE OXIMETRY DEVICES CURRENT AND FUTURE END USER ANALYSIS, 2025–2034, (USD MILLION)
FIGURE 51 REST OF LATIN AMERICA CEREBRAL AND TISSUE OXIMETRY DEVICES CURRENT AND FUTURE TYPE ANALYSIS, 2025–2034, (USD MILLION)
FIGURE 52 REST OF LATIN AMERICA CEREBRAL AND TISSUE OXIMETRY DEVICES CURRENT AND FUTURE END USER ANALYSIS, 2025–2034, (USD MILLION)
FIGURE 53 EASTERN EUROPE CEREBRAL AND TISSUE OXIMETRY DEVICES CURRENT AND FUTURE MARKET VOLUME SHARE REGIONAL ANALYSIS, 2025–2034, (USD MILLION)
FIGURE 54 POLAND CEREBRAL AND TISSUE OXIMETRY DEVICES CURRENT AND FUTURE TYPE ANALYSIS, 2025–2034, (USD MILLION)
FIGURE 55 POLAND CEREBRAL AND TISSUE OXIMETRY DEVICES CURRENT AND FUTURE END USER ANALYSIS, 2025–2034, (USD MILLION)
FIGURE 56 RUSSIA CEREBRAL AND TISSUE OXIMETRY DEVICES CURRENT AND FUTURE TYPE ANALYSIS, 2025–2034, (USD MILLION)
FIGURE 57 RUSSIA CEREBRAL AND TISSUE OXIMETRY DEVICES CURRENT AND FUTURE END USER ANALYSIS, 2025–2034, (USD MILLION)
FIGURE 58 CZECH REPUBLIC CEREBRAL AND TISSUE OXIMETRY DEVICES CURRENT AND FUTURE TYPE ANALYSIS, 2025–2034, (USD MILLION)
FIGURE 59 CZECH REPUBLIC CEREBRAL AND TISSUE OXIMETRY DEVICES CURRENT AND FUTURE END USER ANALYSIS, 2025–2034, (USD MILLION)
FIGURE 60 ROMANIA CEREBRAL AND TISSUE OXIMETRY DEVICES CURRENT AND FUTURE TYPE ANALYSIS, 2025–2034, (USD MILLION)
FIGURE 61 ROMANIA CEREBRAL AND TISSUE OXIMETRY DEVICES CURRENT AND FUTURE END USER ANALYSIS, 2025–2034, (USD MILLION)
FIGURE 62 REST OF EASTERN EUROPE CEREBRAL AND TISSUE OXIMETRY DEVICES CURRENT AND FUTURE TYPE ANALYSIS, 2025–2034, (USD MILLION)
FIGURE 63 REST OF EASTERN EUROPE CEREBRAL AND TISSUE OXIMETRY DEVICES CURRENT AND FUTURE END USER ANALYSIS, 2025–2034, (USD MILLION)
FIGURE 64 WESTERN EUROPE CEREBRAL AND TISSUE OXIMETRY DEVICES CURRENT AND FUTURE MARKET VOLUME SHARE REGIONAL ANALYSIS, 2025–2034, (USD MILLION)
FIGURE 65 GERMANY CEREBRAL AND TISSUE OXIMETRY DEVICES CURRENT AND FUTURE TYPE ANALYSIS, 2025–2034, (USD MILLION)
FIGURE 66 GERMANY CEREBRAL AND TISSUE OXIMETRY DEVICES CURRENT AND FUTURE END USER ANALYSIS, 2025–2034, (USD MILLION)
FIGURE 67 FRANCE CEREBRAL AND TISSUE OXIMETRY DEVICES CURRENT AND FUTURE TYPE ANALYSIS, 2025–2034, (USD MILLION)
FIGURE 68 FRANCE CEREBRAL AND TISSUE OXIMETRY DEVICES CURRENT AND FUTURE END USER ANALYSIS, 2025–2034, (USD MILLION)
FIGURE 69 UK CEREBRAL AND TISSUE OXIMETRY DEVICES CURRENT AND FUTURE TYPE ANALYSIS, 2025–2034, (USD MILLION)
FIGURE 70 UK CEREBRAL AND TISSUE OXIMETRY DEVICES CURRENT AND FUTURE END USER ANALYSIS, 2025–2034, (USD MILLION)
FIGURE 71 SPAIN CEREBRAL AND TISSUE OXIMETRY DEVICES CURRENT AND FUTURE TYPE ANALYSIS, 2025–2034, (USD MILLION)
FIGURE 72 SPAIN CEREBRAL AND TISSUE OXIMETRY DEVICES CURRENT AND FUTURE END USER ANALYSIS, 2025–2034, (USD MILLION)
FIGURE 73 ITALY CEREBRAL AND TISSUE OXIMETRY DEVICES CURRENT AND FUTURE TYPE ANALYSIS, 2025–2034, (USD MILLION)
FIGURE 74 ITALY CEREBRAL AND TISSUE OXIMETRY DEVICES CURRENT AND FUTURE END USER ANALYSIS, 2025–2034, (USD MILLION)
FIGURE 75 REST OF WESTERN EUROPE CEREBRAL AND TISSUE OXIMETRY DEVICES CURRENT AND FUTURE TYPE ANALYSIS, 2025–2034, (USD MILLION)
FIGURE 76 REST OF WESTERN EUROPE CEREBRAL AND TISSUE OXIMETRY DEVICES CURRENT AND FUTURE END USER ANALYSIS, 2025–2034, (USD MILLION)
FIGURE 77 EAST ASIA AND PACIFIC CEREBRAL AND TISSUE OXIMETRY DEVICES CURRENT AND FUTURE MARKET VOLUME SHARE REGIONAL ANALYSIS, 2025–2034, (USD MILLION)
FIGURE 78 CHINA CEREBRAL AND TISSUE OXIMETRY DEVICES CURRENT AND FUTURE TYPE ANALYSIS, 2025–2034, (USD MILLION)
FIGURE 79 CHINA CEREBRAL AND TISSUE OXIMETRY DEVICES CURRENT AND FUTURE END USER ANALYSIS, 2025–2034, (USD MILLION)
FIGURE 80 JAPAN CEREBRAL AND TISSUE OXIMETRY DEVICES CURRENT AND FUTURE TYPE ANALYSIS, 2025–2034, (USD MILLION)
FIGURE 81 JAPAN CEREBRAL AND TISSUE OXIMETRY DEVICES CURRENT AND FUTURE END USER ANALYSIS, 2025–2034, (USD MILLION)
FIGURE 82 AUSTRALIA CEREBRAL AND TISSUE OXIMETRY DEVICES CURRENT AND FUTURE TYPE ANALYSIS, 2025–2034, (USD MILLION)
FIGURE 83 AUSTRALIA CEREBRAL AND TISSUE OXIMETRY DEVICES CURRENT AND FUTURE END USER ANALYSIS, 2025–2034, (USD MILLION)
FIGURE 84 CAMBODIA CEREBRAL AND TISSUE OXIMETRY DEVICES CURRENT AND FUTURE TYPE ANALYSIS, 2025–2034, (USD MILLION)
FIGURE 85 CAMBODIA CEREBRAL AND TISSUE OXIMETRY DEVICES CURRENT AND FUTURE END USER ANALYSIS, 2025–2034, (USD MILLION)
FIGURE 86 FIJI CEREBRAL AND TISSUE OXIMETRY DEVICES CURRENT AND FUTURE TYPE ANALYSIS, 2025–2034, (USD MILLION)
FIGURE 87 FIJI CEREBRAL AND TISSUE OXIMETRY DEVICES CURRENT AND FUTURE END USER ANALYSIS, 2025–2034, (USD MILLION)
FIGURE 88 INDONESIA CEREBRAL AND TISSUE OXIMETRY DEVICES CURRENT AND FUTURE TYPE ANALYSIS, 2025–2034, (USD MILLION)
FIGURE 89 INDONESIA CEREBRAL AND TISSUE OXIMETRY DEVICES CURRENT AND FUTURE END USER ANALYSIS, 2025–2034, (USD MILLION)
FIGURE 90 SOUTH KOREA CEREBRAL AND TISSUE OXIMETRY DEVICES CURRENT AND FUTURE TYPE ANALYSIS, 2025–2034, (USD MILLION)
FIGURE 91 SOUTH KOREA CEREBRAL AND TISSUE OXIMETRY DEVICES CURRENT AND FUTURE END USER ANALYSIS, 2025–2034, (USD MILLION)
FIGURE 92 REST OF EAST ASIA AND PACIFIC CEREBRAL AND TISSUE OXIMETRY DEVICES CURRENT AND FUTURE TYPE ANALYSIS, 2025–2034, (USD MILLION)
FIGURE 93 REST OF EAST ASIA AND PACIFIC CEREBRAL AND TISSUE OXIMETRY DEVICES CURRENT AND FUTURE END USER ANALYSIS, 2025–2034, (USD MILLION)
FIGURE 94 SEA AND SOUTH ASIA CEREBRAL AND TISSUE OXIMETRY DEVICES CURRENT AND FUTURE MARKET VOLUME SHARE REGIONAL ANALYSIS, 2025–2034, (USD MILLION)
FIGURE 95 BANGLADESH CEREBRAL AND TISSUE OXIMETRY DEVICES CURRENT AND FUTURE TYPE ANALYSIS, 2025–2034, (USD MILLION)
FIGURE 96 BANGLADESH CEREBRAL AND TISSUE OXIMETRY DEVICES CURRENT AND FUTURE END USER ANALYSIS, 2025–2034, (USD MILLION)
FIGURE 97 NEW ZEALAND CEREBRAL AND TISSUE OXIMETRY DEVICES CURRENT AND FUTURE TYPE ANALYSIS, 2025–2034, (USD MILLION)
FIGURE 98 NEW ZEALAND CEREBRAL AND TISSUE OXIMETRY DEVICES CURRENT AND FUTURE END USER ANALYSIS, 2025–2034, (USD MILLION)
FIGURE 99 INDIA CEREBRAL AND TISSUE OXIMETRY DEVICES CURRENT AND FUTURE TYPE ANALYSIS, 2025–2034, (USD MILLION)
FIGURE 100 INDIA CEREBRAL AND TISSUE OXIMETRY DEVICES CURRENT AND FUTURE END USER ANALYSIS, 2025–2034, (USD MILLION)
FIGURE 101 SINGAPORE CEREBRAL AND TISSUE OXIMETRY DEVICES CURRENT AND FUTURE TYPE ANALYSIS, 2025–2034, (USD MILLION)
FIGURE 102 SINGAPORE CEREBRAL AND TISSUE OXIMETRY DEVICES CURRENT AND FUTURE END USER ANALYSIS, 2025–2034, (USD MILLION)
FIGURE 103 THAILAND CEREBRAL AND TISSUE OXIMETRY DEVICES CURRENT AND FUTURE TYPE ANALYSIS, 2025–2034, (USD MILLION)
FIGURE 104 THAILAND CEREBRAL AND TISSUE OXIMETRY DEVICES CURRENT AND FUTURE END USER ANALYSIS, 2025–2034, (USD MILLION)
FIGURE 105 TAIWAN CEREBRAL AND TISSUE OXIMETRY DEVICES CURRENT AND FUTURE TYPE ANALYSIS, 2025–2034, (USD MILLION)
FIGURE 106 TAIWAN CEREBRAL AND TISSUE OXIMETRY DEVICES CURRENT AND FUTURE END USER ANALYSIS, 2025–2034, (USD MILLION)
FIGURE 107 MALAYSIA CEREBRAL AND TISSUE OXIMETRY DEVICES CURRENT AND FUTURE TYPE ANALYSIS, 2025–2034, (USD MILLION)
FIGURE 108 MALAYSIA CEREBRAL AND TISSUE OXIMETRY DEVICES CURRENT AND FUTURE END USER ANALYSIS, 2025–2034, (USD MILLION)
FIGURE 109 REST OF SEA AND SOUTH ASIA CEREBRAL AND TISSUE OXIMETRY DEVICES CURRENT AND FUTURE TYPE ANALYSIS, 2025–2034, (USD MILLION)
FIGURE 110 REST OF SEA AND SOUTH ASIA CEREBRAL AND TISSUE OXIMETRY DEVICES CURRENT AND FUTURE END USER ANALYSIS, 2025–2034, (USD MILLION)
FIGURE 111 MIDDLE EAST AND AFRICA CEREBRAL AND TISSUE OXIMETRY DEVICES CURRENT AND FUTURE MARKET VOLUME SHARE REGIONAL ANALYSIS, 2025–2034, (USD MILLION)
FIGURE 112 GCC COUNTRIES CEREBRAL AND TISSUE OXIMETRY DEVICES CURRENT AND FUTURE TYPE ANALYSIS, 2025–2034, (USD MILLION)
FIGURE 113 GCC COUNTRIES CEREBRAL AND TISSUE OXIMETRY DEVICES CURRENT AND FUTURE END USER ANALYSIS, 2025–2034, (USD MILLION)
FIGURE 114 SAUDI ARABIA CEREBRAL AND TISSUE OXIMETRY DEVICES CURRENT AND FUTURE TYPE ANALYSIS, 2025–2034, (USD MILLION)
FIGURE 115 SAUDI ARABIA CEREBRAL AND TISSUE OXIMETRY DEVICES CURRENT AND FUTURE END USER ANALYSIS, 2025–2034, (USD MILLION)
FIGURE 116 UAE CEREBRAL AND TISSUE OXIMETRY DEVICES CURRENT AND FUTURE TYPE ANALYSIS, 2025–2034, (USD MILLION)
FIGURE 117 UAE CEREBRAL AND TISSUE OXIMETRY DEVICES CURRENT AND FUTURE END USER ANALYSIS, 2025–2034, (USD MILLION)
FIGURE 118 BAHRAIN CEREBRAL AND TISSUE OXIMETRY DEVICES CURRENT AND FUTURE TYPE ANALYSIS, 2025–2034, (USD MILLION)
FIGURE 119 BAHRAIN CEREBRAL AND TISSUE OXIMETRY DEVICES CURRENT AND FUTURE END USER ANALYSIS, 2025–2034, (USD MILLION)
FIGURE 120 KUWAIT CEREBRAL AND TISSUE OXIMETRY DEVICES CURRENT AND FUTURE TYPE ANALYSIS, 2025–2034, (USD MILLION)
FIGURE 121 KUWAIT CEREBRAL AND TISSUE OXIMETRY DEVICES CURRENT AND FUTURE END USER ANALYSIS, 2025–2034, (USD MILLION)
FIGURE 122 OMAN CEREBRAL AND TISSUE OXIMETRY DEVICES CURRENT AND FUTURE TYPE ANALYSIS, 2025–2034, (USD MILLION)
FIGURE 123 OMAN CEREBRAL AND TISSUE OXIMETRY DEVICES CURRENT AND FUTURE END USER ANALYSIS, 2025–2034, (USD MILLION)
FIGURE 124 QATAR CEREBRAL AND TISSUE OXIMETRY DEVICES CURRENT AND FUTURE TYPE ANALYSIS, 2025–2034, (USD MILLION)
FIGURE 125 QATAR CEREBRAL AND TISSUE OXIMETRY DEVICES CURRENT AND FUTURE END USER ANALYSIS, 2025–2034, (USD MILLION)
FIGURE 126 EGYPT CEREBRAL AND TISSUE OXIMETRY DEVICES CURRENT AND FUTURE TYPE ANALYSIS, 2025–2034, (USD MILLION)
FIGURE 127 EGYPT CEREBRAL AND TISSUE OXIMETRY DEVICES CURRENT AND FUTURE END USER ANALYSIS, 2025–2034, (USD MILLION)
FIGURE 128 NIGERIA CEREBRAL AND TISSUE OXIMETRY DEVICES CURRENT AND FUTURE TYPE ANALYSIS, 2025–2034, (USD MILLION)
FIGURE 129 NIGERIA CEREBRAL AND TISSUE OXIMETRY DEVICES CURRENT AND FUTURE END USER ANALYSIS, 2025–2034, (USD MILLION)
FIGURE 130 SOUTH AFRICA CEREBRAL AND TISSUE OXIMETRY DEVICES CURRENT AND FUTURE TYPE ANALYSIS, 2025–2034, (USD MILLION)
FIGURE 131 SOUTH AFRICA CEREBRAL AND TISSUE OXIMETRY DEVICES CURRENT AND FUTURE END USER ANALYSIS, 2025–2034, (USD MILLION)
FIGURE 132 ISRAEL CEREBRAL AND TISSUE OXIMETRY DEVICES CURRENT AND FUTURE TYPE ANALYSIS, 2025–2034, (USD MILLION)
FIGURE 133 ISRAEL CEREBRAL AND TISSUE OXIMETRY DEVICES CURRENT AND FUTURE END USER ANALYSIS, 2025–2034, (USD MILLION)
FIGURE 134 REST OF MEA CEREBRAL AND TISSUE OXIMETRY DEVICES CURRENT AND FUTURE TYPE ANALYSIS, 2025–2034, (USD MILLION)
FIGURE 135 REST OF MEA CEREBRAL AND TISSUE OXIMETRY DEVICES CURRENT AND FUTURE END USER ANALYSIS, 2025–2034, (USD MILLION)
FIGURE 136 U. S. MARKET SHARE ANALYSIS BY TYPE (2024)
FIGURE 137 U. S. MARKET SHARE ANALYSIS BY END USER (2024)
FIGURE 138 CANADA MARKET SHARE ANALYSIS BY TYPE (2024)
FIGURE 139 CANADA MARKET SHARE ANALYSIS BY END USER (2024)
FIGURE 140 MEXICO MARKET SHARE ANALYSIS BY TYPE (2024)
FIGURE 141 MEXICO MARKET SHARE ANALYSIS BY END USER (2024)
FIGURE 142 CHINA MARKET SHARE ANALYSIS BY TYPE (2024)
FIGURE 143 CHINA MARKET SHARE ANALYSIS BY END USER (2024)
FIGURE 144 JAPAN MARKET SHARE ANALYSIS BY TYPE (2024)
FIGURE 145 JAPAN MARKET SHARE ANALYSIS BY END USER (2024)
FIGURE 146 INDIA MARKET SHARE ANALYSIS BY TYPE (2024)
FIGURE 147 INDIA MARKET SHARE ANALYSIS BY END USER (2024)
FIGURE 148 SOUTH KOREA MARKET SHARE ANALYSIS BY TYPE (2024)
FIGURE 149 SOUTH KOREA MARKET SHARE ANALYSIS BY END USER (2024)
FIGURE 150 SAUDI ARABIA MARKET SHARE ANALYSIS BY TYPE (2024)
FIGURE 151 SAUDI ARABIA MARKET SHARE ANALYSIS BY END USER (2024)
FIGURE 152 UAE MARKET SHARE ANALYSIS BY TYPE (2024)
FIGURE 153 UAE MARKET SHARE ANALYSIS BY END USER (2024)
FIGURE 154 EGYPT MARKET SHARE ANALYSIS BY TYPE (2024)
FIGURE 155 EGYPT MARKET SHARE ANALYSIS BY END USER (2024)
FIGURE 156 NIGERIA MARKET SHARE ANALYSIS BY TYPE (2024)
FIGURE 157 NIGERIA MARKET SHARE ANALYSIS BY END USER (2024)
FIGURE 158 SOUTH AFRICA MARKET SHARE ANALYSIS BY TYPE (2024)
FIGURE 159 SOUTH AFRICA MARKET SHARE ANALYSIS BY END USER (2024)
FIGURE 160 GERMANY MARKET SHARE ANALYSIS BY TYPE (2024)
FIGURE 161 GERMANY MARKET SHARE ANALYSIS BY END USER (2024)
FIGURE 162 FRANCE MARKET SHARE ANALYSIS BY TYPE (2024)
FIGURE 163 FRANCE MARKET SHARE ANALYSIS BY END USER (2024)
FIGURE 164 UK MARKET SHARE ANALYSIS BY TYPE (2024)
FIGURE 165 UK MARKET SHARE ANALYSIS BY END USER (2024)
FIGURE 166 SPAIN MARKET SHARE ANALYSIS BY TYPE (2024)
FIGURE 167 SPAIN MARKET SHARE ANALYSIS BY END USER (2024)
FIGURE 168 ITALY MARKET SHARE ANALYSIS BY TYPE (2024)
FIGURE 169 ITALY MARKET SHARE ANALYSIS BY END USER (2024)
FIGURE 170 BRAZIL MARKET SHARE ANALYSIS BY TYPE (2024)
FIGURE 171 BRAZIL MARKET SHARE ANALYSIS BY END USER (2024)
FIGURE 172 ARGENTINA MARKET SHARE ANALYSIS BY TYPE (2024)
FIGURE 173 ARGENTINA MARKET SHARE ANALYSIS BY END USER (2024)
FIGURE 174 COLUMBIA MARKET SHARE ANALYSIS BY TYPE (2024)
FIGURE 175 COLUMBIA MARKET SHARE ANALYSIS BY END USER (2024)
FIGURE 176 GLOBAL CEREBRAL AND TISSUE OXIMETRY DEVICES CURRENT AND FUTURE MARKET KEY COUNTRY LEVEL ANALYSIS, 2024–2034, (USD MILLION)
FIGURE 177 FINANCIAL OVERVIEW:
Key Player Analysis
Artinis Medical Systems: Artinis positions itself as a niche player with a strong focus on research-grade near-infrared spectroscopy (NIRS) technology. Its cerebral and tissue oximetry devices, including the OctaMon and PortaLite series, are widely used in academic and clinical research environments. The company has a notable presence in Europe and Asia, supported by collaborations with leading universities and neuroscience labs. Artinis differentiates through its miniaturized, wearable NIRS solutions that cater to sports science, cognitive studies, and neonatal monitoring. In 2025, Artinis continues to invest in portability and cloud-based analytics, aligning with trends in remote physiological monitoring and AI-assisted data processing. Its emphasis on usability and flexibility in research applications allows it to maintain a distinct segment presence, despite limited penetration in high-volume hospital markets.
Edwards Lifesciences Corp.: As a market leader in advanced hemodynamic monitoring, Edwards Lifesciences holds a strong position in the cerebral and tissue oximetry space through its ForeSight technology platform. Integrated into broader cardiac and surgical monitoring systems, ForeSight is widely adopted in operating rooms and ICUs across North America and Europe. The company benefits from a robust global distribution network and a focus on perioperative patient optimization. In recent years, Edwards has prioritized AI-driven data analytics and expanded EHR integration to strengthen its value proposition for hospitals aiming to streamline monitoring workflows. In 2024, the company reported a 7.8% increase in revenue from its critical care division, reflecting steady demand for advanced oximetry in high-acuity settings. Strategic partnerships with surgical centers and academic hospitals continue to reinforce Edwards' position as a clinical-first solutions provider.
Hamamatsu Photonics KK: Hamamatsu Photonics operates as a technology leader and key component supplier in the cerebral and tissue oximetry ecosystem. Known for its high-performance photodetectors and light sources, the company supports OEMs and device manufacturers with core optical technologies that underpin many commercial NIRS systems. Hamamatsu's competitive advantage lies in its deep R&D pipeline and vertical integration, allowing it to maintain tight control over product quality and customization. In 2025, the company is accelerating development of compact, low-power modules tailored for wearable applications, in response to rising demand for ambulatory and remote monitoring. Its expansion into Southeast Asia and increased investment in AI-assisted signal processing signal a long-term strategy to capture growth in emerging healthcare markets and next-gen diagnostics.
HyperMed Imaging Inc.: HyperMed Imaging is positioned as a challenger in the market, focusing on tissue oximetry solutions for wound care and peripheral vascular applications. Its HyperView system, which uses visible and near-infrared light to assess tissue oxygenation, is gaining traction in specialized clinical settings. The company’s strength lies in its ability to offer visual, color-coded oximetry maps, enhancing clinical decision-making in limb preservation and diabetic foot ulcer treatment. With a user base expanding across wound care centers in the U.S., HyperMed is leveraging its FDA-cleared platform to enter hospital outpatient departments and vascular clinics. In 2025, the company is expected to expand into Latin America and selected European markets, supported by a new distributor network and a pricing strategy aimed at mid-tier healthcare providers.
Market Key Players
Masimo Corp.
Moor Instruments Ltd.
Spectros Medical Devices Inc.
Nonin Medical Inc.
ISS Inc.
HyperMed Imaging Inc.
Medtronic Plc
Artinis Medical Systems
Hamamatsu Photonics KK
Edwards Lifesciences Corp.
Sotera Health Co.
Driver:
Rising Shift Toward Non-Invasive Monitoring in Critical Care
As of 2025, non-invasive monitoring continues to gain ground as a standard in patient management, especially across surgical and intensive care environments. Cerebral and tissue oximetry devices provide real-time insights without the risks or discomfort of invasive procedures. This demand is rising in tandem with global surgical volumes, which are growing at an estimated 4.2% annually. The ability to monitor brain and tissue oxygenation in real time is particularly vital in high-risk procedures like cardiac and neurosurgery. The shift toward non-invasive tools is also being reinforced by patient safety protocols and hospital efficiency mandates.
Technology upgrades have played a pivotal role in accelerating market momentum. Wireless connectivity, smart sensors, and advanced signal processing now allow for more accurate, continuous, and remote monitoring. Device manufacturers are embedding machine learning algorithms to support predictive diagnostics, giving clinicians faster and more reliable tools. This progress is not just enhancing clinical outcomes; it is reshaping procurement decisions across hospitals looking to standardize care with newer, interoperable systems.
Restraint:
High Capital Costs Limiting Broader Market Penetration
Despite rising demand, cost remains a major barrier to widespread adoption. In 2025, the average acquisition cost of a high-end cerebral oximetry device ranges between USD 15,000 and USD 25,000, excluding maintenance and calibration services. These expenses limit access for smaller clinics and hospitals, particularly in developing regions where budget constraints are tighter. Without financial support mechanisms, many providers hesitate to invest in these systems even when clinical need is evident.
Reimbursement Gaps and Accuracy Concerns Slowing Integration
In parallel, reimbursement gaps continue to affect market uptake. Inconsistent coding and limited coverage for oximetry-based procedures in several healthcare systems reduce provider incentives to integrate these devices into regular practice. This particularly impacts outpatient settings, where margins are thinner. Moreover, lingering concerns around device accuracy in variable patient conditions have led some clinicians to rely on oximetry as a supplemental rather than primary monitoring tool, delaying full-scale integration into standard care protocols.
Opportunity:
Expanding Neonatal Applications as a Core Growth Engine
Neonatal care presents a high-growth segment, driven by increasing awareness of cerebral oxygen monitoring in preterm infants. Globally, over 15 million babies are born prematurely each year, with many requiring extended NICU stays. Continuous cerebral oximetry can play a critical role in reducing the risk of neurodevelopmental complications. By 2030, neonatal applications are expected to represent over 20% of total market revenue, particularly in countries scaling up perinatal care infrastructure. Manufacturers focusing on miniaturized, low-weight designs tailored for infants are well-positioned to lead in this niche.
Home Healthcare Adoption Creating New Revenue Pathways
Home healthcare also presents untapped potential. The shift toward decentralized care, supported by telehealth platforms, has created demand for portable and patient-friendly monitoring tools. As of 2025, over 30% of chronic patients in the U.S. are engaged in some form of home-based monitoring. Oximetry device makers that offer easy-to-use, Bluetooth-enabled models are likely to see increased traction in both high-income and aging populations. Emerging markets with growing middle classes are also opening new channels for personal-use medical devices.
AI-driven analytics is reshaping how clinicians interpret data from cerebral and tissue oximetry devices. Advanced algorithms now flag early signs of oxygen desaturation and correlate readings with other patient vitals. This real-time risk stratification supports earlier interventions in operating rooms and ICUs. By 2025, more than 40% of new oximetry systems launched by major players include AI capabilities, reflecting a broader shift toward intelligent diagnostics.
Wireless and Cloud Integration Driving Connected Care Models
Another defining trend is the integration of wireless and cloud-based monitoring. Hospitals are increasingly adopting platforms that centralize data from multiple devices, enabling remote supervision and faster clinical decision-making. In Asia Pacific, where rural access to specialists remains limited, remote-capable oximetry systems are seeing double-digit growth. This connectivity also supports long-term monitoring in outpatient settings, aligning with the expanding role of telemedicine and digital health across global healthcare systems.
Recent Developments
Dec 2024 – Edwards Lifesciences Corp.: Edwards launched the ForeSight ELITE platform across U.S. and European hospitals, integrating AI-based oxygenation analytics with its hemodynamic monitoring systems. The rollout, covering over 300 hospital systems, is aimed at expanding the company’s presence in high-acuity surgical settings. This move strengthens Edwards' foothold in integrated monitoring and supports hospital procurement of consolidated platforms.
Feb 2025 – HyperMed Imaging Inc.: HyperMed entered a multi-year distribution agreement with a leading Latin American medical device supplier to expand its HyperView system into Brazil, Colombia, and Chile. The agreement is expected to generate over USD 18 million in regional revenue by 2027. The expansion diversifies HyperMed’s geographic footprint and positions it for growth in vascular diagnostics across emerging markets.
Apr 2025 – Hamamatsu Photonics KK: Hamamatsu introduced a new OEM sensor module for wearable cerebral oximetry devices, designed for integration into portable and ambulatory monitoring platforms. Early adoption by three major medical device brands is projected to generate USD 25–30 million in licensing revenue over the next 24 months. This strengthens Hamamatsu’s role as a core technology supplier driving miniaturization and mobile health applications.
Jul 2025 – Nonin Medical, Inc.: Nonin announced the launch of a wireless, multi-parameter oximetry system targeting outpatient surgical centers and telehealth programs. The system includes remote data transmission and EHR integration, with pilot deployments underway in 120 U.S. facilities. This product diversification enhances Nonin’s competitiveness in decentralized care and home-based monitoring.
Sep 2025 – Artinis Medical Systems: Artinis signed a collaboration agreement with the European Institute for Neonatal Research to co-develop infant-specific NIRS monitoring devices. The joint development project, supported by EUR 4.5 million in EU healthcare grants, aims to launch commercially viable models by 2026. This positions Artinis as a specialized provider in neonatal applications and strengthens its academic research partnerships.