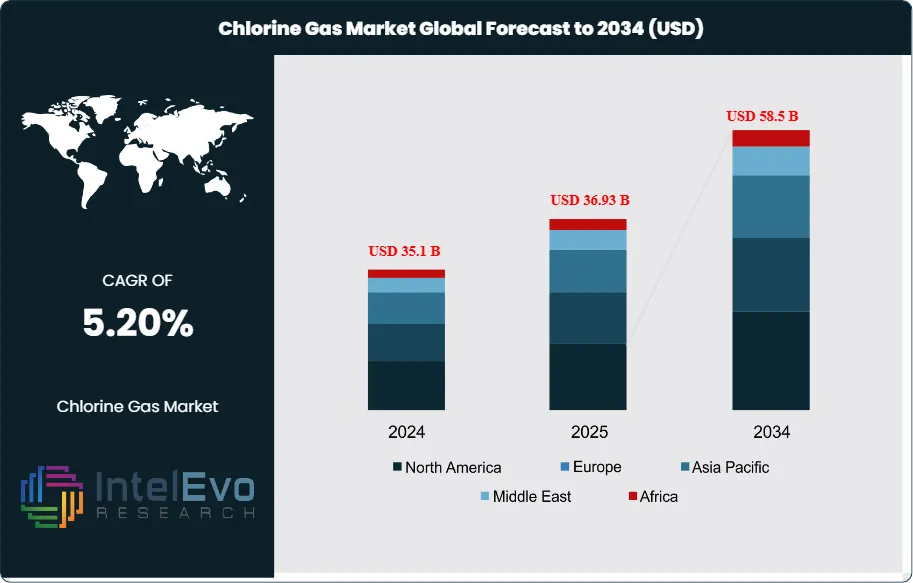
The Chlorine Gas Market is estimated at USD 35.1 billion in 2024 and is projected to reach approximately USD 58.5 billion by 2034, registering a CAGR of about 5.2% during 2025–2034. Growth is being driven by sustained demand from water treatment, food processing sanitation, pharmaceuticals, and PVC manufacturing, where chlorine remains a critical and cost-effective input. Expanding municipal water disinfection programs in emerging economies, rising packaged food output, and continued infrastructure investments are reinforcing baseline consumption. In parallel, the shift toward energy-efficient membrane-cell chlor-alkali technology and long-term supply contracts is improving operational stability, positioning chlorine gas as a structurally resilient commodity chemical over the next decade.
Chlorine remains a core building block of the chemical value chain. Annual output exceeds 70 million metric tons, driven by the chlor-alkali process that co-produces sodium hydroxide and hydrogen. Demand tracks PVC, water treatment, and a broad set of intermediates. Roughly 35 to 40 percent of chlorine feeds the EDC-VCM-PVC chain. Asia-Pacific accounts for about 40 percent of global demand and continues to add capacity alongside downstream PVC. You should expect a steady shift in volumes toward construction, infrastructure, and urban services across India, Southeast Asia, and China.
Growth rests on three pillars. First, construction and infrastructure keep PVC demand resilient, with residential and utilities spend supporting pipes, profiles, and wiring. Second, municipal and industrial water markets expand, supported by stricter disinfection rules and water reuse. Many cities target chemical spend growth of 6 to 8 percent annually. Third, food safety standards lift usage in sanitation; typical chlorine concentrations range from 50 to 200 ppm for food-contact surfaces. On the supply side, electricity is the largest cost line; membrane cells typically consume 2,200 to 2,500 kWh per metric ton of chlorine. This makes regional power prices a key margin driver.
Risk factors are clear. Chlorine transport is limited, so producers rely on co-located demand or conversion to derivatives such as EDC and PVC. Co-product balancing with caustic soda can tighten availability or cap run rates. Formation of disinfection by-products, including trihalomethanes, prompts tighter limits in some markets and supports a gradual shift to on-site hypochlorite generation or alternative oxidants in sensitive applications.
Technology upgrades shape cost curves. Continued conversion from legacy cells to membrane plants cuts energy intensity by double digits and removes mercury-related liabilities. In India, the PAT scheme encourages higher-efficiency operations and membrane adoption. In Europe, prior mercury phase-out and recent energy volatility prompted capacity rationalization, improving utilization of remaining assets. In North America, debottlenecking aligns with stable power and integrated PVC chains. The Middle East presents an emerging investment case tied to integrated petrochemicals and salt resources. For investors, Asia-Pacific PVC, regulated water markets, and energy-advantaged chlor-alkali sites are the primary hotspots over the next decade.
Key Takeaways
Market Growth: The market stands at USD 35.1 billion in 2024 and is set to reach USD 58.5 billion by 2034 at a 5.2% CAGR. Growth tracks PVC demand, municipal water disinfection, and industrial sanitation; global chlorine output exceeds 70 million metric tons annually.
Application: Water treatment leads with 36.3% share in 2024. Tightening potable water and wastewater standards keep volumes resilient across municipalities and industry; typical sanitation uses 50 to 200 ppm chlorine.
End Use: The chemical industry holds 41.2% share. The EDC–VCM–PVC chain consumes about 35 to 40% of chlorine globally, supported by construction and utilities spending in Asia.
Driver: PVC-linked construction demand and urban infrastructure outlays lift baseline growth. Asia-Pacific accounts for roughly 40% of chlorine demand and 43.4% of revenues in 2024, underpinned by integrated chlor-alkali and PVC capacity.
Restraint: Energy intensity remains high at 2,200 to 2,500 kWh per metric ton. Electricity can represent 45 to 55% of cash costs; power price spikes have triggered curtailments in Europe and can compress margins by double digits.
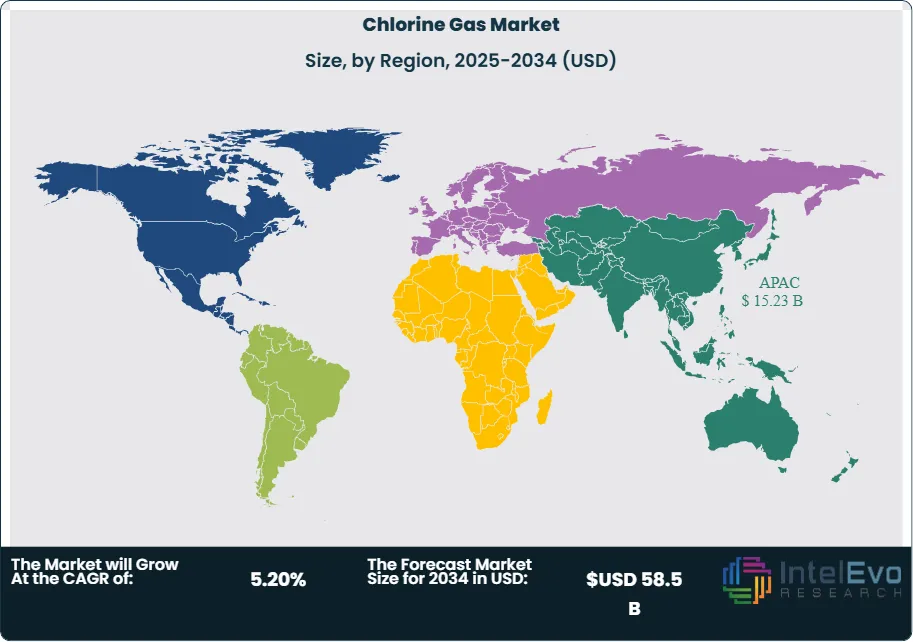
Opportunity: Regulated water markets in APAC and the Middle East show the fastest growth. You can target projects in municipal disinfection and reuse where segment CAGRs of 6 to 8% are common; APAC revenues reached USD 14.3 billion with room for greenfield capacity.
Trend: Conversion to membrane cell technology accelerates. Membrane share is approaching 75 to 80% of global capacity, lowering energy intensity and eliminating mercury-related liabilities; producers such as Olin, Westlake, Shin-Etsu, and Grasim continue debottlenecking and efficiency upgrades.
Regional Analysis: Asia-Pacific leads with 43.4% revenue share in 2024. North America benefits from integrated PVC chains and steadier power, supporting 4 to 5% growth; Europe remains capacity-constrained after energy volatility; the Middle East and India emerge as investment hotspots with 6%+ projected CAGRs.
Form Analysis
Power form maintained a dominant position in 2024 with 69.1% share. Users value precise dosing, continuous supply, and stable purity for chlorination, EDC-VCM-PVC, and bleach conversion lines. Expect this lead to persist in 2025 and beyond as utilities and integrated chemical parks standardize on high-reliability feed. Typical membrane-cell energy intensity ranges from 2,200 to 2,500 kWh per ton of chlorine, which keeps form selection closely tied to onsite power economics.
Liquid form serves bulk movements to PVC complexes and large water treatment hubs. Adoption rises where pipeline connections and captive brine-to-chlorine units are in place. Others include onsite hypochlorite generation for facilities that avoid chlorine handling. Global chlorine output remains above 70 million metric tons per year. Power and liquid forms will track the market CAGR of about 5.5% through 2034, with liquid slightly faster in PVC-centric corridors.
Packaging Analysis
Bags held 54.2% share in 2024 and remain the preferred option for small and mid-volume users that prioritize handling simplicity and storage efficiency. Utilities and light manufacturing favor standardized bagged units for predictable dosing and inventory control. The format aligns with safety procedures and short-haul distribution. Expect steady demand in 2025 as municipal budgets and O&M contracts expand.
Drums and other industrial containers support higher-volume users across chemicals and large treatment assets. These formats enable tighter logistics control and fewer changeovers. Freight, containment, and regulatory compliance costs drive packaging choice. You should plan packaging strategy by site throughput and operator safety KPIs. Packaging mix will remain stable near current shares while compliance spending rises in double digits in stricter jurisdictions.
Application Analysis
Water treatment led with 36.3% share in 2024 and will retain the top spot. Cities continue to expand disinfection and reuse capacity to meet stricter potable and wastewater standards. Typical application rates range from 1 to 3 mg/L for potable systems, with 50 to 200 ppm used for food-contact surface sanitation. Budgeted growth in municipal chemicals often sits at 6 to 8% per year in large metros.
EDC/PVC remains the second anchor application with about one third of total consumption in many markets. Construction activity, pipe replacement cycles, and cable demand keep the PVC chain resilient. Organic and inorganic chemicals, isocyanates, chlorinated intermediates, propylene oxide, C1/C2, and aromatics form a diversified tail that stabilizes plant utilization. Co-product balancing with caustic soda can influence run rates and availability during demand swings.
End-Use Analysis
The chemical sector accounted for 41.2% share in 2024 and will stay the core sink for chlorine through 2030. Integrated chlor-alkali complexes that feed PVC, epichlorohydrin, and chlorinated solvents anchor long-term contracts and capacity planning. Producers such as Olin, Westlake, OxyChem, INEOS Inovyn, Shin-Etsu, Tosoh, and Grasim continue to focus on energy efficiency and membrane debottlenecking.
Pharmaceuticals, paper and pulp, and agriculture provide steady multi-year demand. Pharma relies on chlorinated intermediates for APIs and sanitization. Pulp and paper use chlorine-based chemistries under tighter environmental controls. Automotive and construction aggregate demand via PVC profiles, wiring, films, and coatings. Expect mid single-digit growth across these verticals, with higher rates where sanitation and packaging investments accelerate.
Regional Analysis
Asia Pacific led with 43.4% share in 2024, or about USD 14.3 billion, supported by China, India, and Southeast Asia. The region benefits from integrated PVC chains, large-scale water programs, and new chlor-alkali capacity. APAC is projected to grow at 6% or more as infrastructure and urban services expand. India’s PAT scheme continues to push membrane adoption and lower unit energy costs.
North America shows stable growth at 4 to 5% on the back of competitive power, salt resources, and integrated PVC assets along the Gulf Coast. Europe remains constrained after energy price volatility and past mercury cell retirements. The region emphasizes utilization and selective upgrades rather than greenfield builds. Latin America and the Middle East & Africa present emerging opportunities with 5 to 7% projected CAGRs tied to desalination, municipal water investment, and petrochemical integration. You should watch the Middle East for integrated chlor-alkali units linked to low-cost power and brine.
Customization for segments, region/country-level will be provided. Moreover, additional customization can be done based on the requirements.
Pricing and Purchase Options
Avail customized purchase options to meet your exact research needs. We have three licenses to opt for: Single User License, Multi-User License (Up to 5 Users), Corporate Use License (Unlimited User and Printable PDF).
TABLE OF CONTENTS
1. EXECUTIVE SUMMARY
1.1. MARKET SNAPSHOT
1.2. KEY FINDINGS & INSIGHTS
1.3. ANALYST RECOMMENDATIONS
1.4. FUTURE OUTLOOK
2. RESEARCH METHODOLOGY
2.1. MARKET DEFINITION & SCOPE
2.2. RESEARCH OBJECTIVES: PRIMARY & SECONDARY DATA SOURCES
2.3. DATA COLLECTION SOURCES
2.3.1. COVERAGE OF 100+ PRIMARY RESEARCH/CONSULTATION CALLS WITH INDUSTRY STAKEHOLDERS
FIGURE 17 NORTH AMERICA CHLORINE GAS CURRENT AND FUTURE TYPE ANALYSIS, 2025–2034, (USD MILLION)
FIGURE 18 NORTH AMERICA CHLORINE GAS CURRENT AND FUTURE END USER ANALYSIS, 2025–2034, (USD MILLION)
FIGURE 19 MARKET SHARE BY COUNTRY
FIGURE 20 LATIN AMERICA CHLORINE GAS CURRENT AND FUTURE TYPE ANALYSIS, 2025–2034, (USD MILLION)
FIGURE 21 LATIN AMERICA CHLORINE GAS CURRENT AND FUTURE END USER ANALYSIS, 2025–2034, (USD MILLION)
FIGURE 22 MARKET SHARE BY COUNTRY
FIGURE 23 EASTERN EUROPE CHLORINE GAS CURRENT AND FUTURE TYPE ANALYSIS, 2025–2034, (USD MILLION)
FIGURE 24 EASTERN EUROPE CHLORINE GAS CURRENT AND FUTURE END USER ANALYSIS, 2025–2034, (USD MILLION)
FIGURE 25 MARKET SHARE BY COUNTRY
FIGURE 26 WESTERN EUROPE CHLORINE GAS CURRENT AND FUTURE TYPE ANALYSIS, 2025–2034, (USD MILLION)
FIGURE 27 WESTERN EUROPE CHLORINE GAS CURRENT AND FUTURE END USER ANALYSIS, 2025–2034, (USD MILLION)
FIGURE 28 MARKET SHARE BY COUNTRY
FIGURE 29 EAST ASIA AND PACIFIC CHLORINE GAS CURRENT AND FUTURE TYPE ANALYSIS, 2025–2034, (USD MILLION)
FIGURE 30 EAST ASIA AND PACIFIC CHLORINE GAS CURRENT AND FUTURE END USER ANALYSIS, 2025–2034, (USD MILLION)
FIGURE 31 MARKET SHARE BY COUNTRY
FIGURE 32 SEA AND SOUTH ASIA CHLORINE GAS CURRENT AND FUTURE TYPE ANALYSIS, 2025–2034, (USD MILLION)
FIGURE 33 SEA AND SOUTH ASIA CHLORINE GAS CURRENT AND FUTURE END USER ANALYSIS, 2025–2034, (USD MILLION)
FIGURE 34 MARKET SHARE BY COUNTRY
FIGURE 35 MIDDLE EAST AND AFRICA CHLORINE GAS CURRENT AND FUTURE TYPE ANALYSIS, 2025–2034, (USD MILLION)
FIGURE 36 MIDDLE EAST AND AFRICA CHLORINE GAS CURRENT AND FUTURE END USER ANALYSIS, 2025–2034, (USD MILLION)
FIGURE 37 NORTH AMERICA CHLORINE GAS CURRENT AND FUTURE MARKET VOLUME SHARE REGIONAL ANALYSIS, 2025–2034, (USD MILLION)
FIGURE 38 U.S. CHLORINE GAS CURRENT AND FUTURE TYPE ANALYSIS, 2025–2034, (USD MILLION)
FIGURE 39 U.S. CHLORINE GAS CURRENT AND FUTURE END USER ANALYSIS, 2025–2034, (USD MILLION)
FIGURE 40 CANADA CHLORINE GAS CURRENT AND FUTURE TYPE ANALYSIS, 2025–2034, (USD MILLION)
FIGURE 41 CANADA CHLORINE GAS CURRENT AND FUTURE END USER ANALYSIS, 2025–2034, (USD MILLION)
FIGURE 42 LATIN AMERICA CHLORINE GAS CURRENT AND FUTURE MARKET VOLUME SHARE REGIONAL ANALYSIS, 2025–2034, (USD MILLION)
FIGURE 43 MEXICO CHLORINE GAS CURRENT AND FUTURE TYPE ANALYSIS, 2025–2034, (USD MILLION)
FIGURE 44 MEXICO CHLORINE GAS CURRENT AND FUTURE END USER ANALYSIS, 2025–2034, (USD MILLION)
FIGURE 45 BRAZIL CHLORINE GAS CURRENT AND FUTURE TYPE ANALYSIS, 2025–2034, (USD MILLION)
FIGURE 46 BRAZIL CHLORINE GAS CURRENT AND FUTURE END USER ANALYSIS, 2025–2034, (USD MILLION)
FIGURE 47 ARGENTINA CHLORINE GAS CURRENT AND FUTURE TYPE ANALYSIS, 2025–2034, (USD MILLION)
FIGURE 48 ARGENTINA CHLORINE GAS CURRENT AND FUTURE END USER ANALYSIS, 2025–2034, (USD MILLION)
FIGURE 49 COLUMBIA CHLORINE GAS CURRENT AND FUTURE TYPE ANALYSIS, 2025–2034, (USD MILLION)
FIGURE 50 COLUMBIA CHLORINE GAS CURRENT AND FUTURE END USER ANALYSIS, 2025–2034, (USD MILLION)
FIGURE 51 REST OF LATIN AMERICA CHLORINE GAS CURRENT AND FUTURE TYPE ANALYSIS, 2025–2034, (USD MILLION)
FIGURE 52 REST OF LATIN AMERICA CHLORINE GAS CURRENT AND FUTURE END USER ANALYSIS, 2025–2034, (USD MILLION)
FIGURE 53 EASTERN EUROPE CHLORINE GAS CURRENT AND FUTURE MARKET VOLUME SHARE REGIONAL ANALYSIS, 2025–2034, (USD MILLION)
FIGURE 54 POLAND CHLORINE GAS CURRENT AND FUTURE TYPE ANALYSIS, 2025–2034, (USD MILLION)
FIGURE 55 POLAND CHLORINE GAS CURRENT AND FUTURE END USER ANALYSIS, 2025–2034, (USD MILLION)
FIGURE 56 RUSSIA CHLORINE GAS CURRENT AND FUTURE TYPE ANALYSIS, 2025–2034, (USD MILLION)
FIGURE 57 RUSSIA CHLORINE GAS CURRENT AND FUTURE END USER ANALYSIS, 2025–2034, (USD MILLION)
FIGURE 58 CZECH REPUBLIC CHLORINE GAS CURRENT AND FUTURE TYPE ANALYSIS, 2025–2034, (USD MILLION)
FIGURE 59 CZECH REPUBLIC CHLORINE GAS CURRENT AND FUTURE END USER ANALYSIS, 2025–2034, (USD MILLION)
FIGURE 60 ROMANIA CHLORINE GAS CURRENT AND FUTURE TYPE ANALYSIS, 2025–2034, (USD MILLION)
FIGURE 61 ROMANIA CHLORINE GAS CURRENT AND FUTURE END USER ANALYSIS, 2025–2034, (USD MILLION)
FIGURE 62 REST OF EASTERN EUROPE CHLORINE GAS CURRENT AND FUTURE TYPE ANALYSIS, 2025–2034, (USD MILLION)
FIGURE 63 REST OF EASTERN EUROPE CHLORINE GAS CURRENT AND FUTURE END USER ANALYSIS, 2025–2034, (USD MILLION)
FIGURE 64 WESTERN EUROPE CHLORINE GAS CURRENT AND FUTURE MARKET VOLUME SHARE REGIONAL ANALYSIS, 2025–2034, (USD MILLION)
FIGURE 65 GERMANY CHLORINE GAS CURRENT AND FUTURE TYPE ANALYSIS, 2025–2034, (USD MILLION)
FIGURE 66 GERMANY CHLORINE GAS CURRENT AND FUTURE END USER ANALYSIS, 2025–2034, (USD MILLION)
FIGURE 67 FRANCE CHLORINE GAS CURRENT AND FUTURE TYPE ANALYSIS, 2025–2034, (USD MILLION)
FIGURE 68 FRANCE CHLORINE GAS CURRENT AND FUTURE END USER ANALYSIS, 2025–2034, (USD MILLION)
FIGURE 69 UK CHLORINE GAS CURRENT AND FUTURE TYPE ANALYSIS, 2025–2034, (USD MILLION)
FIGURE 70 UK CHLORINE GAS CURRENT AND FUTURE END USER ANALYSIS, 2025–2034, (USD MILLION)
FIGURE 71 SPAIN CHLORINE GAS CURRENT AND FUTURE TYPE ANALYSIS, 2025–2034, (USD MILLION)
FIGURE 72 SPAIN CHLORINE GAS CURRENT AND FUTURE END USER ANALYSIS, 2025–2034, (USD MILLION)
FIGURE 73 ITALY CHLORINE GAS CURRENT AND FUTURE TYPE ANALYSIS, 2025–2034, (USD MILLION)
FIGURE 74 ITALY CHLORINE GAS CURRENT AND FUTURE END USER ANALYSIS, 2025–2034, (USD MILLION)
FIGURE 75 REST OF WESTERN EUROPE CHLORINE GAS CURRENT AND FUTURE TYPE ANALYSIS, 2025–2034, (USD MILLION)
FIGURE 76 REST OF WESTERN EUROPE CHLORINE GAS CURRENT AND FUTURE END USER ANALYSIS, 2025–2034, (USD MILLION)
FIGURE 77 EAST ASIA AND PACIFIC CHLORINE GAS CURRENT AND FUTURE MARKET VOLUME SHARE REGIONAL ANALYSIS, 2025–2034, (USD MILLION)
FIGURE 78 CHINA CHLORINE GAS CURRENT AND FUTURE TYPE ANALYSIS, 2025–2034, (USD MILLION)
FIGURE 79 CHINA CHLORINE GAS CURRENT AND FUTURE END USER ANALYSIS, 2025–2034, (USD MILLION)
FIGURE 80 JAPAN CHLORINE GAS CURRENT AND FUTURE TYPE ANALYSIS, 2025–2034, (USD MILLION)
FIGURE 81 JAPAN CHLORINE GAS CURRENT AND FUTURE END USER ANALYSIS, 2025–2034, (USD MILLION)
FIGURE 82 AUSTRALIA CHLORINE GAS CURRENT AND FUTURE TYPE ANALYSIS, 2025–2034, (USD MILLION)
FIGURE 83 AUSTRALIA CHLORINE GAS CURRENT AND FUTURE END USER ANALYSIS, 2025–2034, (USD MILLION)
FIGURE 84 CAMBODIA CHLORINE GAS CURRENT AND FUTURE TYPE ANALYSIS, 2025–2034, (USD MILLION)
FIGURE 85 CAMBODIA CHLORINE GAS CURRENT AND FUTURE END USER ANALYSIS, 2025–2034, (USD MILLION)
FIGURE 86 FIJI CHLORINE GAS CURRENT AND FUTURE TYPE ANALYSIS, 2025–2034, (USD MILLION)
FIGURE 87 FIJI CHLORINE GAS CURRENT AND FUTURE END USER ANALYSIS, 2025–2034, (USD MILLION)
FIGURE 88 INDONESIA CHLORINE GAS CURRENT AND FUTURE TYPE ANALYSIS, 2025–2034, (USD MILLION)
FIGURE 89 INDONESIA CHLORINE GAS CURRENT AND FUTURE END USER ANALYSIS, 2025–2034, (USD MILLION)
FIGURE 90 SOUTH KOREA CHLORINE GAS CURRENT AND FUTURE TYPE ANALYSIS, 2025–2034, (USD MILLION)
FIGURE 91 SOUTH KOREA CHLORINE GAS CURRENT AND FUTURE END USER ANALYSIS, 2025–2034, (USD MILLION)
FIGURE 92 REST OF EAST ASIA AND PACIFIC CHLORINE GAS CURRENT AND FUTURE TYPE ANALYSIS, 2025–2034, (USD MILLION)
FIGURE 93 REST OF EAST ASIA AND PACIFIC CHLORINE GAS CURRENT AND FUTURE END USER ANALYSIS, 2025–2034, (USD MILLION)
FIGURE 94 SEA AND SOUTH ASIA CHLORINE GAS CURRENT AND FUTURE MARKET VOLUME SHARE REGIONAL ANALYSIS, 2025–2034, (USD MILLION)
FIGURE 95 BANGLADESH CHLORINE GAS CURRENT AND FUTURE TYPE ANALYSIS, 2025–2034, (USD MILLION)
FIGURE 96 BANGLADESH CHLORINE GAS CURRENT AND FUTURE END USER ANALYSIS, 2025–2034, (USD MILLION)
FIGURE 97 NEW ZEALAND CHLORINE GAS CURRENT AND FUTURE TYPE ANALYSIS, 2025–2034, (USD MILLION)
FIGURE 98 NEW ZEALAND CHLORINE GAS CURRENT AND FUTURE END USER ANALYSIS, 2025–2034, (USD MILLION)
FIGURE 99 INDIA CHLORINE GAS CURRENT AND FUTURE TYPE ANALYSIS, 2025–2034, (USD MILLION)
FIGURE 100 INDIA CHLORINE GAS CURRENT AND FUTURE END USER ANALYSIS, 2025–2034, (USD MILLION)
FIGURE 101 SINGAPORE CHLORINE GAS CURRENT AND FUTURE TYPE ANALYSIS, 2025–2034, (USD MILLION)
FIGURE 102 SINGAPORE CHLORINE GAS CURRENT AND FUTURE END USER ANALYSIS, 2025–2034, (USD MILLION)
FIGURE 103 THAILAND CHLORINE GAS CURRENT AND FUTURE TYPE ANALYSIS, 2025–2034, (USD MILLION)
FIGURE 104 THAILAND CHLORINE GAS CURRENT AND FUTURE END USER ANALYSIS, 2025–2034, (USD MILLION)
FIGURE 105 TAIWAN CHLORINE GAS CURRENT AND FUTURE TYPE ANALYSIS, 2025–2034, (USD MILLION)
FIGURE 106 TAIWAN CHLORINE GAS CURRENT AND FUTURE END USER ANALYSIS, 2025–2034, (USD MILLION)
FIGURE 107 MALAYSIA CHLORINE GAS CURRENT AND FUTURE TYPE ANALYSIS, 2025–2034, (USD MILLION)
FIGURE 108 MALAYSIA CHLORINE GAS CURRENT AND FUTURE END USER ANALYSIS, 2025–2034, (USD MILLION)
FIGURE 109 REST OF SEA AND SOUTH ASIA CHLORINE GAS CURRENT AND FUTURE TYPE ANALYSIS, 2025–2034, (USD MILLION)
FIGURE 110 REST OF SEA AND SOUTH ASIA CHLORINE GAS CURRENT AND FUTURE END USER ANALYSIS, 2025–2034, (USD MILLION)
FIGURE 111 MIDDLE EAST AND AFRICA CHLORINE GAS CURRENT AND FUTURE MARKET VOLUME SHARE REGIONAL ANALYSIS, 2025–2034, (USD MILLION)
FIGURE 112 GCC COUNTRIES CHLORINE GAS CURRENT AND FUTURE TYPE ANALYSIS, 2025–2034, (USD MILLION)
FIGURE 113 GCC COUNTRIES CHLORINE GAS CURRENT AND FUTURE END USER ANALYSIS, 2025–2034, (USD MILLION)
FIGURE 114 SAUDI ARABIA CHLORINE GAS CURRENT AND FUTURE TYPE ANALYSIS, 2025–2034, (USD MILLION)
FIGURE 115 SAUDI ARABIA CHLORINE GAS CURRENT AND FUTURE END USER ANALYSIS, 2025–2034, (USD MILLION)
FIGURE 116 UAE CHLORINE GAS CURRENT AND FUTURE TYPE ANALYSIS, 2025–2034, (USD MILLION)
FIGURE 117 UAE CHLORINE GAS CURRENT AND FUTURE END USER ANALYSIS, 2025–2034, (USD MILLION)
FIGURE 118 BAHRAIN CHLORINE GAS CURRENT AND FUTURE TYPE ANALYSIS, 2025–2034, (USD MILLION)
FIGURE 119 BAHRAIN CHLORINE GAS CURRENT AND FUTURE END USER ANALYSIS, 2025–2034, (USD MILLION)
FIGURE 120 KUWAIT CHLORINE GAS CURRENT AND FUTURE TYPE ANALYSIS, 2025–2034, (USD MILLION)
FIGURE 121 KUWAIT CHLORINE GAS CURRENT AND FUTURE END USER ANALYSIS, 2025–2034, (USD MILLION)
FIGURE 122 OMAN CHLORINE GAS CURRENT AND FUTURE TYPE ANALYSIS, 2025–2034, (USD MILLION)
FIGURE 123 OMAN CHLORINE GAS CURRENT AND FUTURE END USER ANALYSIS, 2025–2034, (USD MILLION)
FIGURE 124 QATAR CHLORINE GAS CURRENT AND FUTURE TYPE ANALYSIS, 2025–2034, (USD MILLION)
FIGURE 125 QATAR CHLORINE GAS CURRENT AND FUTURE END USER ANALYSIS, 2025–2034, (USD MILLION)
FIGURE 126 EGYPT CHLORINE GAS CURRENT AND FUTURE TYPE ANALYSIS, 2025–2034, (USD MILLION)
FIGURE 127 EGYPT CHLORINE GAS CURRENT AND FUTURE END USER ANALYSIS, 2025–2034, (USD MILLION)
FIGURE 128 NIGERIA CHLORINE GAS CURRENT AND FUTURE TYPE ANALYSIS, 2025–2034, (USD MILLION)
FIGURE 129 NIGERIA CHLORINE GAS CURRENT AND FUTURE END USER ANALYSIS, 2025–2034, (USD MILLION)
FIGURE 130 SOUTH AFRICA CHLORINE GAS CURRENT AND FUTURE TYPE ANALYSIS, 2025–2034, (USD MILLION)
FIGURE 131 SOUTH AFRICA CHLORINE GAS CURRENT AND FUTURE END USER ANALYSIS, 2025–2034, (USD MILLION)
FIGURE 132 ISRAEL CHLORINE GAS CURRENT AND FUTURE TYPE ANALYSIS, 2025–2034, (USD MILLION)
FIGURE 133 ISRAEL CHLORINE GAS CURRENT AND FUTURE END USER ANALYSIS, 2025–2034, (USD MILLION)
FIGURE 134 REST OF MEA CHLORINE GAS CURRENT AND FUTURE TYPE ANALYSIS, 2025–2034, (USD MILLION)
FIGURE 135 REST OF MEA CHLORINE GAS CURRENT AND FUTURE END USER ANALYSIS, 2025–2034, (USD MILLION)
FIGURE 136 U. S. MARKET SHARE ANALYSIS BY TYPE (2024)
FIGURE 137 U. S. MARKET SHARE ANALYSIS BY END USER (2024)
FIGURE 138 CANADA MARKET SHARE ANALYSIS BY TYPE (2024)
FIGURE 139 CANADA MARKET SHARE ANALYSIS BY END USER (2024)
FIGURE 140 MEXICO MARKET SHARE ANALYSIS BY TYPE (2024)
FIGURE 141 MEXICO MARKET SHARE ANALYSIS BY END USER (2024)
FIGURE 142 CHINA MARKET SHARE ANALYSIS BY TYPE (2024)
FIGURE 143 CHINA MARKET SHARE ANALYSIS BY END USER (2024)
FIGURE 144 JAPAN MARKET SHARE ANALYSIS BY TYPE (2024)
FIGURE 145 JAPAN MARKET SHARE ANALYSIS BY END USER (2024)
FIGURE 146 INDIA MARKET SHARE ANALYSIS BY TYPE (2024)
FIGURE 147 INDIA MARKET SHARE ANALYSIS BY END USER (2024)
FIGURE 148 SOUTH KOREA MARKET SHARE ANALYSIS BY TYPE (2024)
FIGURE 149 SOUTH KOREA MARKET SHARE ANALYSIS BY END USER (2024)
FIGURE 150 SAUDI ARABIA MARKET SHARE ANALYSIS BY TYPE (2024)
FIGURE 151 SAUDI ARABIA MARKET SHARE ANALYSIS BY END USER (2024)
FIGURE 152 UAE MARKET SHARE ANALYSIS BY TYPE (2024)
FIGURE 153 UAE MARKET SHARE ANALYSIS BY END USER (2024)
FIGURE 154 EGYPT MARKET SHARE ANALYSIS BY TYPE (2024)
FIGURE 155 EGYPT MARKET SHARE ANALYSIS BY END USER (2024)
FIGURE 156 NIGERIA MARKET SHARE ANALYSIS BY TYPE (2024)
FIGURE 157 NIGERIA MARKET SHARE ANALYSIS BY END USER (2024)
FIGURE 158 SOUTH AFRICA MARKET SHARE ANALYSIS BY TYPE (2024)
FIGURE 159 SOUTH AFRICA MARKET SHARE ANALYSIS BY END USER (2024)
FIGURE 160 GERMANY MARKET SHARE ANALYSIS BY TYPE (2024)
FIGURE 161 GERMANY MARKET SHARE ANALYSIS BY END USER (2024)
FIGURE 162 FRANCE MARKET SHARE ANALYSIS BY TYPE (2024)
FIGURE 163 FRANCE MARKET SHARE ANALYSIS BY END USER (2024)
FIGURE 164 UK MARKET SHARE ANALYSIS BY TYPE (2024)
FIGURE 165 UK MARKET SHARE ANALYSIS BY END USER (2024)
FIGURE 166 SPAIN MARKET SHARE ANALYSIS BY TYPE (2024)
FIGURE 167 SPAIN MARKET SHARE ANALYSIS BY END USER (2024)
FIGURE 168 ITALY MARKET SHARE ANALYSIS BY TYPE (2024)
FIGURE 169 ITALY MARKET SHARE ANALYSIS BY END USER (2024)
FIGURE 170 BRAZIL MARKET SHARE ANALYSIS BY TYPE (2024)
FIGURE 171 BRAZIL MARKET SHARE ANALYSIS BY END USER (2024)
FIGURE 172 ARGENTINA MARKET SHARE ANALYSIS BY TYPE (2024)
FIGURE 173 ARGENTINA MARKET SHARE ANALYSIS BY END USER (2024)
FIGURE 174 COLUMBIA MARKET SHARE ANALYSIS BY TYPE (2024)
FIGURE 175 COLUMBIA MARKET SHARE ANALYSIS BY END USER (2024)
FIGURE 176 GLOBAL CHLORINE GAS CURRENT AND FUTURE MARKET KEY COUNTRY LEVEL ANALYSIS, 2024–2034, (USD MILLION)
FIGURE 177 FINANCIAL OVERVIEW:
Key Player Analysis
Olin Corporation: Olin is a leader with the largest chlor‑alkali capacity globally, underpinning strong chlorine and caustic availability across North America and select export markets. Chlor Alkali Products and Vinyls sales reached 953.7 million dollars in Q4 2024, with the segment representing 55 percent of 2024 company sales, highlighting material exposure to ECU pricing and downstream vinyls demand.
The company is executing a technology shift and network optimization. It plans to shut 450,000 ECU of asbestos diaphragm capacity in Freeport tied to Dow’s PO unit, has already shut diaphragm assets in McIntosh, and is transitioning Plaquemine to non‑asbestos technology, aligning with regulatory and energy efficiency trends in 2025. Operational resilience improved after lifting a systemwide force majeure on chlor‑alkali in August 2024 following Hurricane Beryl disruptions, with chlorine, caustic soda, and vinyls production restored, which supports customer supply assurance into 2025.
Occidental Petroleum Corporation (OxyChem): OxyChem is a leader in the U.S. chlorine chain with integrated chlor‑alkali, VCM, and PVC under OxyVinyls, supported by 685 million dollars of 2024 capital expenditures to sustain and upgrade assets. The company has advanced a 1.1 billion dollar overhaul and expansion of the Battleground Deer Park chlor‑alkali complex, including new membrane cell capacity and associated upgrades, while earlier network rationalization included shutting the Niagara Falls chlor‑alkali plant in 2021, improving cost positioning and environmental compliance.
Management maintains a stable demand view into 2025 across key end‑uses while monitoring import pressure in vinyls; China’s share of global PVC trade rose to roughly 30 percent in 2024, shaping U.S. chlorine derivative flows and ECU dynamics. The Deer Park investment modernizes chlorine and caustic production with membrane technology and site infrastructure, which positions OxyChem to improve reliability and cost efficiency in a tighter sustainability and regulatory environment.
INEOS (INEOS Inovyn): INEOS Inovyn is a leader in Europe’s chlorine and caustic market and has launched an Ultra Low Carbon chlor‑alkali range cutting the carbon footprint of chlorine, caustic soda, and caustic potash by up to 70 percent versus industry averages. The portfolio is certified under ISCC PLUS and draws on renewable power at Rafnes and Antwerp, supporting customer scope 3 reductions and meeting 2025 procurement criteria for lower‑carbon feedstocks.
INEOS reports its standard chlor‑alkali products already carry approximately 30 percent lower greenhouse gas emissions than the European average, widening the gap with the Ultra Low Carbon range in market segments that reward verified footprint reductions. This sustainability‑anchored product strategy differentiates INEOS in contract negotiations and tenders for pulp and paper, alumina, and PVC chains where verified emissions data is now material to purchasing.
Hanwha Group: Hanwha Solutions’ Chemical Division is a challenger with South Korea’s No. 1 market share in chlorine and caustic soda, supported by large integrated assets at Yeosu and Ulsan across CA, VCM, and PVC. The Yeosu site has 873 thousand tons per year of caustic soda capacity and 460 thousand tons per year of PVC; utilization was trimmed by 10 percent in January 2024 to balance market conditions, demonstrating disciplined supply management.
The company is aligning product credentials with international standards; Hanwha reported ISCC PLUS recognition for ten products including caustic soda, improving downstream acceptance in export markets focused on certified inputs. Short‑term operating discipline, domestic leadership in CA, and a PVC‑backed chlorine outlet provide differentiation as regional trade flows shift in 2025.
Market Key Players
BASF SE
Tata Chemicals Limited
Covestro AG
Occidental Petroleum Corporation
Hanwha Group
Ercros
Aditya Birla Chemicals Pvt. Ltd.
Olin Corporation
Tosoh Corporation
Grasim Industries Limited
Gujarat Fluorochemicals (GFL)
INEOS
Xinjiang Zhongtai Chemicals Co. Ltd.
Westlake Corporation
PPG Industries
Driver:
Food Safety Standards Sustain Chlorine Demand Across Processing Chains
Food safety programs in 2025 keep chlorine in daily operations across processing, cold-chain, and facility sanitation. Plants use 50 to 200 ppm chlorine solutions on food-contact surfaces. Large processors standardize on validated kill steps to meet HACCP and retailer audits. Global packaged food output grows at 4 to 5% annually, which lifts demand for disinfection chemicals. The market benefits from multi-site rollouts by leading processors in North America, Europe, and Asia. This anchors baseline volumes even when construction-linked PVC demand softens.
For you, the strategic impact is predictable offtake and multi-year contracts. Disinfection budgets scale with throughput, not commodity cycles. Expect mid single-digit volume growth in food and beverage sanitation through 2030. This underpins the market’s 5.5% CAGR to 2034 and supports capacity utilization for integrated chlor-alkali sites.
Restraint:
Regulatory Scrutiny and By-Product Controls Increase Cost Burden
Environmental and health scrutiny raises compliance costs and limits transport flexibility. Formation of disinfection by-products such as trihalomethanes drives tighter limits in potable water and sensitive applications. Operators must invest in scrubbers, monitors, and emergency systems. Safety and environmental upgrades can add USD 20 to 40 per ton in operating costs in strict jurisdictions. Chlorine’s hazard profile also curtails long-haul shipments, which forces producers to co-locate with downstream users or convert output to derivatives.
Safety Compliance and Localization Reshape Competitive Positioning
Strategically, you face narrower accessible markets and higher fixed costs. Plants with weaker safety systems risk curtailed rates or shutdowns during audits. European energy volatility and past incidents have already pushed capacity rationalization. Compliance strength, on-site conversion to hypochlorite, and proximity to demand centers now shape competitive position more than headline nameplate capacity.
Opportunity:
Emerging-Market Water Treatment Programs Drive Structural Growth
Emerging-market water programs create a durable growth lane. Asia and the Middle East expand municipal disinfection, reuse, and desalination at 6 to 8% CAGRs through 2030. APAC alone held 43.4% revenue share in 2024 and is tracking toward the high 40s as utilities scale treatment plants. Over 2 billion people still lack safely managed drinking water. Governments are funding chlorination as a fast, proven intervention while broader infrastructure builds out.
Integrated Supply and Service Models Unlock Long-Term Contracts
This opens bankable supply agreements and room for greenfield chlor-alkali tied to water hubs. You can target bundled offerings that include chlorine supply, on-site hypochlorite generation, dosing control, and service. Expected awards in India, GCC, and Southeast Asia support multi-year visibility. Suppliers that pair chemical delivery with uptime guarantees will capture share and price premiums.
Membrane-cell adoption accelerates as producers chase lower energy intensity and cleaner profiles. Global membrane penetration is approaching 75 to 80% of capacity in 2025. Plants report 15 to 25% energy reductions versus older diaphragm units, to roughly 2,200 to 2,500 kWh per ton. Leaders such as Olin, Westlake, INEOS Inovyn, Shin-Etsu, Tosoh, and Grasim advance debottlenecking and cell upgrades while signing renewable PPAs to stabilize power costs.
The strategic result is a two-tier cost curve. Efficient membrane sites with reliable power run harder and win long contracts with PVC and water customers. Legacy assets face higher unit costs and rising compliance burdens. Expect continued closures or conversions in Europe and selective expansions in energy-advantaged regions, including the U.S. Gulf Coast, India, and the Middle East.
Recent Developments
Dec 2024 – Olin Corporation: Announced closure of legacy diaphragm chlor‑alkali capacity tied to Dow’s Freeport PO unit, with retirement of approximately ~XX ECU and migration toward membrane assets in 2025. The move tightens older, higher‑cost capacity and supports mix shift to lower‑emission production, improving margin quality into 2025.
Jan 2025 – Olin Corporation: Reported Q4 2024 results and reaffirmed a chlorine‑optionality strategy for 2025; segment performance and pricing discipline indicate 2024 Chlor Alkali Products and Vinyls sales above USD XX billion with targeted network optimization. You gain greater supply assurance as Olin exits higher‑cost diaphragm units and reallocates volumes to more efficient sites.
May 2025 – Occidental Petroleum (OxyChem): Maintained 2025 demand estimates for chlorine derivatives and caustic while monitoring import pressure in vinyls; management signaled steady operating rates under current market conditions. Stable guidance underpins asset utilization and supports planning for your downstream chlorine derivative needs.
Aug 2025 – INEOS Inovyn: Published its 2024 review and highlighted commercialization of Ultra Low Carbon chlor‑alkali grades; standard products carry roughly 30 percent lower GHG than the European average and Ultra Low Carbon grades cut footprints by up to 70 percent, with 2025 tenders citing certified metrics. This strengthens low‑carbon positioning in Europe and helps your procurement teams meet scope 3 targets with verified data.
Oct 2025 – Occidental Petroleum (OxyChem): Broke ground on the now‑approved USD 1.1 billion “Project Redstone” overhaul at Deer Park, adding new membrane cells and reliability upgrades with phased start‑up expected from 2026. The project modernizes a core U.S. chlorine hub, lowers unit costs, and expands OxyChem’s competitiveness in merchant caustic and integrated vinyls for your supply base.