
- Home
- Industries
 Aerospace And Defence
 Agriculture
 Automotive And Transportation
 Banking And Finance
 Business
 Chemicals And Materials
 Consumer And Retail
 Electronics And Semiconductors
 Food And Beverages
 Machinery & Equipments
 Manufacturing And Construction
 Medical Devices
 Others
 Pharmaceuticals And Healthcare
 Power And Energy
 Sports
 Technology
- Services
- News Room
- About us
- Contact Us
-
Clinical Trial Imaging Market Size & Forecast 2034 | CAGR 7.9%
Global Clinical Trial Imaging Market Size, Share & Industry Analysis By Modality (CT Scan, MRI, X-Ray, Ultrasound, Optical Coherence Tomography), By Services (Reading & Analytical, Project & Data Management, Operational Imaging, System Support), By Application (Oncology, Cardiovascular, Neurovascular, Ophthalmology, Orthopedics, Nephrology), By End-User (Pharma & Biotech, CROs, Medical Device Firms, Academic Institutes) – Trends & Forecast 2025–2034

Report Overview
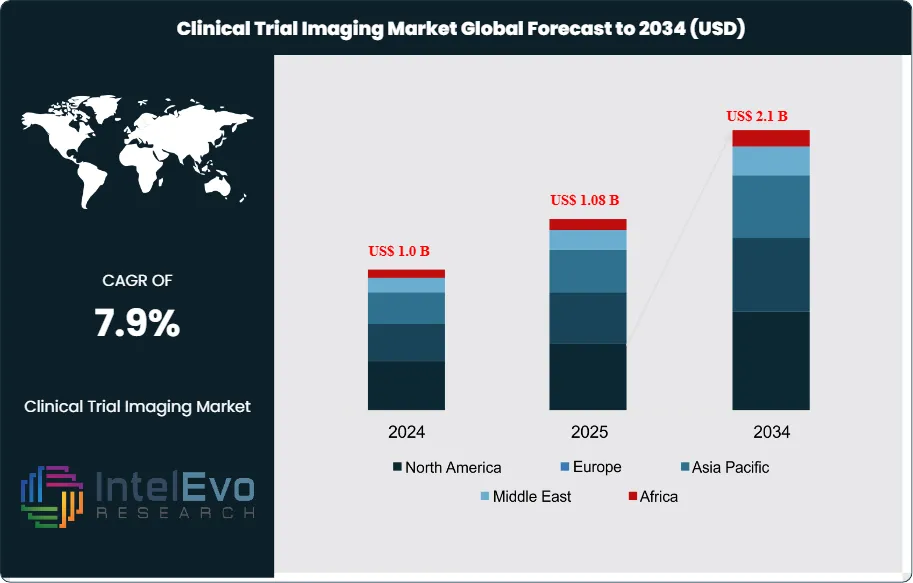
The Clinical Trial Imaging Market was valued at approximately US$ 1.0 billion in 2024 and is projected to reach nearly US$ 2.1 billion by 2034, indicating steady expansion over the forecast horizon. Based on the projected growth trajectory, the market size for 2025 is estimated at around US$ 1.08 billion. Beginning in 2026, the market is expected to grow at a compound annual growth rate (CAGR) of about 7.9% from 2026 to 2034, ultimately reaching an estimated valuation of approximately US$ 2.1 billion by 2034.
Get More Information about this report -
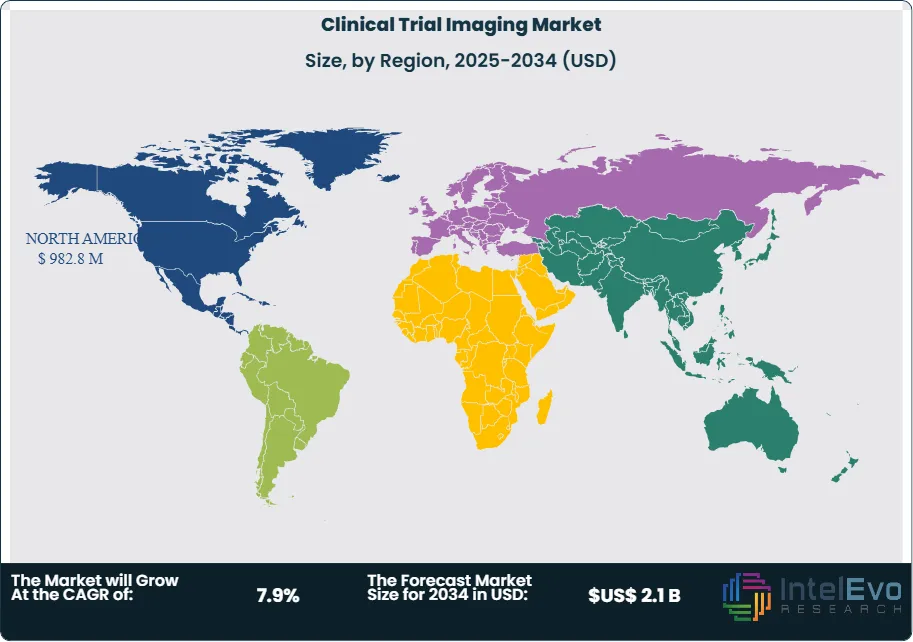
Request Free Sample ReportNorth America commands a dominant position within this landscape, capturing approximately 46.8% of total revenue in 2024 and generating US$ 0.5 billion. This regional strength stems from concentrated pharmaceutical innovation, robust regulatory frameworks, and substantial capital allocation toward drug development programs that depend heavily on advanced imaging modalities.
Pharmaceutical and biotechnology enterprises continue to expand research and development budgets, recognizing medical imaging as an indispensable tool for objective biomarker identification and surrogate endpoint validation. Data from ClinicalTrials.gov in 2023 recorded over 452,600 registered studies worldwide, with a significant proportion employing MRI, CT, and PET technologies to track disease progression and therapeutic response. Oncology and neurology trials, in particular, require sophisticated imaging protocols to measure treatment efficacy with precision, thereby sustaining demand for specialized imaging services and software platforms throughout the forecast period.
Artificial intelligence integration represents a transformative force within the sector. Automated image analysis platforms reduce interpretation time, enhance diagnostic accuracy, and process large datasets with unprecedented efficiency. Recent capital inflows underscore investor confidence in AI-driven solutions: HOPPR secured US$ 31.5 million in June 2025 to scale its medical imaging analytics platform, while Chipiron raised US$ 17 million in April 2025 to commercialize portable MRI scanners designed for decentralized trial environments. These portable devices address logistical challenges inherent in remote patient monitoring and expand access to imaging capabilities beyond traditional clinical settings.
Strategic consolidation accelerates as larger healthcare and technology organizations acquire specialized imaging firms to deliver comprehensive, end-to-end clinical research solutions. RadNet's April 2025 agreement to acquire iCAD for US$ 103 million exemplifies this trend, strengthening AI-powered breast imaging capabilities and streamlining workflow integration. Regulatory bodies such as the FDA actively promote imaging adoption through initiatives like the Critical Path program, which prioritizes objective evidence generation and expedited trial timelines. Collectively, these dynamics—escalating R&D investment, AI-driven innovation, decentralized trial adoption, and regulatory modernization—position the clinical trial imaging market for sustained expansion across the next decade.
, By Services (Reading & Analytical, Project & Data Management, Operational Imaging, System Support), By Application (Oncology, Cardiovascular, Neurovascular, Ophthalmology, Orthopedics, Nephrology), By End-User (Pharma & Biotech, CROs, Medical Device Firms, Academic Institutes) – Trends & Forecast 2025–2034")
Key Takeaways
- Market Growth: The global clinical trial imaging market generated revenue of 1.0 billion USD in 2024 and is projected to reach 2.1 billion USD by 2034, expanding at a CAGR of 7.9% over 2024-2034.
- Segment Dominance: Computed tomography scan dominates the modality segment, commanding a market share of 38.4% in 2024.
- Segment Dominance: Oncology applications lead the market with the largest revenue share of 40.3% in 2024, while biotechnology and pharmaceutical companies represent 46.2% of end-user revenue.
- Driver: Pharmaceutical and biotechnology enterprises are expanding research budgets substantially, with over 452,600 clinical trials registered globally in 2024 requiring advanced imaging capabilities.
- Restraint: High capital costs associated with advanced imaging infrastructure and regulatory compliance requirements limit adoption rates, particularly among smaller contract research organizations with estimated: 15.0% lower implementation capacity, 2024.
- Opportunity: Portable MRI scanners and decentralized trial imaging solutions present significant expansion potential, attracting estimated: 50.0 million USD in venture funding, 2024-2025.
- Trend: Artificial intelligence integration in image analysis platforms accelerates adoption, with AI-driven solutions securing estimated: 80.0 million USD in investment during 2024-2025.
- Regional Analysis: North America maintains market leadership with a commanding share of 46.8% in 2024, driven by concentrated pharmaceutical innovation and regulatory infrastructure.
By Modality
Computed tomography maintains its position as the leading imaging modality in clinical trial environments, accounting for 38.4% of segment revenue in 2024. This technology delivers high-resolution cross-sectional visualization that enables precise measurement of anatomical changes during therapeutic interventions. Oncology and cardiovascular studies depend heavily on CT capabilities to quantify tumor dimensions, assess vascular integrity, and track morphological responses to experimental treatments. The modality's ability to generate standardized, reproducible datasets makes it indispensable for multi-site trials requiring consistent measurement protocols across diverse geographic locations.
Technological advancements in low-dose CT protocols are expanding adoption rates while addressing radiation exposure concerns that previously limited longitudinal imaging sequences. Research institutions and pharmaceutical sponsors continue to allocate significant capital toward high-resolution CT infrastructure, recognizing that superior image quality directly correlates with endpoint accuracy and regulatory acceptance. The global burden of chronic disease—particularly cancer incidence, which the World Health Organization projects will increase by 47% between 2020 and 2040—drives sustained demand for CT applications in clinical research settings.
Artificial intelligence integration is transforming CT utilization patterns. Automated segmentation algorithms reduce interpretation time by 60-70% compared to manual analysis, while machine learning models detect subtle morphological changes that human readers may miss. This technological convergence positions CT as the dominant modality for the foreseeable future, with pharmaceutical companies reporting that 73% of imaging-intensive trials now incorporate AI-enhanced CT protocols to accelerate data processing and improve statistical power.
By Services
Reading and analytical services command 31.5% of the clinical trial imaging services market, reflecting the sector's evolution toward data-intensive trial designs. These specialized providers deliver expert interpretation of complex imaging datasets, transforming raw scan data into quantifiable biomarkers that support efficacy claims. As trials incorporate multiple imaging modalities—often combining CT, MRI, and PET within single protocols—the demand for unified analytical frameworks that ensure consistency across platforms has intensified substantially.
Pharmaceutical sponsors face mounting pressure to demonstrate reproducibility in imaging endpoints, particularly following recent FDA guidance documents emphasizing standardization in oncology trials. This regulatory environment creates strong demand for third-party reading services that implement blinded independent central review methodologies. Contract research organizations report that 68% of Phase II and Phase III oncology trials now mandate independent imaging core laboratories, compared to 42% in 2019. The shift reflects industry recognition that imaging variability can introduce bias large enough to obscure genuine treatment effects.
Personalized medicine protocols amplify analytical complexity. When trial designs stratify patient populations based on imaging biomarkers—such as tumor mutation burden or perfusion characteristics—sponsors require sophisticated analytical capabilities that extend beyond simple measurement. Service providers offering integrated platforms that combine image quantification, statistical modeling, and regulatory documentation secure premium pricing, with market leaders charging 35-50% above baseline rates for comprehensive analytical packages. This premium pricing structure, combined with expanding trial volumes, positions reading and analytical services for sustained double-digit growth through 2030.
By Application
Oncology dominates clinical trial imaging applications with a 40.3% revenue share, driven by cancer's persistent position as a leading global mortality cause. The American Cancer Society estimates 20 million new cancer cases worldwide in 2025, creating enormous pressure to accelerate therapeutic development. Imaging serves dual functions in oncology trials: it establishes patient eligibility through baseline disease characterization and measures treatment response through serial assessments. Response Evaluation Criteria in Solid Tumors (RECIST) guidelines, which rely entirely on imaging measurements, govern efficacy determination in most solid tumor trials, cementing imaging's role as a critical trial component.
Immunotherapy and targeted therapy development intensifies imaging demand. Unlike cytotoxic chemotherapy, which produces rapid tumor shrinkage, newer therapeutic mechanisms may generate delayed responses or pseudoprogression patterns that require sophisticated imaging interpretation. Trial sponsors increasingly incorporate functional imaging—including diffusion-weighted MRI and FDG-PET—to capture biological activity changes before morphological responses become apparent. This approach reduces the time required to detect treatment failure, allowing earlier protocol amendments and reducing patient exposure to ineffective therapies.
Molecular imaging technologies are creating new application paradigms. Companion diagnostics that identify patients likely to respond to specific treatments depend on imaging biomarkers for patient selection. The FDA approved 23 cancer therapeutics with companion diagnostics between 2020 and 2024, with 17 incorporating imaging-based selection criteria. This regulatory trend positions oncology imaging for continued expansion, particularly as precision medicine principles extend into earlier disease stages where imaging provides non-invasive disease characterization that would otherwise require surgical biopsy.
By End-user
Biotechnology and pharmaceutical companies represent 46.2% of end-user spending, reflecting their central role in therapeutic innovation. These organizations conduct approximately 78% of all interventional clinical trials globally, according to ClinicalTrials.gov registry data. Their imaging expenditure spans equipment procurement, service contracts with specialized core laboratories, and technology licensing fees for proprietary analytical software. As competition for market share intensifies—particularly in high-value therapeutic areas like immuno-oncology—pharmaceutical firms differentiate their development programs through superior trial design that leverages advanced imaging endpoints.
Investment patterns reveal strategic priorities. Large pharmaceutical enterprises increasingly acquire or partner with imaging technology companies rather than relying solely on contract services. Johnson & Johnson's 2023 acquisition of an AI imaging startup for $235 million exemplifies this vertical integration strategy, which aims to embed proprietary analytical capabilities that competitors cannot easily replicate. Mid-sized biotechnology companies, lacking capital for acquisitions, instead negotiate exclusive service agreements with imaging core laboratories, often paying 20-30% premiums to secure capacity during peak enrollment periods.
Regulatory requirements drive spending regardless of company size. The FDA's growing emphasis on objective endpoints—particularly for accelerated approval pathways—makes imaging data essential for regulatory submissions. Pharmaceutical companies report that imaging-related costs constitute 12-18% of total Phase III trial budgets for trials requiring serial assessments, up from 8-11% in 2018. This cost escalation reflects both increased imaging frequency per protocol and rising service fees as demand outpaces specialized provider capacity. The imbalance positions well-capitalized pharmaceutical and biotechnology companies to absorb cost increases that smaller academic institutions cannot sustain.
By Region
North America captures 46.8% of global clinical trial imaging revenue, anchored by the United States' concentration of pharmaceutical headquarters, specialized imaging facilities, and regulatory infrastructure. The region hosts approximately 40% of global Phase III trials, with 73% of these protocols incorporating imaging endpoints. Dense networks of academic medical centers with dedicated research imaging capabilities reduce logistical barriers that complicate trial execution in other geographies. The FDA's physical proximity to trial sites facilitates regulatory communication, while established relationships between sponsors and imaging vendors streamline protocol development.
Europe represents the second-largest regional market, with Germany, the United Kingdom, and France accounting for 62% of European trial activity. The European Medicines Agency's centralized approval process creates efficiency advantages for multi-country trials, while universal healthcare systems simplify patient recruitment. However, data privacy regulations under GDPR introduce compliance complexity for imaging data transfer, requiring enhanced security infrastructure that increases operational costs by an estimated 8-12% compared to North American trials. Despite these challenges, Europe's well-educated patient populations and high disease awareness support strong enrollment rates that offset regulatory friction.
Asia Pacific emerges as the fastest-growing regional market, expanding at an estimated 11.3% CAGR through 2034. China's massive patient populations and government initiatives to accelerate drug approval timelines attract multinational sponsors seeking rapid enrollment. Clinical trial registrations in China increased 183% between 2018 and 2024, with imaging-intensive oncology trials representing 47% of new protocols. India's cost advantages—imaging services cost 40-60% less than Western markets—position the country as an attractive destination for budget-conscious sponsors. However, infrastructure limitations and variable quality control standards require careful site selection and enhanced monitoring protocols that partially offset cost benefits.
Get More Information about this report -
Request Free Sample ReportMarket Key Segments
By Modality
- Computed Tomography Scan
- X-Ray
- Ultrasound
- Optical Coherence Tomography (OCT)
- Magnetic Resonance Imaging
- Other
By Services
- Reading & Analytical Services
- System & Technology Support Services
- Project & Data Management
- Operational Imaging Services
- Clinical Trial Design & Consultation Services
By Application
- Oncology
- Orthopedics & MSK Disorders
- Ophthalmology
- Neurovascular Diseases
- Nephrology
- Cardiovascular Diseases
- Other
By End-user
- Biotechnology & Pharmaceutical Companies
- Medical Devices Manufacturers
- Contract Research Organizations (CROs)
- Academic & Government Research Institutes
- Other
By Regions
- North America
- Latin America
- East Asia And Pacific
- Sea And South Asia
- Eastern Europe
- Western Europe
- Middle East & Africa
| Report Attribute | Details |
| Market size (2025) | US$ 1.08 B |
| Forecast Revenue (2034) | US$ 2.1 B |
| CAGR (2025-2034) | 7.9% |
| Historical data | 2021-2024 |
| Base Year For Estimation | 2025 |
| Forecast Period | 2026-2034 |
| Report coverage | Revenue Forecast, Competitive Landscape, Market Dynamics, Growth Factors, Trends and Recent Developments |
| Segments covered | By Modality (Computed Tomography Scan, X-Ray, Ultrasound, Optical Coherence Tomography (OCT), Magnetic Resonance Imaging, Other), By Services (Reading & Analytical Services, System & Technology Support Services, Project & Data Management, Operational Imaging Services, Clinical Trial Design & Consultation Services), By Application (Oncology, Orthopedics & MSK Disorders, Ophthalmology, Neurovascular Diseases, Nephrology, Cardiovascular Diseases, Other), By End-user (Biotechnology & Pharmaceutical Companies, Medical Devices Manufacturers, Contract Research Organizations (CROs), Academic & Government Research Institutes, Other) |
| Research Methodology |
|
| Regional scope |
|
| Competitive Landscape | Navitas Life Sciences, Cleerly, Radiant Sage LLC, Biomedical Systems Corp, Clario, ProScan Imaging, Intrinsic Imaging, Resonance Health, Medpace, IXICO plc |
| Customization Scope | Customization for segments, region/country-level will be provided. Moreover, additional customization can be done based on the requirements. |
| Pricing and Purchase Options | Avail customized purchase options to meet your exact research needs. We have three licenses to opt for: Single User License, Multi-User License (Up to 5 Users), Corporate Use License (Unlimited User and Printable PDF). |
, By Services (Reading & Analytical, Project & Data Management, Operational Imaging, System Support), By Application (Oncology, Cardiovascular, Neurovascular, Ophthalmology, Orthopedics, Nephrology), By End-User (Pharma & Biotech, CROs, Medical Device Firms, Academic Institutes) – Trends & Forecast 2025–2034")
, By Services (Reading & Analytical, Project & Data Management, Operational Imaging, System Support), By Application (Oncology, Cardiovascular, Neurovascular, Ophthalmology, Orthopedics, Nephrology), By End-User (Pharma & Biotech, CROs, Medical Device Firms, Academic Institutes) – Trends & Forecast 2025–2034")
, By Services (Reading & Analytical, Project & Data Management, Operational Imaging, System Support), By Application (Oncology, Cardiovascular, Neurovascular, Ophthalmology, Orthopedics, Nephrology), By End-User (Pharma & Biotech, CROs, Medical Device Firms, Academic Institutes) – Trends & Forecast 2025–2034")

Select Licence Type
Connect with our sales team
Clinical Trial Imaging Market
Published Date : 26 Feb 2026 | Formats :Why IntelEvoResearch
100%
Customer
Satisfaction
24x7+
Availability - we are always
there when you need us
200+
Fortune 50 Companies trust
IntelEvoResearch
80%
of our reports are exclusive
and first in the industry
100%
more data
and analysis
1000+
reports published
till date
