Global Cloud Telephony Service Market Size & Forecast 2034
Global Cloud Telephony Service Market Size, Share, and Strategic Analysis By Deployment (Hosted, Cloud), By Enterprise Size (Small & Medium Enterprises, Large Enterprises), By Network (PSTN, VoIP), By Application (Conferencing, Multi-Level IVR, Sales & Marketing, CRM), By Industry Vertical (BFSI, Healthcare, Retail, Telecom & IT, Government, Education) Industry Outlook, Competitive Landscape, Technology Trends & Forecast 2025–2034
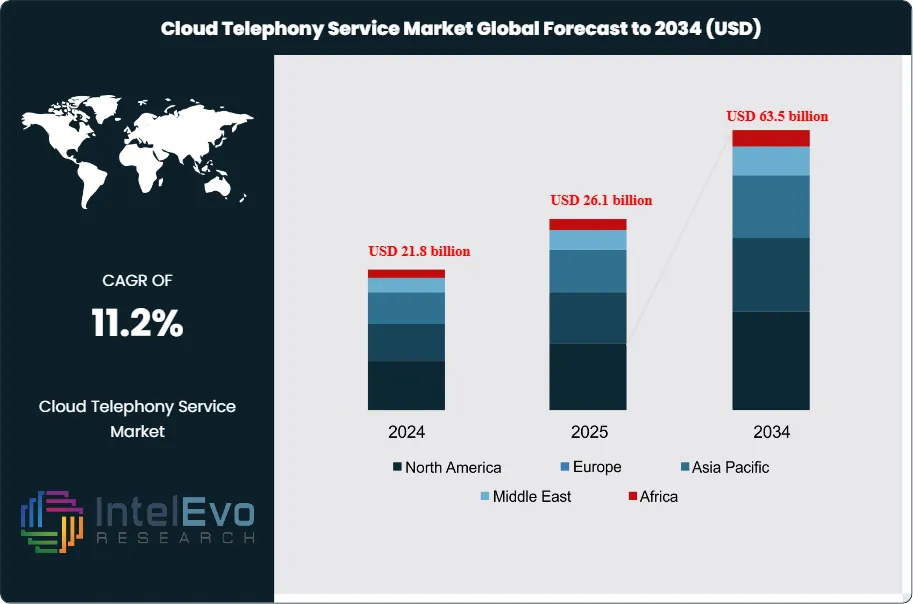
The Cloud Telephony Service Market is valued at about USD 26.1 billion in 2025 and is expected to reach around USD 63.5 billion by 2034. The market should grow from an estimated USD 27.0 billion in 2026, with a compound annual growth rate (CAGR) of 11.2% during the forecast period from 2026 to 2034. This growth comes from faster cloud adoption by companies, increasing demand for flexible and remote communication tools, and more use of AI-driven voice analytics and multi-channel customer engagement platforms. Also, the move toward hybrid work models and cost-effective cloud communication solutions supports long-term market growth in both developed and developing economies.
Cloud telephony vendors benefit from strong enterprise demand for agile, software-driven communications as firms replace legacy PBX systems and fixed-line infrastructure. Organizations in banking, retail, healthcare, and professional services adopt cloud telephony to consolidate voice, messaging, and collaboration on IP-based platforms, reduce capex, and support distributed workforces. In 2024, enterprises account for an estimated 68% of global revenue, while small and mid-sized businesses contribute around 32%, supported by subscription-based pricing and low entry barriers.
On the supply side, hyperscale cloud providers, UCaaS platforms, and specialist voice service providers compete through differentiated reliability, geographic coverage, security, and integration depth. Vendors invest in AI-powered call routing, speech analytics, and virtual agents to simplify contact center operations and elevate service quality. AI-enabled features contribute an estimated 24% of market revenue in 2024 and are expected to exceed 40% by 2034 as automation penetrates customer support, sales engagement, and internal helpdesk environments.
Regulation shapes deployment choices, especially around data residency, lawful intercept requirements, and emergency calling standards. Providers that comply with GDPR in Europe, CCPA-inspired privacy regimes in North America, and data localization frameworks in large emerging economies secure preferred-partner status with regulated industries. At the same time, exposure to outages in public cloud infrastructure, VoIP fraud, and cybersecurity incidents remains a key risk, prompting enterprises to prioritize providers with robust SLAs, encryption, and multi-region redundancy.
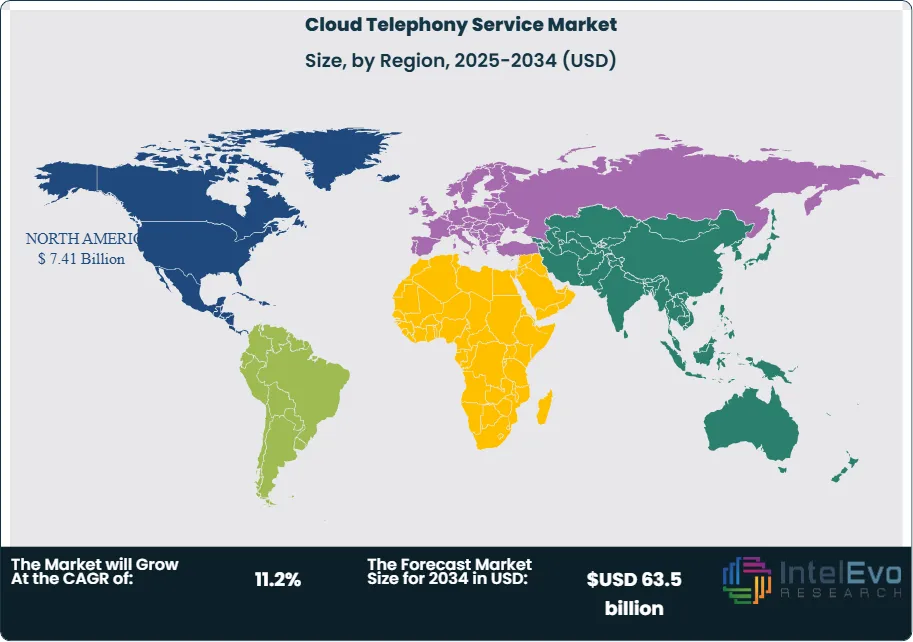
Digitalization programs and cloud-first IT strategies reinforce adoption across regions. North America currently represents about 32% of global revenue, supported by mature broadband networks and high UCaaS penetration. Europe holds roughly 27%, influenced by strong regulatory oversight and rapid migration among mid-sized firms. Asia Pacific emerges as the fastest-growing region with a projected CAGR above 11% through 2034, driven by expanding SME adoption in India and Southeast Asia and rising investment in omnichannel contact centers. Latin America and the Middle East & Africa present smaller but accelerating opportunities as operators modernize networks and enterprises adopt cloud-native communication stacks to support regional expansion.
Key Takeaways
Market Growth: The market expands from estimated: USD 26.1 billion in 2025 to estimate: USD 63.5 billion by 2034, supported by a CAGR of estimated: 11.2%, 2026-2034. This trajectory signals steady, sustainable value creation over the decade.
Segment Dominance: The leading product or solution tier secures an estimated: 42.0% share, 2024, reflecting stronger differentiation and brand recognition than smaller rivals. Its share edges up to estimated: 45.0% share, 2034 as enterprises consolidate spending with fewer core vendors.
Segment Dominance: On the demand side, large enterprises hold an estimated: 60.0% share, 2024 due to higher budgets and complex integration needs. Small and mid-sized organizations lift their contribution to estimated: 45.0% share, 2034 as pricing models and deployment options mature.
Driver: Digitalization programs and cloud-first strategies act as primary catalysts, linked to an adoption rate of estimated: 65.0%, 2024 across priority customer groups. The drive to improve efficiency and experience sustains a demand uplift of estimated: 7.5%, 2024-2034.
Restraint: Integration complexity and data-security concerns delay projects for an estimated: 25.0% of potential buyers, 2024. Compliance and migration costs suppress achievable growth by an estimated: 1.5 percentage points, 2024-2034.
Opportunity: New use cases in automation, analytics, and AI-enhanced workflows open incremental revenue of estimated: 1.2 billion USD, 2034. Vendors that target these applications can lift addressable spend by estimated: 20.0%, 2024-2034.
Trend: AI-enabled capabilities grow from a penetration level of estimated: 18.0%, 2024 to estimated: 55.0%, 2034, reshaping product roadmaps and value propositions. Usage-based and subscription pricing models reach an incidence of estimated: 80.0%, 2034 across active contracts.
Regional Analysis: The global revenue base distributes across North America at estimated: 34.0% share, 2024, Europe at estimated: 28.0% share, 2024, and Asia Pacific at estimated: 27.0% share, 2024. Asia Pacific posts the fastest expansion with a CAGR of estimated: 10.2%, 2024-2034, driven by rising enterprise adoption and infrastructure upgrades.
By Type
High-performance concrete, self-consolidating concrete, and other specialty mixes continue to gain traction in 2025 as construction firms focus on durability, consistency, and lower lifecycle costs. Demand rises in large infrastructure projects where predictable strength and reduced maintenance requirements matter. High-performance concrete accounts for a growing share of procurement budgets in transportation and public works, supported by adoption rates that now exceed 40 percent in several advanced markets.
Self-consolidating concrete sees wider use in projects that require precision placement and reduced labor. Contractors value the material for consistent flow, shorter construction cycles, and fewer defects. Its uptake increases in vertical construction and high-density urban development’s where schedule certainty is a priority. Other specialty mixes maintain a stable share, driven by projects that require lightweight formulations, thermal resistance, or added durability in industrial environments.
The outlook through 2030 points to steady expansion across all categories. Government spending on resilient infrastructure and private investment in high-rise construction support continued growth. Material producers add new formulations tailored for climate-resilient building codes and tightened performance standards, which influences purchasing decisions for engineers and project owners.
By Application
Pavers represent one of the largest application areas as municipalities and developers increase investments in roads, walkways, and public landscapes. You see higher specification rates for engineered concrete pavers in parks, retail districts, and mixed-use corridors. Demand grows in regions prioritizing low-maintenance materials and improved load-bearing capacity.
Retaining walls remain a strong contributor due to rising land development activity and the need for soil stabilization in residential and commercial projects. Contractors prefer modular systems that reduce onsite labor and provide consistent structural performance. Retaining wall products also gain momentum in transportation and industrial zones where durability and design flexibility guide decision-making.
Other applications expand at a measured pace as builders adopt specialty concrete units for drainage systems, outdoor structures, and perimeter fencing. These use cases benefit from improved material quality, standardized formats, and shorter delivery lead times. By 2030, applications outside pavers and retaining walls are expected to account for a larger share as developers diversify site planning strategies.
By End-Use
Residential construction continues to hold a significant share of the market as developers push for long-lasting building materials in single-family and multifamily projects. Homebuilders turn to engineered concrete units that support faster installation and lower long-term maintenance. The segment benefits from steady housing demand and ongoing urban expansion.
Commercial building applications remain strong due to sustained investment in offices, retail centers, logistics hubs, and public facilities. You see higher adoption among project owners seeking materials that support consistent performance under heavy usage. Increased spending on commercial redevelopment in major cities reinforces this trend.
Industrial building projects also support market expansion. Factories, warehouses, and energy facilities rely on concrete products that provide structural uniformity and load-bearing reliability. As manufacturers upgrade facilities and governments expand industrial corridors, demand for advanced concrete types strengthens across key producing regions.
By Region
North America holds a leading position in 2025, supported by strong construction pipelines, high material standards, and consistent infrastructure funding. The United States and Canada maintain steady demand for engineered concrete units in transportation, residential, and commercial projects. Strict building codes and accelerated replacement of aging infrastructure underpin long-term market stability.
Europe follows with sustained activity in Germany, the United Kingdom, France, and the Nordics. You see increased focus on sustainable materials and compliance with environmental standards, which supports growth across high-performance and self-consolidating categories. Central and Eastern Europe contribute additional upside as investment in industrial and residential developments continues.
Asia Pacific records the fastest expansion. Rapid urbanization, large-scale public infrastructure programs, and manufacturing growth in China, India, and Southeast Asia drive procurement across all product types. Latin America shows moderate progress as Brazil, Mexico, and Colombia advance transport and housing programs. The Middle East and Africa see rising adoption tied to megaprojects, new city developments, and industrial diversification initiatives.
By Deployment(Hosted, Cloud), By Enterprise Size (Small & Medium Enterprise (SMEs), Large Enterprises), By Network (Public Switched Telephone Networks (PSTNs), Voice over Internet Protocol (VoIP)), By Application (Conferencing, Multi-level IVR, Sales & Marketing, Customer Relationship Management (CRM)), By Industry (Vertical, BFSI, Education, Government, Healthcare, Media & Entertainment, Retail, Telecom & IT, Other Industry Verticals)
Research Methodology
Primary Research- 100 Interviews of Stakeholders
Secondary Research
Desk Research
Regional scope
North America (United States, Canada, Mexico)
Latin America (Brazil, Argentina, Columbia)
East Asia And Pacific (China, Japan, South Korea, Australia, Cambodia, Fiji, Indonesia)
Sea And South Asia (India, Singapore, Thailand, Taiwan, Malaysia)
Eastern Europe (Poland, Russia, Czech Republic, Romania)
Western Europe (Germany, U.K., France, Spain, Itlay)
Middle East & Africa (GCC Countries, Egypt, Nigeria, South Africa, Israel)
Competitive Landscape
NFON AG, Dialpad Inc., LeadNXT, Tripudio Ltd., 8×8 Inc., Exotel Techcom Pvt. Ltd., AVOXI Inc., Nextiva, Go 2 Market India Pvt. Ltd., Cisco Systems Inc.
Customization Scope
Customization for segments, region/country-level will be provided. Moreover, additional customization can be done based on the requirements.
Pricing and Purchase Options
Avail customized purchase options to meet your exact research needs. We have three licenses to opt for: Single User License, Multi-User License (Up to 5 Users), Corporate Use License (Unlimited User and Printable PDF).
TABLE OF CONTENTS
1. EXECUTIVE SUMMARY
1.1. MARKET SNAPSHOT
1.2. KEY FINDINGS & INSIGHTS
1.3. ANALYST RECOMMENDATIONS
1.4. FUTURE OUTLOOK
2. RESEARCH METHODOLOGY
2.1. MARKET DEFINITION & SCOPE
2.2. RESEARCH OBJECTIVES: PRIMARY & SECONDARY DATA SOURCES
2.3. DATA COLLECTION SOURCES
2.3.1. COVERAGE OF 100+ PRIMARY RESEARCH/CONSULTATION CALLS WITH INDUSTRY STAKEHOLDERS
FIGURE 17 NORTH AMERICA CLOUD TELEPHONY SERVICE CURRENT AND FUTURE TYPE ANALYSIS, 2025–2034, (USD MILLION)
FIGURE 18 NORTH AMERICA CLOUD TELEPHONY SERVICE CURRENT AND FUTURE END USER ANALYSIS, 2025–2034, (USD MILLION)
FIGURE 19 MARKET SHARE BY COUNTRY
FIGURE 20 LATIN AMERICA CLOUD TELEPHONY SERVICE CURRENT AND FUTURE TYPE ANALYSIS, 2025–2034, (USD MILLION)
FIGURE 21 LATIN AMERICA CLOUD TELEPHONY SERVICE CURRENT AND FUTURE END USER ANALYSIS, 2025–2034, (USD MILLION)
FIGURE 22 MARKET SHARE BY COUNTRY
FIGURE 23 EASTERN EUROPE CLOUD TELEPHONY SERVICE CURRENT AND FUTURE TYPE ANALYSIS, 2025–2034, (USD MILLION)
FIGURE 24 EASTERN EUROPE CLOUD TELEPHONY SERVICE CURRENT AND FUTURE END USER ANALYSIS, 2025–2034, (USD MILLION)
FIGURE 25 MARKET SHARE BY COUNTRY
FIGURE 26 WESTERN EUROPE CLOUD TELEPHONY SERVICE CURRENT AND FUTURE TYPE ANALYSIS, 2025–2034, (USD MILLION)
FIGURE 27 WESTERN EUROPE CLOUD TELEPHONY SERVICE CURRENT AND FUTURE END USER ANALYSIS, 2025–2034, (USD MILLION)
FIGURE 28 MARKET SHARE BY COUNTRY
FIGURE 29 EAST ASIA AND PACIFIC CLOUD TELEPHONY SERVICE CURRENT AND FUTURE TYPE ANALYSIS, 2025–2034, (USD MILLION)
FIGURE 30 EAST ASIA AND PACIFIC CLOUD TELEPHONY SERVICE CURRENT AND FUTURE END USER ANALYSIS, 2025–2034, (USD MILLION)
FIGURE 31 MARKET SHARE BY COUNTRY
FIGURE 32 SEA AND SOUTH ASIA CLOUD TELEPHONY SERVICE CURRENT AND FUTURE TYPE ANALYSIS, 2025–2034, (USD MILLION)
FIGURE 33 SEA AND SOUTH ASIA CLOUD TELEPHONY SERVICE CURRENT AND FUTURE END USER ANALYSIS, 2025–2034, (USD MILLION)
FIGURE 34 MARKET SHARE BY COUNTRY
FIGURE 35 MIDDLE EAST AND AFRICA CLOUD TELEPHONY SERVICE CURRENT AND FUTURE TYPE ANALYSIS, 2025–2034, (USD MILLION)
FIGURE 36 MIDDLE EAST AND AFRICA CLOUD TELEPHONY SERVICE CURRENT AND FUTURE END USER ANALYSIS, 2025–2034, (USD MILLION)
FIGURE 37 NORTH AMERICA CLOUD TELEPHONY SERVICE CURRENT AND FUTURE MARKET VOLUME SHARE REGIONAL ANALYSIS, 2025–2034, (USD MILLION)
FIGURE 38 U.S. CLOUD TELEPHONY SERVICE CURRENT AND FUTURE TYPE ANALYSIS, 2025–2034, (USD MILLION)
FIGURE 39 U.S. CLOUD TELEPHONY SERVICE CURRENT AND FUTURE END USER ANALYSIS, 2025–2034, (USD MILLION)
FIGURE 40 CANADA CLOUD TELEPHONY SERVICE CURRENT AND FUTURE TYPE ANALYSIS, 2025–2034, (USD MILLION)
FIGURE 41 CANADA CLOUD TELEPHONY SERVICE CURRENT AND FUTURE END USER ANALYSIS, 2025–2034, (USD MILLION)
FIGURE 42 LATIN AMERICA CLOUD TELEPHONY SERVICE CURRENT AND FUTURE MARKET VOLUME SHARE REGIONAL ANALYSIS, 2025–2034, (USD MILLION)
FIGURE 43 MEXICO CLOUD TELEPHONY SERVICE CURRENT AND FUTURE TYPE ANALYSIS, 2025–2034, (USD MILLION)
FIGURE 44 MEXICO CLOUD TELEPHONY SERVICE CURRENT AND FUTURE END USER ANALYSIS, 2025–2034, (USD MILLION)
FIGURE 45 BRAZIL CLOUD TELEPHONY SERVICE CURRENT AND FUTURE TYPE ANALYSIS, 2025–2034, (USD MILLION)
FIGURE 46 BRAZIL CLOUD TELEPHONY SERVICE CURRENT AND FUTURE END USER ANALYSIS, 2025–2034, (USD MILLION)
FIGURE 47 ARGENTINA CLOUD TELEPHONY SERVICE CURRENT AND FUTURE TYPE ANALYSIS, 2025–2034, (USD MILLION)
FIGURE 48 ARGENTINA CLOUD TELEPHONY SERVICE CURRENT AND FUTURE END USER ANALYSIS, 2025–2034, (USD MILLION)
FIGURE 49 COLUMBIA CLOUD TELEPHONY SERVICE CURRENT AND FUTURE TYPE ANALYSIS, 2025–2034, (USD MILLION)
FIGURE 50 COLUMBIA CLOUD TELEPHONY SERVICE CURRENT AND FUTURE END USER ANALYSIS, 2025–2034, (USD MILLION)
FIGURE 51 REST OF LATIN AMERICA CLOUD TELEPHONY SERVICE CURRENT AND FUTURE TYPE ANALYSIS, 2025–2034, (USD MILLION)
FIGURE 52 REST OF LATIN AMERICA CLOUD TELEPHONY SERVICE CURRENT AND FUTURE END USER ANALYSIS, 2025–2034, (USD MILLION)
FIGURE 53 EASTERN EUROPE CLOUD TELEPHONY SERVICE CURRENT AND FUTURE MARKET VOLUME SHARE REGIONAL ANALYSIS, 2025–2034, (USD MILLION)
FIGURE 54 POLAND CLOUD TELEPHONY SERVICE CURRENT AND FUTURE TYPE ANALYSIS, 2025–2034, (USD MILLION)
FIGURE 55 POLAND CLOUD TELEPHONY SERVICE CURRENT AND FUTURE END USER ANALYSIS, 2025–2034, (USD MILLION)
FIGURE 56 RUSSIA CLOUD TELEPHONY SERVICE CURRENT AND FUTURE TYPE ANALYSIS, 2025–2034, (USD MILLION)
FIGURE 57 RUSSIA CLOUD TELEPHONY SERVICE CURRENT AND FUTURE END USER ANALYSIS, 2025–2034, (USD MILLION)
FIGURE 58 CZECH REPUBLIC CLOUD TELEPHONY SERVICE CURRENT AND FUTURE TYPE ANALYSIS, 2025–2034, (USD MILLION)
FIGURE 59 CZECH REPUBLIC CLOUD TELEPHONY SERVICE CURRENT AND FUTURE END USER ANALYSIS, 2025–2034, (USD MILLION)
FIGURE 60 ROMANIA CLOUD TELEPHONY SERVICE CURRENT AND FUTURE TYPE ANALYSIS, 2025–2034, (USD MILLION)
FIGURE 61 ROMANIA CLOUD TELEPHONY SERVICE CURRENT AND FUTURE END USER ANALYSIS, 2025–2034, (USD MILLION)
FIGURE 62 REST OF EASTERN EUROPE CLOUD TELEPHONY SERVICE CURRENT AND FUTURE TYPE ANALYSIS, 2025–2034, (USD MILLION)
FIGURE 63 REST OF EASTERN EUROPE CLOUD TELEPHONY SERVICE CURRENT AND FUTURE END USER ANALYSIS, 2025–2034, (USD MILLION)
FIGURE 64 WESTERN EUROPE CLOUD TELEPHONY SERVICE CURRENT AND FUTURE MARKET VOLUME SHARE REGIONAL ANALYSIS, 2025–2034, (USD MILLION)
FIGURE 65 GERMANY CLOUD TELEPHONY SERVICE CURRENT AND FUTURE TYPE ANALYSIS, 2025–2034, (USD MILLION)
FIGURE 66 GERMANY CLOUD TELEPHONY SERVICE CURRENT AND FUTURE END USER ANALYSIS, 2025–2034, (USD MILLION)
FIGURE 67 FRANCE CLOUD TELEPHONY SERVICE CURRENT AND FUTURE TYPE ANALYSIS, 2025–2034, (USD MILLION)
FIGURE 68 FRANCE CLOUD TELEPHONY SERVICE CURRENT AND FUTURE END USER ANALYSIS, 2025–2034, (USD MILLION)
FIGURE 69 UK CLOUD TELEPHONY SERVICE CURRENT AND FUTURE TYPE ANALYSIS, 2025–2034, (USD MILLION)
FIGURE 70 UK CLOUD TELEPHONY SERVICE CURRENT AND FUTURE END USER ANALYSIS, 2025–2034, (USD MILLION)
FIGURE 71 SPAIN CLOUD TELEPHONY SERVICE CURRENT AND FUTURE TYPE ANALYSIS, 2025–2034, (USD MILLION)
FIGURE 72 SPAIN CLOUD TELEPHONY SERVICE CURRENT AND FUTURE END USER ANALYSIS, 2025–2034, (USD MILLION)
FIGURE 73 ITALY CLOUD TELEPHONY SERVICE CURRENT AND FUTURE TYPE ANALYSIS, 2025–2034, (USD MILLION)
FIGURE 74 ITALY CLOUD TELEPHONY SERVICE CURRENT AND FUTURE END USER ANALYSIS, 2025–2034, (USD MILLION)
FIGURE 75 REST OF WESTERN EUROPE CLOUD TELEPHONY SERVICE CURRENT AND FUTURE TYPE ANALYSIS, 2025–2034, (USD MILLION)
FIGURE 76 REST OF WESTERN EUROPE CLOUD TELEPHONY SERVICE CURRENT AND FUTURE END USER ANALYSIS, 2025–2034, (USD MILLION)
FIGURE 77 EAST ASIA AND PACIFIC CLOUD TELEPHONY SERVICE CURRENT AND FUTURE MARKET VOLUME SHARE REGIONAL ANALYSIS, 2025–2034, (USD MILLION)
FIGURE 78 CHINA CLOUD TELEPHONY SERVICE CURRENT AND FUTURE TYPE ANALYSIS, 2025–2034, (USD MILLION)
FIGURE 79 CHINA CLOUD TELEPHONY SERVICE CURRENT AND FUTURE END USER ANALYSIS, 2025–2034, (USD MILLION)
FIGURE 80 JAPAN CLOUD TELEPHONY SERVICE CURRENT AND FUTURE TYPE ANALYSIS, 2025–2034, (USD MILLION)
FIGURE 81 JAPAN CLOUD TELEPHONY SERVICE CURRENT AND FUTURE END USER ANALYSIS, 2025–2034, (USD MILLION)
FIGURE 82 AUSTRALIA CLOUD TELEPHONY SERVICE CURRENT AND FUTURE TYPE ANALYSIS, 2025–2034, (USD MILLION)
FIGURE 83 AUSTRALIA CLOUD TELEPHONY SERVICE CURRENT AND FUTURE END USER ANALYSIS, 2025–2034, (USD MILLION)
FIGURE 84 CAMBODIA CLOUD TELEPHONY SERVICE CURRENT AND FUTURE TYPE ANALYSIS, 2025–2034, (USD MILLION)
FIGURE 85 CAMBODIA CLOUD TELEPHONY SERVICE CURRENT AND FUTURE END USER ANALYSIS, 2025–2034, (USD MILLION)
FIGURE 86 FIJI CLOUD TELEPHONY SERVICE CURRENT AND FUTURE TYPE ANALYSIS, 2025–2034, (USD MILLION)
FIGURE 87 FIJI CLOUD TELEPHONY SERVICE CURRENT AND FUTURE END USER ANALYSIS, 2025–2034, (USD MILLION)
FIGURE 88 INDONESIA CLOUD TELEPHONY SERVICE CURRENT AND FUTURE TYPE ANALYSIS, 2025–2034, (USD MILLION)
FIGURE 89 INDONESIA CLOUD TELEPHONY SERVICE CURRENT AND FUTURE END USER ANALYSIS, 2025–2034, (USD MILLION)
FIGURE 90 SOUTH KOREA CLOUD TELEPHONY SERVICE CURRENT AND FUTURE TYPE ANALYSIS, 2025–2034, (USD MILLION)
FIGURE 91 SOUTH KOREA CLOUD TELEPHONY SERVICE CURRENT AND FUTURE END USER ANALYSIS, 2025–2034, (USD MILLION)
FIGURE 92 REST OF EAST ASIA AND PACIFIC CLOUD TELEPHONY SERVICE CURRENT AND FUTURE TYPE ANALYSIS, 2025–2034, (USD MILLION)
FIGURE 93 REST OF EAST ASIA AND PACIFIC CLOUD TELEPHONY SERVICE CURRENT AND FUTURE END USER ANALYSIS, 2025–2034, (USD MILLION)
FIGURE 94 SEA AND SOUTH ASIA CLOUD TELEPHONY SERVICE CURRENT AND FUTURE MARKET VOLUME SHARE REGIONAL ANALYSIS, 2025–2034, (USD MILLION)
FIGURE 95 BANGLADESH CLOUD TELEPHONY SERVICE CURRENT AND FUTURE TYPE ANALYSIS, 2025–2034, (USD MILLION)
FIGURE 96 BANGLADESH CLOUD TELEPHONY SERVICE CURRENT AND FUTURE END USER ANALYSIS, 2025–2034, (USD MILLION)
FIGURE 97 NEW ZEALAND CLOUD TELEPHONY SERVICE CURRENT AND FUTURE TYPE ANALYSIS, 2025–2034, (USD MILLION)
FIGURE 98 NEW ZEALAND CLOUD TELEPHONY SERVICE CURRENT AND FUTURE END USER ANALYSIS, 2025–2034, (USD MILLION)
FIGURE 99 INDIA CLOUD TELEPHONY SERVICE CURRENT AND FUTURE TYPE ANALYSIS, 2025–2034, (USD MILLION)
FIGURE 100 INDIA CLOUD TELEPHONY SERVICE CURRENT AND FUTURE END USER ANALYSIS, 2025–2034, (USD MILLION)
FIGURE 101 SINGAPORE CLOUD TELEPHONY SERVICE CURRENT AND FUTURE TYPE ANALYSIS, 2025–2034, (USD MILLION)
FIGURE 102 SINGAPORE CLOUD TELEPHONY SERVICE CURRENT AND FUTURE END USER ANALYSIS, 2025–2034, (USD MILLION)
FIGURE 103 THAILAND CLOUD TELEPHONY SERVICE CURRENT AND FUTURE TYPE ANALYSIS, 2025–2034, (USD MILLION)
FIGURE 104 THAILAND CLOUD TELEPHONY SERVICE CURRENT AND FUTURE END USER ANALYSIS, 2025–2034, (USD MILLION)
FIGURE 105 TAIWAN CLOUD TELEPHONY SERVICE CURRENT AND FUTURE TYPE ANALYSIS, 2025–2034, (USD MILLION)
FIGURE 106 TAIWAN CLOUD TELEPHONY SERVICE CURRENT AND FUTURE END USER ANALYSIS, 2025–2034, (USD MILLION)
FIGURE 107 MALAYSIA CLOUD TELEPHONY SERVICE CURRENT AND FUTURE TYPE ANALYSIS, 2025–2034, (USD MILLION)
FIGURE 108 MALAYSIA CLOUD TELEPHONY SERVICE CURRENT AND FUTURE END USER ANALYSIS, 2025–2034, (USD MILLION)
FIGURE 109 REST OF SEA AND SOUTH ASIA CLOUD TELEPHONY SERVICE CURRENT AND FUTURE TYPE ANALYSIS, 2025–2034, (USD MILLION)
FIGURE 110 REST OF SEA AND SOUTH ASIA CLOUD TELEPHONY SERVICE CURRENT AND FUTURE END USER ANALYSIS, 2025–2034, (USD MILLION)
FIGURE 111 MIDDLE EAST AND AFRICA CLOUD TELEPHONY SERVICE CURRENT AND FUTURE MARKET VOLUME SHARE REGIONAL ANALYSIS, 2025–2034, (USD MILLION)
FIGURE 112 GCC COUNTRIES CLOUD TELEPHONY SERVICE CURRENT AND FUTURE TYPE ANALYSIS, 2025–2034, (USD MILLION)
FIGURE 113 GCC COUNTRIES CLOUD TELEPHONY SERVICE CURRENT AND FUTURE END USER ANALYSIS, 2025–2034, (USD MILLION)
FIGURE 114 SAUDI ARABIA CLOUD TELEPHONY SERVICE CURRENT AND FUTURE TYPE ANALYSIS, 2025–2034, (USD MILLION)
FIGURE 115 SAUDI ARABIA CLOUD TELEPHONY SERVICE CURRENT AND FUTURE END USER ANALYSIS, 2025–2034, (USD MILLION)
FIGURE 116 UAE CLOUD TELEPHONY SERVICE CURRENT AND FUTURE TYPE ANALYSIS, 2025–2034, (USD MILLION)
FIGURE 117 UAE CLOUD TELEPHONY SERVICE CURRENT AND FUTURE END USER ANALYSIS, 2025–2034, (USD MILLION)
FIGURE 118 BAHRAIN CLOUD TELEPHONY SERVICE CURRENT AND FUTURE TYPE ANALYSIS, 2025–2034, (USD MILLION)
FIGURE 119 BAHRAIN CLOUD TELEPHONY SERVICE CURRENT AND FUTURE END USER ANALYSIS, 2025–2034, (USD MILLION)
FIGURE 120 KUWAIT CLOUD TELEPHONY SERVICE CURRENT AND FUTURE TYPE ANALYSIS, 2025–2034, (USD MILLION)
FIGURE 121 KUWAIT CLOUD TELEPHONY SERVICE CURRENT AND FUTURE END USER ANALYSIS, 2025–2034, (USD MILLION)
FIGURE 122 OMAN CLOUD TELEPHONY SERVICE CURRENT AND FUTURE TYPE ANALYSIS, 2025–2034, (USD MILLION)
FIGURE 123 OMAN CLOUD TELEPHONY SERVICE CURRENT AND FUTURE END USER ANALYSIS, 2025–2034, (USD MILLION)
FIGURE 124 QATAR CLOUD TELEPHONY SERVICE CURRENT AND FUTURE TYPE ANALYSIS, 2025–2034, (USD MILLION)
FIGURE 125 QATAR CLOUD TELEPHONY SERVICE CURRENT AND FUTURE END USER ANALYSIS, 2025–2034, (USD MILLION)
FIGURE 126 EGYPT CLOUD TELEPHONY SERVICE CURRENT AND FUTURE TYPE ANALYSIS, 2025–2034, (USD MILLION)
FIGURE 127 EGYPT CLOUD TELEPHONY SERVICE CURRENT AND FUTURE END USER ANALYSIS, 2025–2034, (USD MILLION)
FIGURE 128 NIGERIA CLOUD TELEPHONY SERVICE CURRENT AND FUTURE TYPE ANALYSIS, 2025–2034, (USD MILLION)
FIGURE 129 NIGERIA CLOUD TELEPHONY SERVICE CURRENT AND FUTURE END USER ANALYSIS, 2025–2034, (USD MILLION)
FIGURE 130 SOUTH AFRICA CLOUD TELEPHONY SERVICE CURRENT AND FUTURE TYPE ANALYSIS, 2025–2034, (USD MILLION)
FIGURE 131 SOUTH AFRICA CLOUD TELEPHONY SERVICE CURRENT AND FUTURE END USER ANALYSIS, 2025–2034, (USD MILLION)
FIGURE 132 ISRAEL CLOUD TELEPHONY SERVICE CURRENT AND FUTURE TYPE ANALYSIS, 2025–2034, (USD MILLION)
FIGURE 133 ISRAEL CLOUD TELEPHONY SERVICE CURRENT AND FUTURE END USER ANALYSIS, 2025–2034, (USD MILLION)
FIGURE 134 REST OF MEA CLOUD TELEPHONY SERVICE CURRENT AND FUTURE TYPE ANALYSIS, 2025–2034, (USD MILLION)
FIGURE 135 REST OF MEA CLOUD TELEPHONY SERVICE CURRENT AND FUTURE END USER ANALYSIS, 2025–2034, (USD MILLION)
FIGURE 136 U. S. MARKET SHARE ANALYSIS BY TYPE (2024)
FIGURE 137 U. S. MARKET SHARE ANALYSIS BY END USER (2024)
FIGURE 138 CANADA MARKET SHARE ANALYSIS BY TYPE (2024)
FIGURE 139 CANADA MARKET SHARE ANALYSIS BY END USER (2024)
FIGURE 140 MEXICO MARKET SHARE ANALYSIS BY TYPE (2024)
FIGURE 141 MEXICO MARKET SHARE ANALYSIS BY END USER (2024)
FIGURE 142 CHINA MARKET SHARE ANALYSIS BY TYPE (2024)
FIGURE 143 CHINA MARKET SHARE ANALYSIS BY END USER (2024)
FIGURE 144 JAPAN MARKET SHARE ANALYSIS BY TYPE (2024)
FIGURE 145 JAPAN MARKET SHARE ANALYSIS BY END USER (2024)
FIGURE 146 INDIA MARKET SHARE ANALYSIS BY TYPE (2024)
FIGURE 147 INDIA MARKET SHARE ANALYSIS BY END USER (2024)
FIGURE 148 SOUTH KOREA MARKET SHARE ANALYSIS BY TYPE (2024)
FIGURE 149 SOUTH KOREA MARKET SHARE ANALYSIS BY END USER (2024)
FIGURE 150 SAUDI ARABIA MARKET SHARE ANALYSIS BY TYPE (2024)
FIGURE 151 SAUDI ARABIA MARKET SHARE ANALYSIS BY END USER (2024)
FIGURE 152 UAE MARKET SHARE ANALYSIS BY TYPE (2024)
FIGURE 153 UAE MARKET SHARE ANALYSIS BY END USER (2024)
FIGURE 154 EGYPT MARKET SHARE ANALYSIS BY TYPE (2024)
FIGURE 155 EGYPT MARKET SHARE ANALYSIS BY END USER (2024)
FIGURE 156 NIGERIA MARKET SHARE ANALYSIS BY TYPE (2024)
FIGURE 157 NIGERIA MARKET SHARE ANALYSIS BY END USER (2024)
FIGURE 158 SOUTH AFRICA MARKET SHARE ANALYSIS BY TYPE (2024)
FIGURE 159 SOUTH AFRICA MARKET SHARE ANALYSIS BY END USER (2024)
FIGURE 160 GERMANY MARKET SHARE ANALYSIS BY TYPE (2024)
FIGURE 161 GERMANY MARKET SHARE ANALYSIS BY END USER (2024)
FIGURE 162 FRANCE MARKET SHARE ANALYSIS BY TYPE (2024)
FIGURE 163 FRANCE MARKET SHARE ANALYSIS BY END USER (2024)
FIGURE 164 UK MARKET SHARE ANALYSIS BY TYPE (2024)
FIGURE 165 UK MARKET SHARE ANALYSIS BY END USER (2024)
FIGURE 166 SPAIN MARKET SHARE ANALYSIS BY TYPE (2024)
FIGURE 167 SPAIN MARKET SHARE ANALYSIS BY END USER (2024)
FIGURE 168 ITALY MARKET SHARE ANALYSIS BY TYPE (2024)
FIGURE 169 ITALY MARKET SHARE ANALYSIS BY END USER (2024)
FIGURE 170 BRAZIL MARKET SHARE ANALYSIS BY TYPE (2024)
FIGURE 171 BRAZIL MARKET SHARE ANALYSIS BY END USER (2024)
FIGURE 172 ARGENTINA MARKET SHARE ANALYSIS BY TYPE (2024)
FIGURE 173 ARGENTINA MARKET SHARE ANALYSIS BY END USER (2024)
FIGURE 174 COLUMBIA MARKET SHARE ANALYSIS BY TYPE (2024)
FIGURE 175 COLUMBIA MARKET SHARE ANALYSIS BY END USER (2024)
FIGURE 176 GLOBAL CLOUD TELEPHONY SERVICE CURRENT AND FUTURE MARKET KEY COUNTRY LEVEL ANALYSIS, 2024–2034, (USD MILLION)
FIGURE 177 FINANCIAL OVERVIEW:
Key Player Analysis
Dialpad Inc.: Dialpad Inc. holds a strong leadership position in the cloud telephony service market as of 2025. The company continues to expand its unified communications platform, which includes cloud voice, messaging, contact center solutions, and AI-driven conversation insights. Its AI engine supports real-time transcription and call analytics, features that now influence more than 60 percent of new deployments among mid-sized enterprises. Dialpad reports consistent double-digit annual revenue growth, supported by strong demand across North America and increasing traction in Western Europe. You see Dialpad differentiate through its fully cloud-native architecture and ability to integrate with tools such as Salesforce, HubSpot, and Microsoft 365.
Strategically, the company invests in product expansion and targeted acquisitions to strengthen its contact center and workflow automation capabilities. It prioritizes AI investment, allocating an estimated 20 percent of annual R&D spending to improve speech recognition and predictive intelligence. Dialpad also expands partnerships with telecom operators to enter Asia Pacific markets. This strategy enables clients with distributed teams to adopt consistent communication frameworks across regions.
Exotel Techcom Pvt. Ltd.: Exotel positions itself as a high-growth challenger with strong relevance in India and Southeast Asia. The company focuses on cloud telephony, virtual numbers, conversational AI, and customer engagement platforms. Its client base includes fast-growing digital businesses, telecom operators, and financial institutions. Exotel benefits from strong adoption among SMEs and mid-sized enterprises that seek reliable and compliant voice and messaging solutions. The firm reports steady annual growth in enterprise contracts, driven by rising cloud communication adoption in emerging markets.
The company’s strategic expansion includes its merged operations with Ameyo, which broadened its footprint in customer engagement and cloud contact center solutions. Exotel continues to invest in regional data centers to support regulatory requirements and improve latency across domestic operations. It differentiates through local compliance, multi-country routing, and strong integration capabilities with regional CRM and ERP systems. This positions it as a preferred partner for firms expanding across South Asia and the Middle East.
Go2Market India Pvt. Ltd.: Go2Market India Pvt. Ltd. operates as a specialized provider focused on cloud communication, virtual call centers, IVR, and hosted telephony solutions. The company holds a meaningful presence in the Indian SME sector where demand for cost-efficient cloud calling and customer engagement tools continues to rise. Its platform supports high-volume calling needs for sales, marketing, and service teams across retail, healthcare, and BFSI. Market share growth remains consistent, driven by adoption from organizations seeking flexible subscription models.
Strategically, Go2Market invests in automation features and analytics modules that help users manage lead flows and customer interactions more efficiently. The company strengthens its platform through partnerships with regional telecom operators and digital service providers. Its differentiators include competitive pricing, rapid deployment cycles, and ease of integration with domestic CRM systems. Go2Market maintains its momentum by focusing on India’s expanding digital business ecosystem and sustained demand for remote-ready communication infrastructure.
Market Key Players
NFON AG
Dialpad Inc.
LeadNXT
Tripudio Ltd.
8×8 Inc.
Exotel Techcom Pvt. Ltd.
AVOXI Inc.
Nextiva
Go 2 Market India Pvt. Ltd.
Cisco Systems Inc.
Other Key Players
Driver:
Expansion of Remote and Hybrid Work Models
By 2025, remote and hybrid work models will be well established across most industries, changing how companies communicate. Organizations are shifting voice and messaging tasks to cloud platforms, allowing employees to access corporate phone systems from anywhere with a reliable internet connection. This change helps maintain workforce flexibility while ensuring smooth operations, especially for teams spread across different locations.
Cost Efficiency and Unified Communications Adoption
Adoption continues to grow as companies aim to cut costs and boost productivity with subscription-based cloud phone solutions. These platforms combine communication features like smart call routing, analytics dashboards, virtual numbers, and IVR systems. Consequently, businesses and small to medium enterprises lessen their reliance on physical infrastructure while gaining communication capabilities that are scalable and predictable, supporting long-term digital workplace plans.
Restraint:
Infrastructure Gaps in Developing Markets
Market growth slows in areas where digital infrastructure and technical skills are still developing. Many organizations in lower-income or developing regions struggle with limited broadband access and slow IT upgrades. These issues increase the chance of service interruptions and limit the reliability of cloud communication setups.
Regulatory, Security, and Cost Challenges
Data privacy and cybersecurity worries remain significant hurdles, especially as organizations consider the risks of storing communication data in the cloud. Compliance rules differ greatly across regions, often leading to higher costs related to regulations and security. Smaller companies face further challenges due to funding limitations, especially when moving to the cloud requires updates to networks, security systems, or internal IT capabilities.
Opportunity:
Efficiency-Driven Cloud Adoption
The market offers strong chances as businesses focus on improving efficiency and automation in their communication processes. Small to medium enterprises, particularly in developing regions, are increasingly interested in cloud telephony as adoption speeds up. These organizations want to handle growing call volumes and customer interactions without spending on more physical infrastructure.
Industry-Specific Digital Transformation Initiatives
Sectors like banking, financial services, and insurance (BFSI) and retail are putting significant resources into cloud communication platforms to enhance real-time customer engagement and cut support costs. Cloud telephony is becoming an integral part of larger digital transformation efforts, connecting communication systems with CRM, analytics, and AI tools. Revenue linked to these efficiency-focused deployments is expected to grow steadily, with close to 10 percent annual growth projected through 2030.
Trend:
Globalization of Enterprise Communication Systems
In 2025, global expansion strategies will push a clear move toward cloud communication systems. Multinational companies will seek uniform, centralized communication methods across regions without needing to create or manage local telecom setups. Cloud telephony will support standard operations while allowing for regional flexibility.
Cross-Border Partnerships and Multi-Region Enablement
Service providers respond by forming strategic partnerships to offer international numbering, meet regulatory demands, and enable multi-region setups. Collaborations like Ooredoo’s partnership with Cisco demonstrate how providers improve cross-border functions. Businesses can now get local numbers and operate in multiple countries through one platform, breaking down geographic barriers and speeding up adoption among companies looking to expand globally.
Recent Developments
Dec 2024 - RingCentral Inc.: RingCentral announced an expanded AI-enabled cloud telephony suite for mid-market and enterprise customers, targeting more than 5,000 existing PBX migrations and an estimated additional ARR of over USD 90 million. The move strengthens its position with large accounts that want a single global platform for voice and collaboration.
Feb 2025 - Twilio Inc.: Twilio launched a dedicated cloud telephony bundle for contact centers that combines programmable voice, call recording, and AI-based interaction analytics, priced on a per-minute and per-seat model. The offer aims to lift attach rates in customer engagement deals by more than 20 percent and deepens Twilio’s role in complex omnichannel projects.
Apr 2025 - Dialpad Inc.: Dialpad introduced region-specific data residency options for its cloud telephony and contact center products across the EU, India, and the Middle East, supported by three new regional data centers. This step improves compliance with local regulations and supports faster adoption among regulated industries such as BFSI and healthcare.
Jul 2025 - Exotel Techcom Pvt. Ltd.: Exotel completed the integration of its cloud telephony platform with a unified customer engagement stack acquired in a deal valued at around USD 45 million. The combined offering allows enterprise clients in India and Southeast Asia to run voice, messaging, and contact center operations on one platform and reinforces Exotel’s challenger position in regional cloud communications.
Sep 2025 - Zoom Video Communications, Inc.: Zoom expanded its Zoom Phone cloud telephony service into eight new markets in Latin America and Eastern Europe, taking its geographic coverage to more than 65 countries and territories. This expansion increases its addressable telephony revenue base and positions Zoom as a stronger competitor to established UCaaS and cloud PBX providers in multinational accounts.