Global CNC Machines Market Size, Share & Analysis By Machine Type (Lathe, Milling, Grinding, EDM), By Axis Type (3-Axis, 4-Axis, 5-Axis), By End-User (Automotive, Aerospace, Industrial Manufacturing) Industry Regions & Key Players – Smart Factory Trends & Forecast 2025–2034
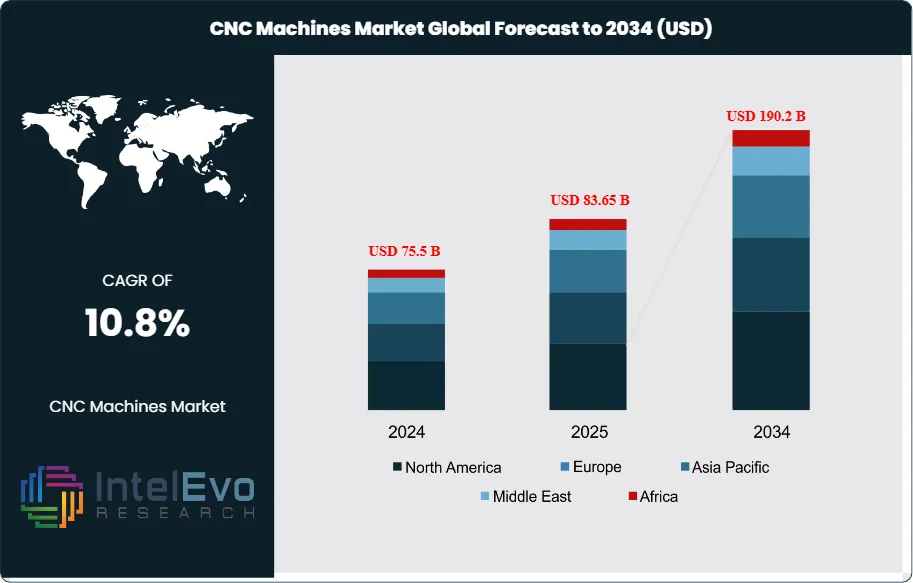
The CNC Machines Market is estimated at USD 75.5 billion in 2024 and is on track to reach roughly USD 190.2 billion by 2034, implying a compound annual growth rate of 10.8% over 2024–2034. Momentum reflects a structural shift toward automated, high-precision manufacturing as producers confront rising labor costs, tighter tolerances, and accelerating product refresh cycles. After a steady expansion in the last five years—supported by automotive retooling, aerospace backlog recovery, and medical device miniaturization—growth is expected to broaden from new equipment to lifecycle revenues, with services, retrofits, and software subscriptions accounting for a rising share of spend by 2030.
On the demand side, plants operating at only 60–80% overall equipment effectiveness are adopting CNC to lift first-pass yield and reduce scrap; deployments typically improve throughput 10–15%, cut material waste by 8–12%, and shorten set-up times by up to 30%, directly enhancing unit economics. On the supply side, OEMs are compressing lead times through modular platforms and localized assembly, while competition on price/performance is intensifying in mid-range vertical machining centers and turning centers. Policy tailwinds—Industry 4.0 incentives, tax depreciation for capital equipment, and energy-efficiency standards—are reinforcing adoption, although cyclicality in capital expenditure, skills shortages for programming and metrology, and cybersecurity risks in connected factories remain key constraints.
Technology is reshaping value capture: multi-axis (5-axis) and mill-turn machines are set to outgrow the market, aided by AI-optimized toolpaths, digital twins for process verification, and edge analytics for predictive maintenance; users report 5–10% gains in spindle uptime and 10–20% extensions in tool life when analytics are embedded. Additive–subtractive hybrids are emerging for high-mix, low-volume parts, while automated pallet systems and collaborative robots expand lights-out machining.
Regionally, Asia–Pacific is the volume engine (≈50% of demand), led by China’s electronics and machinery clusters and Japan/Korea’s premium machine tool ecosystems; Europe remains strong in high-precision niches (Germany, Italy) aligned to EV and aerospace programs; North America is buoyed by reshoring, semiconductor fabs, and defense orders; and investment hotspots are forming in India, ASEAN, Mexico, and Central/Eastern Europe as OEMs pursue China-plus-one and nearshoring strategies. For investors, platforms with scalable software, strong service networks, and automation-ready portfolios are positioned to capture disproportionate value through the cycle.
Key Takeaways
Market Growth: The CNC Machines Market was USD 73.5 billion in 2024 and is projected to reach USD 190.2 billion by 2034 (10.8% CAGR), creating an incremental opportunity of USD 113.7 billion driven by factory automation, tighter tolerances in EV/aerospace, and Industry 4.0 investments.
Segment Dominance – Product Type: Lathe/turning machines led in 2024 with 30% share (~USD 22.1 billion), reflecting their versatility for high-throughput metal and wood turning across job shops and general engineering; vendors such as Mazak, Okuma, and Haas sustain leadership through broad portfolios and competitive total cost of ownership.
Segment Dominance – End Use: Industrial applications accounted for 27% of 2024 revenue (~USD 19.8 billion), driven by precision machining in automotive components, general machinery, and contract manufacturing, where CNC adoption reduces scrap and rework and supports high-mix, low-volume runs.
Driver: Productivity economics are compelling as plants operating at 60–80% OEE deploy CNC to lift first-pass yield; typical programs deliver 10–15% throughput gains, 8–12% scrap reduction, and up to 30% shorter setup times, accelerating payback.
Restraint: High capital intensity and skills scarcity constrain SME adoption—multi-axis/mill-turn cells often require USD 0.3–1.0 million per line plus integration, while shortages of CNC programmers and metrology talent elongate ramp-up timelines and increase commissioning costs.
Opportunity: Fastest growth is expected in 5-axis and mill-turn platforms—supported by lights-out cells and pallet automation—outpacing the market as users consolidate operations on fewer machines; this, alongside retrofit/control upgrades, targets a sizeable share of the USD 113.7 billion decade-long upside.
Trend: Digitalized machining is scaling as AI-optimized toolpaths, digital twins, and edge analytics lift spindle uptime by 5–10% and extend tool life by 10–20%; ecosystems from Siemens (Sinumerik), FANUC, and Sandvik Coromant are embedding software, connectivity, and MTConnect-ready monitoring into standard workflows.
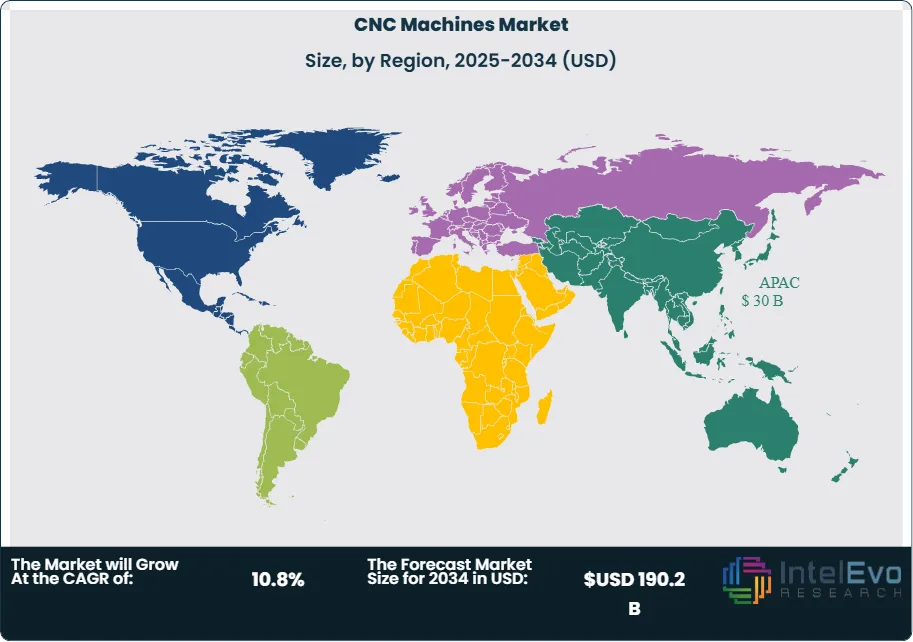
Regional Analysis: Asia Pacific dominated in 2024 with 37% share (≈USD 27.2 billion), led by electronics/machinery clusters in China and advanced machine tool ecosystems in Japan/Korea; North America benefits from reshoring, semiconductor fabs, and defense, while Europe retains strength in precision niches (Germany/Italy) and emerging hotspots include India, ASEAN, Mexico, and CEE.
Type Analysis
Lathe machines remain the anchor of CNC demand in 2025, accounting for roughly 30% of revenue (≈USD 24–25 billion on a market base of ~USD 80.7 billion). Their dominance stems from unmatched versatility in turning cores, shafts, and housings across steel and aluminum, with multi-turret and live-tool configurations compressing cycle times for high-mix, low-volume work. Tier-one portfolios from Mazak, Okuma, DMG MORI, and Haas continue to win on total cost of ownership, while retrofit controls extend the installed base’s productive life. Milling machines form the second-largest pool and are set to outgrow legacy three-axis platforms as 5-axis and mill-turn architectures consolidate operations; adopters report 10–15% throughput gains and up to 30% faster changeovers when pallet automation is integrated.
Laser machines are scaling fastest in sheet-metal and precision profiling, aided by fiber sources, automated loading, and nesting software that lifts material utilization. The segment is expected to grow in the low-teens CAGR through 2030 as TRUMPF/Bystronic-class systems migrate downstream to job shops. CNC welding solutions—coordinated robots with seam-tracking and real-time quality monitoring—capture 5–7% share, driven by EV chassis, agricultural equipment, and heavy fabrications. Winding machines, though niche (3–4% share), benefit from electrification tailwinds in motors, e-axles, and transformers. “Other” types—grinders, EDM, routers—collectively address high-precision finishing and composites, sustaining 15–18% of spend as tolerance requirements tighten.
Application Analysis
Production machining for precision components remains the largest application cluster (≈55–60% of 2025 revenue), spanning powertrain housings, hydraulic blocks, and aerospace fittings. Plants operating at 60–80% OEE are prioritizing CNC upgrades to boost first-pass yield; typical programs cut scrap 8–12% and extend tool life 10–20% with adaptive feeds and in-process metrology. Sheet-metal fabrication is a second growth engine as white-goods, EV body parts, and industrial enclosures shift to fiber-laser cuts and automated bending cells, with laser systems now representing about a quarter of new installations in many job-shop districts.
Prototyping, tooling, and mold/die work are increasingly digital, leveraging CAD/CAM-driven 5-axis rough-to-finish strategies and hybrid additive–subtractive cells to compress development cycles. Early adopters report 20–30% shorter time-to-tool and measurable reductions in rework via simulation and digital twins. Micro-machining for medical and electronics, while smaller in absolute terms, posts outsize growth as miniaturization and surface-finish requirements intensify.
End-Use Analysis
General industrial and contract manufacturing remains the single largest end-use, near 26–28% of 2025 revenue (≈USD 22 billion), reflecting broad deployment across machinery, job shops, and metal fabrication. Automotive demand is pivoting from legacy ICE machining to EV platforms: battery trays, e-motor shafts, and inverter housings favor multi-axis milling and high-speed aluminum cutting, with automation driving unattended shifts. Aerospace & defense continues to outpace the market on complex geometries and superalloys; 5-axis penetration is highest here, supported by closed-loop probing and toolpath optimization to safeguard part integrity on long cycle times.
Construction equipment and off-highway machinery rely on heavy-duty turning/milling and robotic welding, growing broadly in line with the market as infrastructure spending normalizes. Power & energy posts high single- to low double-digit growth on gas-turbine components, grid hardware, and wind drivetrain parts, where precision and reliability standards are stringent. “Other end-users”—medical devices and consumer electronics—are expanding fastest off a smaller base, propelled by micro-features, tight tolerances, and validated process control.
Regional Analysis
Asia Pacific retains leadership in 2025 with ~37% share (≈USD 30 billion), underpinned by China’s electronics and machinery clusters, Japan/Korea’s premium machine-tool ecosystems, and accelerating capacity additions in India and ASEAN. Localization policies and Industry 4.0 incentives are lifting adoption of automation-ready cells and domestic control platforms. Europe remains a high-precision stronghold (Germany, Italy, Switzerland) aligned to aerospace, automotive tooling, and medical machining; despite energy-cost headwinds, the region sustains an advanced installed base and deep process know-how. North America is buoyed by reshoring, semiconductor fabs, and defense procurement, with robust demand for palletized 5-axis cells and MTConnect-ready monitoring.
Emerging hotspots include India, Mexico, Vietnam, and Central & Eastern Europe, each benefiting from “China-plus-one” and near-shoring strategies. These markets are expected to compound at double-digit rates through the late 2020s as suppliers build local machining capacity and integrators expand service networks. Investors should track regions pairing capital incentives with skilled-labor pipelines, as aftersales and software subscriptions increasingly shape lifetime economics.
By Type (Lathe Machines, Milling Machines, Laser Machines, Welding Machines, Winding Machines, Other Types), By End-User (Automotive, Aerospace & Defense, Construction Equipment, Power & Energy, Industrial, Other End-Users)
Research Methodology
Primary Research- 100 Interviews of Stakeholders
Secondary Research
Desk Research
Regional scope
North America (United States, Canada, Mexico)
Latin America (Brazil, Argentina, Columbia)
East Asia And Pacific (China, Japan, South Korea, Australia, Cambodia, Fiji, Indonesia)
Sea And South Asia (India, Singapore, Thailand, Taiwan, Malaysia)
Eastern Europe (Poland, Russia, Czech Republic, Romania)
Western Europe (Germany, U.K., France, Spain, Itlay)
Middle East & Africa (GCC Countries, Egypt, Nigeria, South Africa, Israel)
Competitive Landscape
Hurco Companies, Inc., Shenyang Machine Tool Part Co., Ltd., Okuma Corporation, General Technology Group, Haas Automation, Inc., Fanuc Corporation, Yamazaki Mazak Corporation, Amada Machinery Co., Ltd., Dalian Machine Tool Corporation, Amera Seiki, DMG Mori Co., Ltd., Datron AG
Customization Scope
Customization for segments, region/country-level will be provided. Moreover, additional customization can be done based on the requirements.
Pricing and Purchase Options
Avail customized purchase options to meet your exact research needs. We have three licenses to opt for: Single User License, Multi-User License (Up to 5 Users), Corporate Use License (Unlimited User and Printable PDF).
TABLE OF CONTENTS
1. EXECUTIVE SUMMARY
1.1. MARKET SNAPSHOT
1.2. KEY FINDINGS & INSIGHTS
1.3. ANALYST RECOMMENDATIONS
1.4. FUTURE OUTLOOK
2. RESEARCH METHODOLOGY
2.1. MARKET DEFINITION & SCOPE
2.2. RESEARCH OBJECTIVES: PRIMARY & SECONDARY DATA SOURCES
2.3. DATA COLLECTION SOURCES
2.3.1. COVERAGE OF 100+ PRIMARY RESEARCH/CONSULTATION CALLS WITH INDUSTRY STAKEHOLDERS
FIGURE 17 NORTH AMERICA CNC MACHINES SYSTEM CURRENT AND FUTURE TYPE ANALYSIS, 2025–2034, (USD MILLION)
FIGURE 18 NORTH AMERICA CNC MACHINES SYSTEM CURRENT AND FUTURE END USER ANALYSIS, 2025–2034, (USD MILLION)
FIGURE 19 MARKET SHARE BY COUNTRY
FIGURE 20 LATIN AMERICA CNC MACHINES SYSTEM CURRENT AND FUTURE TYPE ANALYSIS, 2025–2034, (USD MILLION)
FIGURE 21 LATIN AMERICA CNC MACHINES SYSTEM CURRENT AND FUTURE END USER ANALYSIS, 2025–2034, (USD MILLION)
FIGURE 22 MARKET SHARE BY COUNTRY
FIGURE 23 EASTERN EUROPE CNC MACHINES SYSTEM CURRENT AND FUTURE TYPE ANALYSIS, 2025–2034, (USD MILLION)
FIGURE 24 EASTERN EUROPE CNC MACHINES SYSTEM CURRENT AND FUTURE END USER ANALYSIS, 2025–2034, (USD MILLION)
FIGURE 25 MARKET SHARE BY COUNTRY
FIGURE 26 WESTERN EUROPE CNC MACHINES SYSTEM CURRENT AND FUTURE TYPE ANALYSIS, 2025–2034, (USD MILLION)
FIGURE 27 WESTERN EUROPE CNC MACHINES SYSTEM CURRENT AND FUTURE END USER ANALYSIS, 2025–2034, (USD MILLION)
FIGURE 28 MARKET SHARE BY COUNTRY
FIGURE 29 EAST ASIA AND PACIFIC CNC MACHINES SYSTEM CURRENT AND FUTURE TYPE ANALYSIS, 2025–2034, (USD MILLION)
FIGURE 30 EAST ASIA AND PACIFIC CNC MACHINES SYSTEM CURRENT AND FUTURE END USER ANALYSIS, 2025–2034, (USD MILLION)
FIGURE 31 MARKET SHARE BY COUNTRY
FIGURE 32 SEA AND SOUTH ASIA CNC MACHINES SYSTEM CURRENT AND FUTURE TYPE ANALYSIS, 2025–2034, (USD MILLION)
FIGURE 33 SEA AND SOUTH ASIA CNC MACHINES SYSTEM CURRENT AND FUTURE END USER ANALYSIS, 2025–2034, (USD MILLION)
FIGURE 34 MARKET SHARE BY COUNTRY
FIGURE 35 MIDDLE EAST AND AFRICA CNC MACHINES SYSTEM CURRENT AND FUTURE TYPE ANALYSIS, 2025–2034, (USD MILLION)
FIGURE 36 MIDDLE EAST AND AFRICA CNC MACHINES SYSTEM CURRENT AND FUTURE END USER ANALYSIS, 2025–2034, (USD MILLION)
FIGURE 37 NORTH AMERICA CNC MACHINES SYSTEM CURRENT AND FUTURE MARKET VOLUME SHARE REGIONAL ANALYSIS, 2025–2034, (USD MILLION)
FIGURE 38 U.S. CNC MACHINES SYSTEM CURRENT AND FUTURE TYPE ANALYSIS, 2025–2034, (USD MILLION)
FIGURE 39 U.S. CNC MACHINES SYSTEM CURRENT AND FUTURE END USER ANALYSIS, 2025–2034, (USD MILLION)
FIGURE 40 CANADA CNC MACHINES SYSTEM CURRENT AND FUTURE TYPE ANALYSIS, 2025–2034, (USD MILLION)
FIGURE 41 CANADA CNC MACHINES SYSTEM CURRENT AND FUTURE END USER ANALYSIS, 2025–2034, (USD MILLION)
FIGURE 42 LATIN AMERICA CNC MACHINES SYSTEM CURRENT AND FUTURE MARKET VOLUME SHARE REGIONAL ANALYSIS, 2025–2034, (USD MILLION)
FIGURE 43 MEXICO CNC MACHINES SYSTEM CURRENT AND FUTURE TYPE ANALYSIS, 2025–2034, (USD MILLION)
FIGURE 44 MEXICO CNC MACHINES SYSTEM CURRENT AND FUTURE END USER ANALYSIS, 2025–2034, (USD MILLION)
FIGURE 45 BRAZIL CNC MACHINES SYSTEM CURRENT AND FUTURE TYPE ANALYSIS, 2025–2034, (USD MILLION)
FIGURE 46 BRAZIL CNC MACHINES SYSTEM CURRENT AND FUTURE END USER ANALYSIS, 2025–2034, (USD MILLION)
FIGURE 47 ARGENTINA CNC MACHINES SYSTEM CURRENT AND FUTURE TYPE ANALYSIS, 2025–2034, (USD MILLION)
FIGURE 48 ARGENTINA CNC MACHINES SYSTEM CURRENT AND FUTURE END USER ANALYSIS, 2025–2034, (USD MILLION)
FIGURE 49 COLUMBIA CNC MACHINES SYSTEM CURRENT AND FUTURE TYPE ANALYSIS, 2025–2034, (USD MILLION)
FIGURE 50 COLUMBIA CNC MACHINES SYSTEM CURRENT AND FUTURE END USER ANALYSIS, 2025–2034, (USD MILLION)
FIGURE 51 REST OF LATIN AMERICA CNC MACHINES SYSTEM CURRENT AND FUTURE TYPE ANALYSIS, 2025–2034, (USD MILLION)
FIGURE 52 REST OF LATIN AMERICA CNC MACHINES SYSTEM CURRENT AND FUTURE END USER ANALYSIS, 2025–2034, (USD MILLION)
FIGURE 53 EASTERN EUROPE CNC MACHINES SYSTEM CURRENT AND FUTURE MARKET VOLUME SHARE REGIONAL ANALYSIS, 2025–2034, (USD MILLION)
FIGURE 54 POLAND CNC MACHINES SYSTEM CURRENT AND FUTURE TYPE ANALYSIS, 2025–2034, (USD MILLION)
FIGURE 55 POLAND CNC MACHINES SYSTEM CURRENT AND FUTURE END USER ANALYSIS, 2025–2034, (USD MILLION)
FIGURE 56 RUSSIA CNC MACHINES SYSTEM CURRENT AND FUTURE TYPE ANALYSIS, 2025–2034, (USD MILLION)
FIGURE 57 RUSSIA CNC MACHINES SYSTEM CURRENT AND FUTURE END USER ANALYSIS, 2025–2034, (USD MILLION)
FIGURE 58 CZECH REPUBLIC CNC MACHINES SYSTEM CURRENT AND FUTURE TYPE ANALYSIS, 2025–2034, (USD MILLION)
FIGURE 59 CZECH REPUBLIC CNC MACHINES SYSTEM CURRENT AND FUTURE END USER ANALYSIS, 2025–2034, (USD MILLION)
FIGURE 60 ROMANIA CNC MACHINES SYSTEM CURRENT AND FUTURE TYPE ANALYSIS, 2025–2034, (USD MILLION)
FIGURE 61 ROMANIA CNC MACHINES SYSTEM CURRENT AND FUTURE END USER ANALYSIS, 2025–2034, (USD MILLION)
FIGURE 62 REST OF EASTERN EUROPE CNC MACHINES SYSTEM CURRENT AND FUTURE TYPE ANALYSIS, 2025–2034, (USD MILLION)
FIGURE 63 REST OF EASTERN EUROPE CNC MACHINES SYSTEM CURRENT AND FUTURE END USER ANALYSIS, 2025–2034, (USD MILLION)
FIGURE 64 WESTERN EUROPE CNC MACHINES SYSTEM CURRENT AND FUTURE MARKET VOLUME SHARE REGIONAL ANALYSIS, 2025–2034, (USD MILLION)
FIGURE 65 GERMANY CNC MACHINES SYSTEM CURRENT AND FUTURE TYPE ANALYSIS, 2025–2034, (USD MILLION)
FIGURE 66 GERMANY CNC MACHINES SYSTEM CURRENT AND FUTURE END USER ANALYSIS, 2025–2034, (USD MILLION)
FIGURE 67 FRANCE CNC MACHINES SYSTEM CURRENT AND FUTURE TYPE ANALYSIS, 2025–2034, (USD MILLION)
FIGURE 68 FRANCE CNC MACHINES SYSTEM CURRENT AND FUTURE END USER ANALYSIS, 2025–2034, (USD MILLION)
FIGURE 69 UK CNC MACHINES SYSTEM CURRENT AND FUTURE TYPE ANALYSIS, 2025–2034, (USD MILLION)
FIGURE 70 UK CNC MACHINES SYSTEM CURRENT AND FUTURE END USER ANALYSIS, 2025–2034, (USD MILLION)
FIGURE 71 SPAIN CNC MACHINES SYSTEM CURRENT AND FUTURE TYPE ANALYSIS, 2025–2034, (USD MILLION)
FIGURE 72 SPAIN CNC MACHINES SYSTEM CURRENT AND FUTURE END USER ANALYSIS, 2025–2034, (USD MILLION)
FIGURE 73 ITALY CNC MACHINES SYSTEM CURRENT AND FUTURE TYPE ANALYSIS, 2025–2034, (USD MILLION)
FIGURE 74 ITALY CNC MACHINES SYSTEM CURRENT AND FUTURE END USER ANALYSIS, 2025–2034, (USD MILLION)
FIGURE 75 REST OF WESTERN EUROPE CNC MACHINES SYSTEM CURRENT AND FUTURE TYPE ANALYSIS, 2025–2034, (USD MILLION)
FIGURE 76 REST OF WESTERN EUROPE CNC MACHINES SYSTEM CURRENT AND FUTURE END USER ANALYSIS, 2025–2034, (USD MILLION)
FIGURE 77 EAST ASIA AND PACIFIC CNC MACHINES SYSTEM CURRENT AND FUTURE MARKET VOLUME SHARE REGIONAL ANALYSIS, 2025–2034, (USD MILLION)
FIGURE 78 CHINA CNC MACHINES SYSTEM CURRENT AND FUTURE TYPE ANALYSIS, 2025–2034, (USD MILLION)
FIGURE 79 CHINA CNC MACHINES SYSTEM CURRENT AND FUTURE END USER ANALYSIS, 2025–2034, (USD MILLION)
FIGURE 80 JAPAN CNC MACHINES SYSTEM CURRENT AND FUTURE TYPE ANALYSIS, 2025–2034, (USD MILLION)
FIGURE 81 JAPAN CNC MACHINES SYSTEM CURRENT AND FUTURE END USER ANALYSIS, 2025–2034, (USD MILLION)
FIGURE 82 AUSTRALIA CNC MACHINES SYSTEM CURRENT AND FUTURE TYPE ANALYSIS, 2025–2034, (USD MILLION)
FIGURE 83 AUSTRALIA CNC MACHINES SYSTEM CURRENT AND FUTURE END USER ANALYSIS, 2025–2034, (USD MILLION)
FIGURE 84 CAMBODIA CNC MACHINES SYSTEM CURRENT AND FUTURE TYPE ANALYSIS, 2025–2034, (USD MILLION)
FIGURE 85 CAMBODIA CNC MACHINES SYSTEM CURRENT AND FUTURE END USER ANALYSIS, 2025–2034, (USD MILLION)
FIGURE 86 FIJI CNC MACHINES SYSTEM CURRENT AND FUTURE TYPE ANALYSIS, 2025–2034, (USD MILLION)
FIGURE 87 FIJI CNC MACHINES SYSTEM CURRENT AND FUTURE END USER ANALYSIS, 2025–2034, (USD MILLION)
FIGURE 88 INDONESIA CNC MACHINES SYSTEM CURRENT AND FUTURE TYPE ANALYSIS, 2025–2034, (USD MILLION)
FIGURE 89 INDONESIA CNC MACHINES SYSTEM CURRENT AND FUTURE END USER ANALYSIS, 2025–2034, (USD MILLION)
FIGURE 90 SOUTH KOREA CNC MACHINES SYSTEM CURRENT AND FUTURE TYPE ANALYSIS, 2025–2034, (USD MILLION)
FIGURE 91 SOUTH KOREA CNC MACHINES SYSTEM CURRENT AND FUTURE END USER ANALYSIS, 2025–2034, (USD MILLION)
FIGURE 92 REST OF EAST ASIA AND PACIFIC CNC MACHINES SYSTEM CURRENT AND FUTURE TYPE ANALYSIS, 2025–2034, (USD MILLION)
FIGURE 93 REST OF EAST ASIA AND PACIFIC CNC MACHINES SYSTEM CURRENT AND FUTURE END USER ANALYSIS, 2025–2034, (USD MILLION)
FIGURE 94 SEA AND SOUTH ASIA CNC MACHINES SYSTEM CURRENT AND FUTURE MARKET VOLUME SHARE REGIONAL ANALYSIS, 2025–2034, (USD MILLION)
FIGURE 95 BANGLADESH CNC MACHINES SYSTEM CURRENT AND FUTURE TYPE ANALYSIS, 2025–2034, (USD MILLION)
FIGURE 96 BANGLADESH CNC MACHINES SYSTEM CURRENT AND FUTURE END USER ANALYSIS, 2025–2034, (USD MILLION)
FIGURE 97 NEW ZEALAND CNC MACHINES SYSTEM CURRENT AND FUTURE TYPE ANALYSIS, 2025–2034, (USD MILLION)
FIGURE 98 NEW ZEALAND CNC MACHINES SYSTEM CURRENT AND FUTURE END USER ANALYSIS, 2025–2034, (USD MILLION)
FIGURE 99 INDIA CNC MACHINES SYSTEM CURRENT AND FUTURE TYPE ANALYSIS, 2025–2034, (USD MILLION)
FIGURE 100 INDIA CNC MACHINES SYSTEM CURRENT AND FUTURE END USER ANALYSIS, 2025–2034, (USD MILLION)
FIGURE 101 SINGAPORE CNC MACHINES SYSTEM CURRENT AND FUTURE TYPE ANALYSIS, 2025–2034, (USD MILLION)
FIGURE 102 SINGAPORE CNC MACHINES SYSTEM CURRENT AND FUTURE END USER ANALYSIS, 2025–2034, (USD MILLION)
FIGURE 103 THAILAND CNC MACHINES SYSTEM CURRENT AND FUTURE TYPE ANALYSIS, 2025–2034, (USD MILLION)
FIGURE 104 THAILAND CNC MACHINES SYSTEM CURRENT AND FUTURE END USER ANALYSIS, 2025–2034, (USD MILLION)
FIGURE 105 TAIWAN CNC MACHINES SYSTEM CURRENT AND FUTURE TYPE ANALYSIS, 2025–2034, (USD MILLION)
FIGURE 106 TAIWAN CNC MACHINES SYSTEM CURRENT AND FUTURE END USER ANALYSIS, 2025–2034, (USD MILLION)
FIGURE 107 MALAYSIA CNC MACHINES SYSTEM CURRENT AND FUTURE TYPE ANALYSIS, 2025–2034, (USD MILLION)
FIGURE 108 MALAYSIA CNC MACHINES SYSTEM CURRENT AND FUTURE END USER ANALYSIS, 2025–2034, (USD MILLION)
FIGURE 109 REST OF SEA AND SOUTH ASIA CNC MACHINES SYSTEM CURRENT AND FUTURE TYPE ANALYSIS, 2025–2034, (USD MILLION)
FIGURE 110 REST OF SEA AND SOUTH ASIA CNC MACHINES SYSTEM CURRENT AND FUTURE END USER ANALYSIS, 2025–2034, (USD MILLION)
FIGURE 111 MIDDLE EAST AND AFRICA CNC MACHINES SYSTEM CURRENT AND FUTURE MARKET VOLUME SHARE REGIONAL ANALYSIS, 2025–2034, (USD MILLION)
FIGURE 112 GCC COUNTRIES CNC MACHINES SYSTEM CURRENT AND FUTURE TYPE ANALYSIS, 2025–2034, (USD MILLION)
FIGURE 113 GCC COUNTRIES CNC MACHINES SYSTEM CURRENT AND FUTURE END USER ANALYSIS, 2025–2034, (USD MILLION)
FIGURE 114 SAUDI ARABIA CNC MACHINES SYSTEM CURRENT AND FUTURE TYPE ANALYSIS, 2025–2034, (USD MILLION)
FIGURE 115 SAUDI ARABIA CNC MACHINES SYSTEM CURRENT AND FUTURE END USER ANALYSIS, 2025–2034, (USD MILLION)
FIGURE 116 UAE CNC MACHINES SYSTEM CURRENT AND FUTURE TYPE ANALYSIS, 2025–2034, (USD MILLION)
FIGURE 117 UAE CNC MACHINES SYSTEM CURRENT AND FUTURE END USER ANALYSIS, 2025–2034, (USD MILLION)
FIGURE 118 BAHRAIN CNC MACHINES SYSTEM CURRENT AND FUTURE TYPE ANALYSIS, 2025–2034, (USD MILLION)
FIGURE 119 BAHRAIN CNC MACHINES SYSTEM CURRENT AND FUTURE END USER ANALYSIS, 2025–2034, (USD MILLION)
FIGURE 120 KUWAIT CNC MACHINES SYSTEM CURRENT AND FUTURE TYPE ANALYSIS, 2025–2034, (USD MILLION)
FIGURE 121 KUWAIT CNC MACHINES SYSTEM CURRENT AND FUTURE END USER ANALYSIS, 2025–2034, (USD MILLION)
FIGURE 122 OMAN CNC MACHINES SYSTEM CURRENT AND FUTURE TYPE ANALYSIS, 2025–2034, (USD MILLION)
FIGURE 123 OMAN CNC MACHINES SYSTEM CURRENT AND FUTURE END USER ANALYSIS, 2025–2034, (USD MILLION)
FIGURE 124 QATAR CNC MACHINES SYSTEM CURRENT AND FUTURE TYPE ANALYSIS, 2025–2034, (USD MILLION)
FIGURE 125 QATAR CNC MACHINES SYSTEM CURRENT AND FUTURE END USER ANALYSIS, 2025–2034, (USD MILLION)
FIGURE 126 EGYPT CNC MACHINES SYSTEM CURRENT AND FUTURE TYPE ANALYSIS, 2025–2034, (USD MILLION)
FIGURE 127 EGYPT CNC MACHINES SYSTEM CURRENT AND FUTURE END USER ANALYSIS, 2025–2034, (USD MILLION)
FIGURE 128 NIGERIA CNC MACHINES SYSTEM CURRENT AND FUTURE TYPE ANALYSIS, 2025–2034, (USD MILLION)
FIGURE 129 NIGERIA CNC MACHINES SYSTEM CURRENT AND FUTURE END USER ANALYSIS, 2025–2034, (USD MILLION)
FIGURE 130 SOUTH AFRICA CNC MACHINES SYSTEM CURRENT AND FUTURE TYPE ANALYSIS, 2025–2034, (USD MILLION)
FIGURE 131 SOUTH AFRICA CNC MACHINES SYSTEM CURRENT AND FUTURE END USER ANALYSIS, 2025–2034, (USD MILLION)
FIGURE 132 ISRAEL CNC MACHINES SYSTEM CURRENT AND FUTURE TYPE ANALYSIS, 2025–2034, (USD MILLION)
FIGURE 133 ISRAEL CNC MACHINES SYSTEM CURRENT AND FUTURE END USER ANALYSIS, 2025–2034, (USD MILLION)
FIGURE 134 REST OF MEA CNC MACHINES SYSTEM CURRENT AND FUTURE TYPE ANALYSIS, 2025–2034, (USD MILLION)
FIGURE 135 REST OF MEA CNC MACHINES SYSTEM CURRENT AND FUTURE END USER ANALYSIS, 2025–2034, (USD MILLION)
FIGURE 136 U. S. MARKET SHARE ANALYSIS BY TYPE (2024)
FIGURE 137 U. S. MARKET SHARE ANALYSIS BY END USER (2024)
FIGURE 138 CANADA MARKET SHARE ANALYSIS BY TYPE (2024)
FIGURE 139 CANADA MARKET SHARE ANALYSIS BY END USER (2024)
FIGURE 140 MEXICO MARKET SHARE ANALYSIS BY TYPE (2024)
FIGURE 141 MEXICO MARKET SHARE ANALYSIS BY END USER (2024)
FIGURE 142 CHINA MARKET SHARE ANALYSIS BY TYPE (2024)
FIGURE 143 CHINA MARKET SHARE ANALYSIS BY END USER (2024)
FIGURE 144 JAPAN MARKET SHARE ANALYSIS BY TYPE (2024)
FIGURE 145 JAPAN MARKET SHARE ANALYSIS BY END USER (2024)
FIGURE 146 INDIA MARKET SHARE ANALYSIS BY TYPE (2024)
FIGURE 147 INDIA MARKET SHARE ANALYSIS BY END USER (2024)
FIGURE 148 SOUTH KOREA MARKET SHARE ANALYSIS BY TYPE (2024)
FIGURE 149 SOUTH KOREA MARKET SHARE ANALYSIS BY END USER (2024)
FIGURE 150 SAUDI ARABIA MARKET SHARE ANALYSIS BY TYPE (2024)
FIGURE 151 SAUDI ARABIA MARKET SHARE ANALYSIS BY END USER (2024)
FIGURE 152 UAE MARKET SHARE ANALYSIS BY TYPE (2024)
FIGURE 153 UAE MARKET SHARE ANALYSIS BY END USER (2024)
FIGURE 154 EGYPT MARKET SHARE ANALYSIS BY TYPE (2024)
FIGURE 155 EGYPT MARKET SHARE ANALYSIS BY END USER (2024)
FIGURE 156 NIGERIA MARKET SHARE ANALYSIS BY TYPE (2024)
FIGURE 157 NIGERIA MARKET SHARE ANALYSIS BY END USER (2024)
FIGURE 158 SOUTH AFRICA MARKET SHARE ANALYSIS BY TYPE (2024)
FIGURE 159 SOUTH AFRICA MARKET SHARE ANALYSIS BY END USER (2024)
FIGURE 160 GERMANY MARKET SHARE ANALYSIS BY TYPE (2024)
FIGURE 161 GERMANY MARKET SHARE ANALYSIS BY END USER (2024)
FIGURE 162 FRANCE MARKET SHARE ANALYSIS BY TYPE (2024)
FIGURE 163 FRANCE MARKET SHARE ANALYSIS BY END USER (2024)
FIGURE 164 UK MARKET SHARE ANALYSIS BY TYPE (2024)
FIGURE 165 UK MARKET SHARE ANALYSIS BY END USER (2024)
FIGURE 166 SPAIN MARKET SHARE ANALYSIS BY TYPE (2024)
FIGURE 167 SPAIN MARKET SHARE ANALYSIS BY END USER (2024)
FIGURE 168 ITALY MARKET SHARE ANALYSIS BY TYPE (2024)
FIGURE 169 ITALY MARKET SHARE ANALYSIS BY END USER (2024)
FIGURE 170 BRAZIL MARKET SHARE ANALYSIS BY TYPE (2024)
FIGURE 171 BRAZIL MARKET SHARE ANALYSIS BY END USER (2024)
FIGURE 172 ARGENTINA MARKET SHARE ANALYSIS BY TYPE (2024)
FIGURE 173 ARGENTINA MARKET SHARE ANALYSIS BY END USER (2024)
FIGURE 174 COLUMBIA MARKET SHARE ANALYSIS BY TYPE (2024)
FIGURE 175 COLUMBIA MARKET SHARE ANALYSIS BY END USER (2024)
FIGURE 176 GLOBAL CNC MACHINES SYSTEM CURRENT AND FUTURE MARKET KEY COUNTRY LEVEL ANALYSIS, 2024–2034, (USD MILLION)
FIGURE 177 FINANCIAL OVERVIEW:
Key Player Analysis
Amada Machinery Co., Ltd.: Amada Machinery (band saws, grinders, precision cutting) benefits from the parent group’s scale in sheet-metal systems and global service coverage. In FY ended March 2025, Amada reported ¥396.7 billion in consolidated revenue (-1.7% YoY), with North America and Europe together accounting for ~50% of sales—an indicator of resilient demand for fiber-laser cutting, press brakes, and automation even amid capex caution. Strategic priorities include deeper software integration, lights-out cells, and lifecycle services to stabilize margins. The company’s geographic mix and robust balance sheet position it to bundle machines with automated storage and digital monitoring, compressing customer payback cycles in 2025–2027.
Amera Seiki: Founded in 1991, Amera Seiki markets a broad lineup—vertical/horizontal machining centers, bridge mills, horizontal borers, and CNC lathes—competing on customization, delivery, and service responsiveness. Its model blends imported platforms with U.S. application support and field service, appealing to job shops and contract manufacturers prioritizing uptime and TCO. The company’s emphasis on heavy-duty bridge mills and large-part horizontals aligns with U.S. reshoring and infrastructure programs, while financing and retrofit packages help SMEs adopt automation without full Greenfield spend.
DMG MORI Co., Ltd.: Through the DMG MORI AG group, the company posted €2.23 billion in 2024 sales revenues, with €1.24 billion from machine tools and €985 million from industrial services—illustrating a balanced mix of new equipment and high-margin aftermarket. Order intake in 2024 totaled €2.26 billion across segments, reflecting a disciplined focus on automation, 5-axis and mill-turn platforms, and software-enabled services (e.g., digital monitoring and process optimization). Strategic execution is centered on standardized modules, regional assembly, and a growing installed-base monetization model, positioning DMG MORI to capture AI-assisted machining and predictive maintenance spend through 2026.
General Technology Group (Genertec): Machine Tool Platforms (incl. Dalian Machine Tool & Shenyang Machine Tool): Genertec, a centrally administered Chinese SOE under SASAC, has integrated legacy assets such as Dalian Machine Tool and Shenyang Machine Tool to rebuild national capability in mid- to high-end CNC. The subsidiaries maintain broad catalogs in turning, milling, flexible lines, and automation, anchored by extensive domestic manufacturing footprints.
At the same time, China’s push to localize high-precision CNC remains uneven: foreign vendors still command ~two-thirds of China’s high-end machine tool market, and sector profitability has been pressured by intense price competition and consolidation. For Genertec, this creates a dual mandate—gain share in mainstream segments while climbing the technology stack via controls, software, and higher-tolerance platforms. Geopolitical and compliance risks also shape execution; select Genertec-related machine tool entities have appeared on Western sanctions lists in 2025, increasing diligence requirements for cross-border deals and component sourcing.
Market Key Players
Hurco Companies, Inc.
Shenyang Machine Tool Part Co., Ltd.
Okuma Corporation
General Technology Group
Haas Automation, Inc.
Fanuc Corporation
Yamazaki Mazak Corporation
Amada Machinery Co., Ltd.
Dalian Machine Tool Corporation
Amera Seiki
DMG Mori Co., Ltd.
Datron AG
Driver:
Automation-Ready CNC Systems Driving Productivity and Precision
As of 2025, capital spending in discrete manufacturing is pivoting toward automation-ready, high-precision cells, making CNC technology a core lever for throughput and quality. The key catalyst is the integration of CNC with Industry 4.0 stacks—robotic tending, pallet systems, in-process metrology, and connected controls (e.g., Siemens Sinumerik, FANUC, Heidenhain). Plants operating at 60–80% OEE typically realize 10–15% throughput gains, 8–12% scrap reduction, and 20–30% shorter changeovers after CNC upgrades. Rising demand for tight-tolerance components in EV powertrains, aerospace structures, and medical implants is accelerating the shift to multi-axis (5-axis and mill-turn) platforms; in many bids, these machines already account for >30% of new system sales. Strategically, this performance delta compresses payback periods and shifts competition toward vendors with strong software, automation ecosystems, and service coverage.
Restraint:
High Capital Costs and Skill Gaps Slowing CNC Adoption
High capital intensity and integration complexity remain binding constraints, particularly for SMEs. A typical multi-axis cell with automation can require USD 0.3–1.0 million in upfront investment, while brownfield integration adds 8–12% to project costs for power, fixturing, safety, and connectivity upgrades. Skills scarcity compounds the issue: vacancy rates for CNC programmers and metrology specialists are ~1.5× the manufacturing average, elongating commissioning by 4–8 weeks. Cyber exposure in connected shops is another drag; shops report rising audit and software costs as they harden networks and segment machine traffic. Finally, supply-chain frictions—servo drives, spindles, and premium tooling—continue to push lead times into the 14–26 week range, delaying revenue realization and dampening smaller buyers’ adoption cycles.
Opportunity:
Hybrid Manufacturing and Retrofits Creating New Revenue Opportunities
Hybrid and digital-first workflows are opening new profit pools. Additive–subtractive cells for tooling, aerospace brackets, and high-mix spares are projected to grow at a 15–18% CAGR through 2030, capturing work previously split across multiple process steps. The installed-base retrofit market—controls, probes, drives, and monitoring—offers a sizable annuity, with service/software revenues expected to exceed USD 15–20 billion globally by 2030 as attach rates for condition monitoring and analytics surpass 60%. Compact CNC platforms aimed at startups and local suppliers broaden access in India, ASEAN, and Mexico, while financing models (leasing, pay-per-use) lower barriers to entry. Strategically, vendors that bundle automation, applications engineering, and uptime guarantees will capture outsized wallet share and lock in multi-year service streams.
Trend:
AI-Driven Machining and Digital Twins Transforming CNC Operations
AI-enabled machining and virtualized operations are moving from pilots to scale. Toolpath optimization, adaptive feeds/speeds, and predictive spindle analytics routinely deliver 5–10% spindle-uptime gains and 10–20% extensions in tool life; digital twins cut new-product introduction time by 20–30% by de-risking fixtures and programs before metal-cut. Open, interoperable data (MTConnect/OPC UA) is becoming table stakes, with an estimated ~40% of new machines shipping “connectivity-ready” by 2026. Workforce development is also digitizing: AR/VR training reduces ramp-up time by 30–40% and limits scrap during onboarding. Layered onto a tightening sustainability agenda—coolant-optimized strategies, dry machining where feasible, and energy-aware scheduling—these trends are redefining competitive moats toward software-rich, service-centric machine tool platforms.
Recent Developments
Dec 2024 – DMG MORI: Partnered with Rowan University (U.S.) to co-develop workforce programs in advanced and additive manufacturing, including internships at DMG MORI’s Illinois and California sites and curriculum aligned to digitalized machining. Strategic impact: Builds a U.S. talent pipeline and deepens customer engagement around MX (Machining Transformation) workflows.
Dec 2024 – Yamazaki Mazak: Hosted a UK open house drawing 500+ visitors from 240+ firms, showcasing 20+ live-cut machines and unveiling the HQR-200/3 NEO alongside automation-ready CV5-500 and VCN-600 cells. Strategic impact: Reinforces demand for mid-market automation packages and refreshes the UK order pipeline heading into 2025.
Jan 2025 – Haas Automation: Agreed to pay >$2.5 million in combined civil penalties to BIS and OFAC for export-control and sanctions violations, including 41 admitted EAR violations tied to Entity-Listed parties in China and Russia. Strategic impact: Raises compliance thresholds and due-diligence costs across the CNC value chain, particularly for distributors serving sensitive end-markets.
Mar 2025 – DMG MORI AG: Reported FY2024 results: order intake €2,256.6m (–13%), sales €2,228.3m (–11%), EBIT margin 11.0% (+180 bps), and free cash flow €117m (+25%); reiterated focus on MX strategy, 34 innovations, and selective capacity investments. Strategic impact: Margin resilience and product cadence support mix shift toward automation and software-enabled services in 2025.
Jun 2025 – FANUC: Introduced the M-800/60-20B high-accuracy robot (±0.1 mm path accuracy, 60 kg payload) with the new R-50iA controller, targeting 3D laser cutting, milling, and drilling as a cost-effective complement to certain CNC operations. Strategic impact: Accelerates robot–CNC convergence, pressuring low-complexity machining niches and expanding FANUC’s role in hybrid cells.
Sep 2025 – AMADA: Rolled out the ORSUS-AJe fiber-laser platform (global rollout initiated June 2025), positioned as an entry point for high-speed precision cutting with 3–8 kW options and ecosystem integration. Strategic impact: Expands AMADA’s addressable base in cost-sensitive markets and strengthens cross-sell into press brakes, software, and automation.