Coagulation Analyzer Market Size | Growth Outlook & 7.3% CAGR
Global Coagulation Analyzer Market Size, Share & Analysis By Product Type (Analyser, consumables), By Technology (Optical, Mechanical, Electrochemical, Others), By Test Type (Fibrinogen Testing, Prothrombin Time Testing, D-dimer Testing, Others), By End-User Industry Regions & Key Players – Hemostasis Testing Trends & Forecast 2025–2034
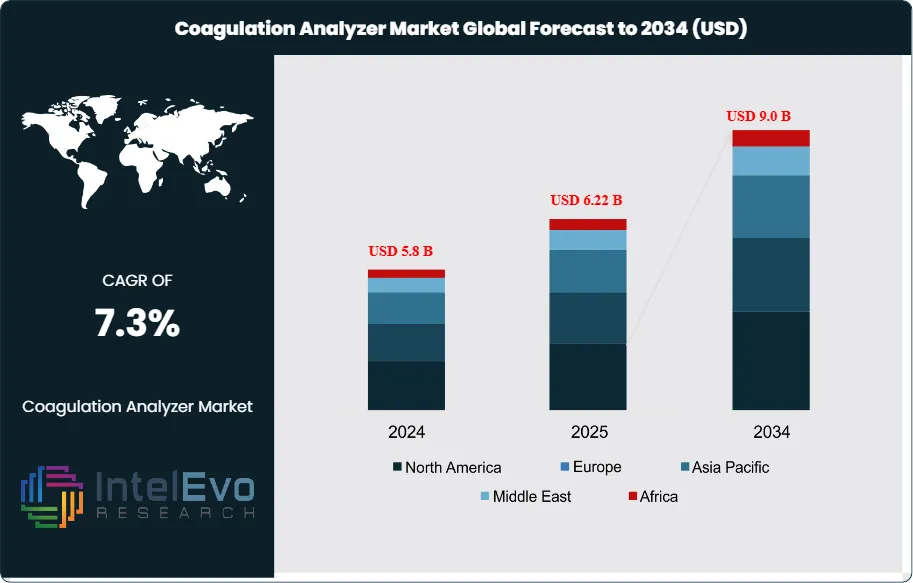
The Coagulation Analyzer Market is estimated at US$ 5.8 billion in 2024 and is on track to reach approximately US$ 9.0 billion by 2034, reflecting a steady CAGR of 7.3% from 2025–2034. Growth is fueled by rising global cases of cardiovascular disorders, diabetes, and blood clotting abnormalities, driving demand for rapid and accurate coagulation testing. Hospitals and diagnostic centers are increasingly adopting fully automated analyzers to improve workflow efficiency and reduce result turnaround time. With the expansion of point-of-care testing, AI-supported diagnostics, and decentralized lab models, the coagulation analyzer market is gaining strong visibility across healthcare innovation channels and trending across clinical, digital health, and med-tech ecosystems.
The market has grown steadily in recent years, supported by rising clinical demand for precise blood coagulation diagnostics. Historically driven by hospital-based testing, the sector is now expanding into decentralized and outpatient settings as healthcare systems prioritize faster diagnostics and early intervention. This shift aligns with a broader push for improved management of clotting disorders such as hemophilia, deep vein thrombosis, and pulmonary embolism, which account for a growing share of morbidity worldwide.
Demand is primarily fueled by the increasing prevalence of cardiovascular and hematologic diseases, an aging global population, and the need for coagulation monitoring during complex surgeries. Public health campaigns and organizations like the National Blood Clot Alliance (NBCA) have also played a role in raising awareness of thrombosis-related complications, encouraging proactive screening. As a result, diagnostic protocols are being revised across hospitals and clinics to include routine coagulation testing, particularly for high-risk patients.
From a technology standpoint, the market is transitioning toward fully automated and point-of-care coagulation analyzers. These systems shorten test turnaround times, reduce manual error, and integrate seamlessly with electronic health record (EHR) platforms. Connectivity features support real-time data access and centralized patient monitoring, allowing providers to improve treatment precision and reduce operating costs. These advances are particularly relevant in high-volume clinical laboratories and intensive care units, where time and accuracy are critical.
Regionally, North America dominates the market due to advanced healthcare infrastructure, higher diagnostic budgets, and early adoption of automated testing solutions. Europe follows closely, with strong government support for preventive care. However, Asia-Pacific is emerging as a high-growth region, driven by expanding healthcare access, rising disease burden, and increased investment in medical devices. Countries like China and India present untapped potential for manufacturers seeking long-term growth.
As regulatory frameworks evolve and hospitals look to enhance diagnostic efficiency, the coagulation analyzer market is positioned for sustained growth. Companies that offer reliable, integrated, and scalable testing solutions will be best placed to capitalize on this trend through 2034.
Key Takeaways
Market Growth: The global coagulation analyzer market generated US$ 5.8 billion in revenue in 2024 and is projected to reach US$ 9.0 billion by 2034, registering a CAGR of 7.3%. Growth is driven by rising incidence of clotting disorders and increased demand for automated diagnostic tools.
Product Type: Analyzers accounted for 57.3% of the market share in 2024, outperforming consumables. Their dominance reflects increasing demand for high-throughput and automated testing systems in hospital laboratories.
Technology: Optical technology led with a 44.6% share in 2024, supported by its accuracy in detecting coagulation endpoints and widespread adoption in both clinical and research settings.
Test Type: Prothrombin time testing held the highest revenue share at 39.2% in 2024, due to its routine use in monitoring anticoagulant therapy and detecting clotting abnormalities.
End Use: Hospitals and clinics led the end-user segment with a 52.9% revenue share in 2024, driven by high patient volumes and greater availability of advanced diagnostic infrastructure.
Driver: The rising global burden of cardiovascular diseases and surgical procedures requiring coagulation monitoring is fueling demand, particularly in acute care environments.
Restraint: High capital costs associated with advanced coagulation analyzers limit adoption in low-resource settings, constraining growth in some emerging markets.
Opportunity: Asia-Pacific presents strong growth potential, with increasing healthcare investments and expanding diagnostic access. The region is projected to see a double-digit CAGR through 2034.
Trend: Point-of-care testing is gaining traction, driven by the need for rapid diagnostics. Manufacturers are integrating analyzers with EHR systems to enhance clinical workflows and reduce turnaround times.
Regional Analysis: North America led the market with a 41.3% share in 2024, backed by advanced healthcare systems and early adoption of diagnostic technologies. Asia-Pacific is the fastest-growing region, supported by expanding infrastructure and rising awareness of coagulation-related disorders.
Product Type Analysis
Analyzers held the dominant share of the coagulation analyzer market in 2024, accounting for 57.3% of global revenue. Their continued lead into 2025 and beyond reflects growing demand for efficient, high-precision diagnostic tools across clinical settings. These devices are essential in managing coagulation disorders and monitoring patients on anticoagulant therapy, especially as global incidences of stroke, deep vein thrombosis, and hemophilia continue to rise. Hospitals and diagnostic centers are increasingly adopting automated analyzers that offer rapid turnaround, reduced manual intervention, and enhanced diagnostic accuracy.
The segment is also benefiting from advancements in workflow automation and system integration, particularly within larger healthcare facilities. Modern analyzers now support higher throughput and connectivity with electronic medical records, improving both diagnostic speed and data accessibility. As healthcare systems focus on operational efficiency and early-stage intervention, demand for next-gen coagulation analyzers is expected to grow steadily throughout the forecast period.
Technology Analysis
Optical technology led the market in 2024, capturing 44.6% of total revenue. This trend is expected to continue due to its reliability in delivering real-time, high-precision coagulation measurements. Optical analyzers are favored in high-volume labs for their lower maintenance requirements and superior sensitivity. These systems also align well with the shift toward automated diagnostics, where speed and accuracy are critical to clinical decision-making.
As more providers move toward personalized care plans, optical analyzers are gaining traction for their ability to deliver consistent, repeatable results, particularly for high-risk patients. Their integration into automated lab environments is also supporting workflow efficiency, making them the preferred choice in both developed and rapidly modernizing healthcare markets.
Test Type Analysis
Prothrombin time (PT) testing held the highest market share among test types in 2024, contributing 39.2% to global revenue. Its widespread adoption stems from its essential role in managing anticoagulant therapy and detecting bleeding and clotting abnormalities. PT testing is a routine requirement for patients with atrial fibrillation, mechanical heart valves, and other cardiovascular conditions that necessitate long-term anticoagulation.
The growing shift toward point-of-care diagnostics is further propelling this segment. PT testing devices that offer quick, accurate results are increasingly deployed in outpatient clinics, emergency settings, and even home care, reducing complications and improving treatment adherence. As demand rises for personalized and preventive healthcare, this segment is likely to remain a key driver of market expansion.
End-User Analysis
Hospitals and clinics led the end-user segment in 2024 with a 52.9% revenue share, reflecting their role as primary users of high-throughput coagulation analyzers. The growing number of hospital admissions related to cardiovascular, diabetic, and hematologic conditions is driving the need for rapid coagulation testing to guide treatment decisions. In particular, tertiary care hospitals and specialized cardiac centers rely heavily on these diagnostics for surgical monitoring and therapeutic management.
As healthcare systems globally adopt more advanced diagnostic protocols, hospitals are expected to continue investing in automated coagulation platforms that reduce turnaround time and improve care quality. Meanwhile, clinics and outpatient centers are following suit, particularly in urban areas where demand for preventive diagnostics is accelerating. This trend is expected to maintain hospital and clinic dominance through the forecast period.
Regional Analysis
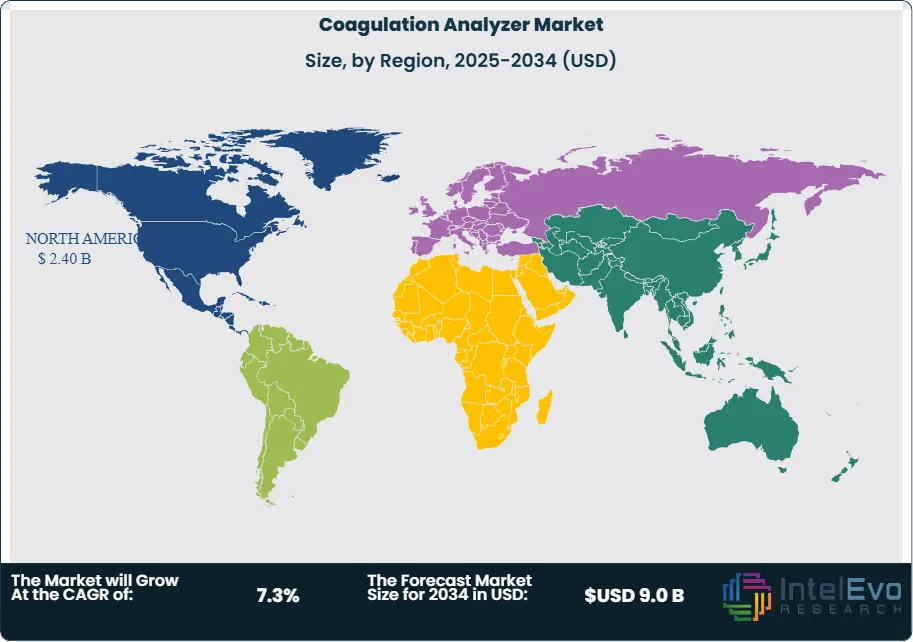
North America led the global coagulation analyzer market in 2024, accounting for 41.3% of total revenue. Growth in the region is underpinned by a well-established healthcare system, early technology adoption, and a rising geriatric population with higher susceptibility to clotting disorders. The U.S. and Canada have seen increased integration of AI-powered diagnostic systems and fully automated analyzers that support faster, more accurate testing across hospitals and laboratories. Strategic partnerships between device manufacturers and health systems continue to expand access to advanced solutions.
In contrast, Asia Pacific is projected to post the highest CAGR through 2034, driven by rising healthcare expenditure and significant infrastructure development in countries such as China, India, and Indonesia. These markets are witnessing increased adoption of point-of-care testing and automated diagnostics to address rising caseloads of diabetes, cardiovascular diseases, and stroke. Public health initiatives aimed at early detection, along with growing private sector investment in diagnostic services, are expected to fuel robust regional growth.
Latin America and the Middle East & Africa are also emerging as growth regions, albeit from a lower base. Increased awareness, improving reimbursement frameworks, and expanding private healthcare services are supporting market expansion in these geographies, especially in urban centers with growing access to diagnostic technologies.
By Product Type (Analyser, consumables), By Technology (Optical, Mechanical, Electrochemical, Others), By Test Type (Fibrinogen Testing, Prothrombin Time Testing, D-dimer Testing, Others), By End-user (Hospitals & Clinics, Diagnostic Centers, Others)
Research Methodology
Primary Research- 100 Interviews of Stakeholders
Secondary Research
Desk Research
Regional scope
North America (United States, Canada, Mexico)
Latin America (Brazil, Argentina, Columbia)
East Asia And Pacific (China, Japan, South Korea, Australia, Cambodia, Fiji, Indonesia)
Sea And South Asia (India, Singapore, Thailand, Taiwan, Malaysia)
Eastern Europe (Poland, Russia, Czech Republic, Romania)
Western Europe (Germany, U.K., France, Spain, Itlay)
Middle East & Africa (GCC Countries, Egypt, Nigeria, South Africa, Israel)
Customization for segments, region/country-level will be provided. Moreover, additional customization can be done based on the requirements.
Pricing and Purchase Options
Avail customized purchase options to meet your exact research needs. We have three licenses to opt for: Single User License, Multi-User License (Up to 5 Users), Corporate Use License (Unlimited User and Printable PDF).
TABLE OF CONTENTS
1. EXECUTIVE SUMMARY
1.1. MARKET SNAPSHOT
1.2. KEY FINDINGS & INSIGHTS
1.3. ANALYST RECOMMENDATIONS
1.4. FUTURE OUTLOOK
2. RESEARCH METHODOLOGY
2.1. MARKET DEFINITION & SCOPE
2.2. RESEARCH OBJECTIVES: PRIMARY & SECONDARY DATA SOURCES
2.3. DATA COLLECTION SOURCES
2.3.1. COVERAGE OF 100+ PRIMARY RESEARCH/CONSULTATION CALLS WITH INDUSTRY STAKEHOLDERS
FIGURE 17 NORTH AMERICA COAGULATION ANALYZER CURRENT AND FUTURE TYPE ANALYSIS, 2025–2034, (USD MILLION)
FIGURE 18 NORTH AMERICA COAGULATION ANALYZER CURRENT AND FUTURE END USER ANALYSIS, 2025–2034, (USD MILLION)
FIGURE 19 MARKET SHARE BY COUNTRY
FIGURE 20 LATIN AMERICA COAGULATION ANALYZER CURRENT AND FUTURE TYPE ANALYSIS, 2025–2034, (USD MILLION)
FIGURE 21 LATIN AMERICA COAGULATION ANALYZER CURRENT AND FUTURE END USER ANALYSIS, 2025–2034, (USD MILLION)
FIGURE 22 MARKET SHARE BY COUNTRY
FIGURE 23 EASTERN EUROPE COAGULATION ANALYZER CURRENT AND FUTURE TYPE ANALYSIS, 2025–2034, (USD MILLION)
FIGURE 24 EASTERN EUROPE COAGULATION ANALYZER CURRENT AND FUTURE END USER ANALYSIS, 2025–2034, (USD MILLION)
FIGURE 25 MARKET SHARE BY COUNTRY
FIGURE 26 WESTERN EUROPE COAGULATION ANALYZER CURRENT AND FUTURE TYPE ANALYSIS, 2025–2034, (USD MILLION)
FIGURE 27 WESTERN EUROPE COAGULATION ANALYZER CURRENT AND FUTURE END USER ANALYSIS, 2025–2034, (USD MILLION)
FIGURE 28 MARKET SHARE BY COUNTRY
FIGURE 29 EAST ASIA AND PACIFIC COAGULATION ANALYZER CURRENT AND FUTURE TYPE ANALYSIS, 2025–2034, (USD MILLION)
FIGURE 30 EAST ASIA AND PACIFIC COAGULATION ANALYZER CURRENT AND FUTURE END USER ANALYSIS, 2025–2034, (USD MILLION)
FIGURE 31 MARKET SHARE BY COUNTRY
FIGURE 32 SEA AND SOUTH ASIA COAGULATION ANALYZER CURRENT AND FUTURE TYPE ANALYSIS, 2025–2034, (USD MILLION)
FIGURE 33 SEA AND SOUTH ASIA COAGULATION ANALYZER CURRENT AND FUTURE END USER ANALYSIS, 2025–2034, (USD MILLION)
FIGURE 34 MARKET SHARE BY COUNTRY
FIGURE 35 MIDDLE EAST AND AFRICA COAGULATION ANALYZER CURRENT AND FUTURE TYPE ANALYSIS, 2025–2034, (USD MILLION)
FIGURE 36 MIDDLE EAST AND AFRICA COAGULATION ANALYZER CURRENT AND FUTURE END USER ANALYSIS, 2025–2034, (USD MILLION)
FIGURE 37 NORTH AMERICA COAGULATION ANALYZER CURRENT AND FUTURE MARKET VOLUME SHARE REGIONAL ANALYSIS, 2025–2034, (USD MILLION)
FIGURE 38 U.S. COAGULATION ANALYZER CURRENT AND FUTURE TYPE ANALYSIS, 2025–2034, (USD MILLION)
FIGURE 39 U.S. COAGULATION ANALYZER CURRENT AND FUTURE END USER ANALYSIS, 2025–2034, (USD MILLION)
FIGURE 40 CANADA COAGULATION ANALYZER CURRENT AND FUTURE TYPE ANALYSIS, 2025–2034, (USD MILLION)
FIGURE 41 CANADA COAGULATION ANALYZER CURRENT AND FUTURE END USER ANALYSIS, 2025–2034, (USD MILLION)
FIGURE 42 LATIN AMERICA COAGULATION ANALYZER CURRENT AND FUTURE MARKET VOLUME SHARE REGIONAL ANALYSIS, 2025–2034, (USD MILLION)
FIGURE 43 MEXICO COAGULATION ANALYZER CURRENT AND FUTURE TYPE ANALYSIS, 2025–2034, (USD MILLION)
FIGURE 44 MEXICO COAGULATION ANALYZER CURRENT AND FUTURE END USER ANALYSIS, 2025–2034, (USD MILLION)
FIGURE 45 BRAZIL COAGULATION ANALYZER CURRENT AND FUTURE TYPE ANALYSIS, 2025–2034, (USD MILLION)
FIGURE 46 BRAZIL COAGULATION ANALYZER CURRENT AND FUTURE END USER ANALYSIS, 2025–2034, (USD MILLION)
FIGURE 47 ARGENTINA COAGULATION ANALYZER CURRENT AND FUTURE TYPE ANALYSIS, 2025–2034, (USD MILLION)
FIGURE 48 ARGENTINA COAGULATION ANALYZER CURRENT AND FUTURE END USER ANALYSIS, 2025–2034, (USD MILLION)
FIGURE 49 COLUMBIA COAGULATION ANALYZER CURRENT AND FUTURE TYPE ANALYSIS, 2025–2034, (USD MILLION)
FIGURE 50 COLUMBIA COAGULATION ANALYZER CURRENT AND FUTURE END USER ANALYSIS, 2025–2034, (USD MILLION)
FIGURE 51 REST OF LATIN AMERICA COAGULATION ANALYZER CURRENT AND FUTURE TYPE ANALYSIS, 2025–2034, (USD MILLION)
FIGURE 52 REST OF LATIN AMERICA COAGULATION ANALYZER CURRENT AND FUTURE END USER ANALYSIS, 2025–2034, (USD MILLION)
FIGURE 53 EASTERN EUROPE COAGULATION ANALYZER CURRENT AND FUTURE MARKET VOLUME SHARE REGIONAL ANALYSIS, 2025–2034, (USD MILLION)
FIGURE 54 POLAND COAGULATION ANALYZER CURRENT AND FUTURE TYPE ANALYSIS, 2025–2034, (USD MILLION)
FIGURE 55 POLAND COAGULATION ANALYZER CURRENT AND FUTURE END USER ANALYSIS, 2025–2034, (USD MILLION)
FIGURE 56 RUSSIA COAGULATION ANALYZER CURRENT AND FUTURE TYPE ANALYSIS, 2025–2034, (USD MILLION)
FIGURE 57 RUSSIA COAGULATION ANALYZER CURRENT AND FUTURE END USER ANALYSIS, 2025–2034, (USD MILLION)
FIGURE 58 CZECH REPUBLIC COAGULATION ANALYZER CURRENT AND FUTURE TYPE ANALYSIS, 2025–2034, (USD MILLION)
FIGURE 59 CZECH REPUBLIC COAGULATION ANALYZER CURRENT AND FUTURE END USER ANALYSIS, 2025–2034, (USD MILLION)
FIGURE 60 ROMANIA COAGULATION ANALYZER CURRENT AND FUTURE TYPE ANALYSIS, 2025–2034, (USD MILLION)
FIGURE 61 ROMANIA COAGULATION ANALYZER CURRENT AND FUTURE END USER ANALYSIS, 2025–2034, (USD MILLION)
FIGURE 62 REST OF EASTERN EUROPE COAGULATION ANALYZER CURRENT AND FUTURE TYPE ANALYSIS, 2025–2034, (USD MILLION)
FIGURE 63 REST OF EASTERN EUROPE COAGULATION ANALYZER CURRENT AND FUTURE END USER ANALYSIS, 2025–2034, (USD MILLION)
FIGURE 64 WESTERN EUROPE COAGULATION ANALYZER CURRENT AND FUTURE MARKET VOLUME SHARE REGIONAL ANALYSIS, 2025–2034, (USD MILLION)
FIGURE 65 GERMANY COAGULATION ANALYZER CURRENT AND FUTURE TYPE ANALYSIS, 2025–2034, (USD MILLION)
FIGURE 66 GERMANY COAGULATION ANALYZER CURRENT AND FUTURE END USER ANALYSIS, 2025–2034, (USD MILLION)
FIGURE 67 FRANCE COAGULATION ANALYZER CURRENT AND FUTURE TYPE ANALYSIS, 2025–2034, (USD MILLION)
FIGURE 68 FRANCE COAGULATION ANALYZER CURRENT AND FUTURE END USER ANALYSIS, 2025–2034, (USD MILLION)
FIGURE 69 UK COAGULATION ANALYZER CURRENT AND FUTURE TYPE ANALYSIS, 2025–2034, (USD MILLION)
FIGURE 70 UK COAGULATION ANALYZER CURRENT AND FUTURE END USER ANALYSIS, 2025–2034, (USD MILLION)
FIGURE 71 SPAIN COAGULATION ANALYZER CURRENT AND FUTURE TYPE ANALYSIS, 2025–2034, (USD MILLION)
FIGURE 72 SPAIN COAGULATION ANALYZER CURRENT AND FUTURE END USER ANALYSIS, 2025–2034, (USD MILLION)
FIGURE 73 ITALY COAGULATION ANALYZER CURRENT AND FUTURE TYPE ANALYSIS, 2025–2034, (USD MILLION)
FIGURE 74 ITALY COAGULATION ANALYZER CURRENT AND FUTURE END USER ANALYSIS, 2025–2034, (USD MILLION)
FIGURE 75 REST OF WESTERN EUROPE COAGULATION ANALYZER CURRENT AND FUTURE TYPE ANALYSIS, 2025–2034, (USD MILLION)
FIGURE 76 REST OF WESTERN EUROPE COAGULATION ANALYZER CURRENT AND FUTURE END USER ANALYSIS, 2025–2034, (USD MILLION)
FIGURE 77 EAST ASIA AND PACIFIC COAGULATION ANALYZER CURRENT AND FUTURE MARKET VOLUME SHARE REGIONAL ANALYSIS, 2025–2034, (USD MILLION)
FIGURE 78 CHINA COAGULATION ANALYZER CURRENT AND FUTURE TYPE ANALYSIS, 2025–2034, (USD MILLION)
FIGURE 79 CHINA COAGULATION ANALYZER CURRENT AND FUTURE END USER ANALYSIS, 2025–2034, (USD MILLION)
FIGURE 80 JAPAN COAGULATION ANALYZER CURRENT AND FUTURE TYPE ANALYSIS, 2025–2034, (USD MILLION)
FIGURE 81 JAPAN COAGULATION ANALYZER CURRENT AND FUTURE END USER ANALYSIS, 2025–2034, (USD MILLION)
FIGURE 82 AUSTRALIA COAGULATION ANALYZER CURRENT AND FUTURE TYPE ANALYSIS, 2025–2034, (USD MILLION)
FIGURE 83 AUSTRALIA COAGULATION ANALYZER CURRENT AND FUTURE END USER ANALYSIS, 2025–2034, (USD MILLION)
FIGURE 84 CAMBODIA COAGULATION ANALYZER CURRENT AND FUTURE TYPE ANALYSIS, 2025–2034, (USD MILLION)
FIGURE 85 CAMBODIA COAGULATION ANALYZER CURRENT AND FUTURE END USER ANALYSIS, 2025–2034, (USD MILLION)
FIGURE 86 FIJI COAGULATION ANALYZER CURRENT AND FUTURE TYPE ANALYSIS, 2025–2034, (USD MILLION)
FIGURE 87 FIJI COAGULATION ANALYZER CURRENT AND FUTURE END USER ANALYSIS, 2025–2034, (USD MILLION)
FIGURE 88 INDONESIA COAGULATION ANALYZER CURRENT AND FUTURE TYPE ANALYSIS, 2025–2034, (USD MILLION)
FIGURE 89 INDONESIA COAGULATION ANALYZER CURRENT AND FUTURE END USER ANALYSIS, 2025–2034, (USD MILLION)
FIGURE 90 SOUTH KOREA COAGULATION ANALYZER CURRENT AND FUTURE TYPE ANALYSIS, 2025–2034, (USD MILLION)
FIGURE 91 SOUTH KOREA COAGULATION ANALYZER CURRENT AND FUTURE END USER ANALYSIS, 2025–2034, (USD MILLION)
FIGURE 92 REST OF EAST ASIA AND PACIFIC COAGULATION ANALYZER CURRENT AND FUTURE TYPE ANALYSIS, 2025–2034, (USD MILLION)
FIGURE 93 REST OF EAST ASIA AND PACIFIC COAGULATION ANALYZER CURRENT AND FUTURE END USER ANALYSIS, 2025–2034, (USD MILLION)
FIGURE 94 SEA AND SOUTH ASIA COAGULATION ANALYZER CURRENT AND FUTURE MARKET VOLUME SHARE REGIONAL ANALYSIS, 2025–2034, (USD MILLION)
FIGURE 95 BANGLADESH COAGULATION ANALYZER CURRENT AND FUTURE TYPE ANALYSIS, 2025–2034, (USD MILLION)
FIGURE 96 BANGLADESH COAGULATION ANALYZER CURRENT AND FUTURE END USER ANALYSIS, 2025–2034, (USD MILLION)
FIGURE 97 NEW ZEALAND COAGULATION ANALYZER CURRENT AND FUTURE TYPE ANALYSIS, 2025–2034, (USD MILLION)
FIGURE 98 NEW ZEALAND COAGULATION ANALYZER CURRENT AND FUTURE END USER ANALYSIS, 2025–2034, (USD MILLION)
FIGURE 99 INDIA COAGULATION ANALYZER CURRENT AND FUTURE TYPE ANALYSIS, 2025–2034, (USD MILLION)
FIGURE 100 INDIA COAGULATION ANALYZER CURRENT AND FUTURE END USER ANALYSIS, 2025–2034, (USD MILLION)
FIGURE 101 SINGAPORE COAGULATION ANALYZER CURRENT AND FUTURE TYPE ANALYSIS, 2025–2034, (USD MILLION)
FIGURE 102 SINGAPORE COAGULATION ANALYZER CURRENT AND FUTURE END USER ANALYSIS, 2025–2034, (USD MILLION)
FIGURE 103 THAILAND COAGULATION ANALYZER CURRENT AND FUTURE TYPE ANALYSIS, 2025–2034, (USD MILLION)
FIGURE 104 THAILAND COAGULATION ANALYZER CURRENT AND FUTURE END USER ANALYSIS, 2025–2034, (USD MILLION)
FIGURE 105 TAIWAN COAGULATION ANALYZER CURRENT AND FUTURE TYPE ANALYSIS, 2025–2034, (USD MILLION)
FIGURE 106 TAIWAN COAGULATION ANALYZER CURRENT AND FUTURE END USER ANALYSIS, 2025–2034, (USD MILLION)
FIGURE 107 MALAYSIA COAGULATION ANALYZER CURRENT AND FUTURE TYPE ANALYSIS, 2025–2034, (USD MILLION)
FIGURE 108 MALAYSIA COAGULATION ANALYZER CURRENT AND FUTURE END USER ANALYSIS, 2025–2034, (USD MILLION)
FIGURE 109 REST OF SEA AND SOUTH ASIA COAGULATION ANALYZER CURRENT AND FUTURE TYPE ANALYSIS, 2025–2034, (USD MILLION)
FIGURE 110 REST OF SEA AND SOUTH ASIA COAGULATION ANALYZER CURRENT AND FUTURE END USER ANALYSIS, 2025–2034, (USD MILLION)
FIGURE 111 MIDDLE EAST AND AFRICA COAGULATION ANALYZER CURRENT AND FUTURE MARKET VOLUME SHARE REGIONAL ANALYSIS, 2025–2034, (USD MILLION)
FIGURE 112 GCC COUNTRIES COAGULATION ANALYZER CURRENT AND FUTURE TYPE ANALYSIS, 2025–2034, (USD MILLION)
FIGURE 113 GCC COUNTRIES COAGULATION ANALYZER CURRENT AND FUTURE END USER ANALYSIS, 2025–2034, (USD MILLION)
FIGURE 114 SAUDI ARABIA COAGULATION ANALYZER CURRENT AND FUTURE TYPE ANALYSIS, 2025–2034, (USD MILLION)
FIGURE 115 SAUDI ARABIA COAGULATION ANALYZER CURRENT AND FUTURE END USER ANALYSIS, 2025–2034, (USD MILLION)
FIGURE 116 UAE COAGULATION ANALYZER CURRENT AND FUTURE TYPE ANALYSIS, 2025–2034, (USD MILLION)
FIGURE 117 UAE COAGULATION ANALYZER CURRENT AND FUTURE END USER ANALYSIS, 2025–2034, (USD MILLION)
FIGURE 118 BAHRAIN COAGULATION ANALYZER CURRENT AND FUTURE TYPE ANALYSIS, 2025–2034, (USD MILLION)
FIGURE 119 BAHRAIN COAGULATION ANALYZER CURRENT AND FUTURE END USER ANALYSIS, 2025–2034, (USD MILLION)
FIGURE 120 KUWAIT COAGULATION ANALYZER CURRENT AND FUTURE TYPE ANALYSIS, 2025–2034, (USD MILLION)
FIGURE 121 KUWAIT COAGULATION ANALYZER CURRENT AND FUTURE END USER ANALYSIS, 2025–2034, (USD MILLION)
FIGURE 122 OMAN COAGULATION ANALYZER CURRENT AND FUTURE TYPE ANALYSIS, 2025–2034, (USD MILLION)
FIGURE 123 OMAN COAGULATION ANALYZER CURRENT AND FUTURE END USER ANALYSIS, 2025–2034, (USD MILLION)
FIGURE 124 QATAR COAGULATION ANALYZER CURRENT AND FUTURE TYPE ANALYSIS, 2025–2034, (USD MILLION)
FIGURE 125 QATAR COAGULATION ANALYZER CURRENT AND FUTURE END USER ANALYSIS, 2025–2034, (USD MILLION)
FIGURE 126 EGYPT COAGULATION ANALYZER CURRENT AND FUTURE TYPE ANALYSIS, 2025–2034, (USD MILLION)
FIGURE 127 EGYPT COAGULATION ANALYZER CURRENT AND FUTURE END USER ANALYSIS, 2025–2034, (USD MILLION)
FIGURE 128 NIGERIA COAGULATION ANALYZER CURRENT AND FUTURE TYPE ANALYSIS, 2025–2034, (USD MILLION)
FIGURE 129 NIGERIA COAGULATION ANALYZER CURRENT AND FUTURE END USER ANALYSIS, 2025–2034, (USD MILLION)
FIGURE 130 SOUTH AFRICA COAGULATION ANALYZER CURRENT AND FUTURE TYPE ANALYSIS, 2025–2034, (USD MILLION)
FIGURE 131 SOUTH AFRICA COAGULATION ANALYZER CURRENT AND FUTURE END USER ANALYSIS, 2025–2034, (USD MILLION)
FIGURE 132 ISRAEL COAGULATION ANALYZER CURRENT AND FUTURE TYPE ANALYSIS, 2025–2034, (USD MILLION)
FIGURE 133 ISRAEL COAGULATION ANALYZER CURRENT AND FUTURE END USER ANALYSIS, 2025–2034, (USD MILLION)
FIGURE 134 REST OF MEA COAGULATION ANALYZER CURRENT AND FUTURE TYPE ANALYSIS, 2025–2034, (USD MILLION)
FIGURE 135 REST OF MEA COAGULATION ANALYZER CURRENT AND FUTURE END USER ANALYSIS, 2025–2034, (USD MILLION)
FIGURE 136 U. S. MARKET SHARE ANALYSIS BY TYPE (2024)
FIGURE 137 U. S. MARKET SHARE ANALYSIS BY END USER (2024)
FIGURE 138 CANADA MARKET SHARE ANALYSIS BY TYPE (2024)
FIGURE 139 CANADA MARKET SHARE ANALYSIS BY END USER (2024)
FIGURE 140 MEXICO MARKET SHARE ANALYSIS BY TYPE (2024)
FIGURE 141 MEXICO MARKET SHARE ANALYSIS BY END USER (2024)
FIGURE 142 CHINA MARKET SHARE ANALYSIS BY TYPE (2024)
FIGURE 143 CHINA MARKET SHARE ANALYSIS BY END USER (2024)
FIGURE 144 JAPAN MARKET SHARE ANALYSIS BY TYPE (2024)
FIGURE 145 JAPAN MARKET SHARE ANALYSIS BY END USER (2024)
FIGURE 146 INDIA MARKET SHARE ANALYSIS BY TYPE (2024)
FIGURE 147 INDIA MARKET SHARE ANALYSIS BY END USER (2024)
FIGURE 148 SOUTH KOREA MARKET SHARE ANALYSIS BY TYPE (2024)
FIGURE 149 SOUTH KOREA MARKET SHARE ANALYSIS BY END USER (2024)
FIGURE 150 SAUDI ARABIA MARKET SHARE ANALYSIS BY TYPE (2024)
FIGURE 151 SAUDI ARABIA MARKET SHARE ANALYSIS BY END USER (2024)
FIGURE 152 UAE MARKET SHARE ANALYSIS BY TYPE (2024)
FIGURE 153 UAE MARKET SHARE ANALYSIS BY END USER (2024)
FIGURE 154 EGYPT MARKET SHARE ANALYSIS BY TYPE (2024)
FIGURE 155 EGYPT MARKET SHARE ANALYSIS BY END USER (2024)
FIGURE 156 NIGERIA MARKET SHARE ANALYSIS BY TYPE (2024)
FIGURE 157 NIGERIA MARKET SHARE ANALYSIS BY END USER (2024)
FIGURE 158 SOUTH AFRICA MARKET SHARE ANALYSIS BY TYPE (2024)
FIGURE 159 SOUTH AFRICA MARKET SHARE ANALYSIS BY END USER (2024)
FIGURE 160 GERMANY MARKET SHARE ANALYSIS BY TYPE (2024)
FIGURE 161 GERMANY MARKET SHARE ANALYSIS BY END USER (2024)
FIGURE 162 FRANCE MARKET SHARE ANALYSIS BY TYPE (2024)
FIGURE 163 FRANCE MARKET SHARE ANALYSIS BY END USER (2024)
FIGURE 164 UK MARKET SHARE ANALYSIS BY TYPE (2024)
FIGURE 165 UK MARKET SHARE ANALYSIS BY END USER (2024)
FIGURE 166 SPAIN MARKET SHARE ANALYSIS BY TYPE (2024)
FIGURE 167 SPAIN MARKET SHARE ANALYSIS BY END USER (2024)
FIGURE 168 ITALY MARKET SHARE ANALYSIS BY TYPE (2024)
FIGURE 169 ITALY MARKET SHARE ANALYSIS BY END USER (2024)
FIGURE 170 BRAZIL MARKET SHARE ANALYSIS BY TYPE (2024)
FIGURE 171 BRAZIL MARKET SHARE ANALYSIS BY END USER (2024)
FIGURE 172 ARGENTINA MARKET SHARE ANALYSIS BY TYPE (2024)
FIGURE 173 ARGENTINA MARKET SHARE ANALYSIS BY END USER (2024)
FIGURE 174 COLUMBIA MARKET SHARE ANALYSIS BY TYPE (2024)
FIGURE 175 COLUMBIA MARKET SHARE ANALYSIS BY END USER (2024)
FIGURE 176 GLOBAL COAGULATION ANALYZER CURRENT AND FUTURE MARKET KEY COUNTRY LEVEL ANALYSIS, 2024–2034, (USD MILLION)
FIGURE 177 FINANCIAL OVERVIEW:
Key Player Analysis
Thermo Fisher Scientific: Thermo Fisher Scientific positions itself as a challenger in the coagulation analyzer market, leveraging its broad diagnostics portfolio and global distribution capabilities. The company’s coagulation testing solutions are integrated into its clinical diagnostics segment, which generated over US$5.2 billion in revenue in 2024. Thermo Fisher continues to invest in automation and data connectivity across its diagnostics platforms, aiming to improve lab efficiency and throughput. Its focus on modular, scalable systems makes it a strong partner for mid- to high-volume laboratories.
Strategically, Thermo Fisher is expanding its presence in emerging markets through regional partnerships and targeted product launches tailored to cost-sensitive environments. The company’s emphasis on reagent reliability and service infrastructure has been a key differentiator, especially in Europe and Asia Pacific. Thermo Fisher also integrates digital interfaces into its analyzers, supporting real-time data tracking and compliance with hospital IT systems.
Sysmex Corporation: Sysmex Corporation remains a global leader in coagulation diagnostics, supported by its stronghold in hematology and hemostasis testing. The company holds a significant share in the automated coagulation analyzer segment, particularly across Asia and Europe. In 2024, Sysmex reported a 6.8% year-over-year growth in its diagnostics division, underpinned by continued demand for its CN-series and CS-series systems.
Sysmex focuses on R&D to enhance precision and throughput across its analyzer platforms. The firm has also invested in AI integration, using algorithm-based result interpretation to reduce manual review and improve lab workflow. Its OEM partnership with Siemens Healthineers, initiated in 2023, expanded global access to Sysmex analyzers under both brands. With a strong customer base in both hospital networks and private labs, Sysmex continues to reinforce its leadership through technology upgrades and market expansion.
Siemens Healthineers: Siemens Healthineers is a key innovator in the coagulation analyzer market, leveraging its diagnostics expertise and global reach. The company integrates coagulation testing within its broader diagnostics portfolio, which generated over €6.1 billion in revenue in fiscal year 2024. Siemens focuses on high-throughput solutions with advanced automation features, such as its Atellica COAG 360 system, designed to improve operational efficiency in high-volume laboratories.
The firm’s strategic move to enter a global OEM partnership with Sysmex in 2023 allowed it to expand its hemostasis portfolio without duplicating development efforts. Siemens also emphasizes digital transformation, embedding cloud-based diagnostics, remote monitoring, and AI-powered analytics into its platforms. These features support centralized lab management and quality control. Siemens Healthineers maintains a strong presence in North America and Europe, with increasing penetration in Asia through local partnerships.
International Technidyne Corporation (ITC): International Technidyne Corporation, part of the Werfen Group, positions itself as a niche player in the coagulation analyzer market with a focus on point-of-care testing solutions. Its flagship product, the Hemochron Signature Elite, is widely used in operating rooms and emergency care settings where real-time coagulation data is critical. The company serves a specialized segment of the market, offering compact, user-friendly systems tailored for near-patient testing.
ITC's strength lies in rapid turnaround testing and ease of integration into critical care environments. The company has been expanding its global footprint by targeting mid-tier hospitals and outpatient facilities, especially in Latin America and Southeast Asia. ITC continues to invest in enhancing cartridge-based testing and improving result standardization across devices. With growing demand for decentralized diagnostics, ITC is well-positioned to benefit from the shift toward mobile and accessible coagulation monitoring.
MarketKey Players
Sysmex Corporation
Abbott Laboratories
Siemens Healthineers
HORIBA Medical
Thermo Fisher Scientific
Beckman Coulter Inc
International Technidyne Corporation
Instrumentation Laboratory
Driver:
Cancer Burden Increases Demand for Advanced Coagulation Monitoring
As of 2025, the rising global cancer burden continues to drive demand for coagulation analyzers across clinical and research settings. Cancer patients frequently experience coagulation complications, including venous thromboembolism and disseminated intravascular coagulation, which require continuous monitoring. Hematologic malignancies such as leukemia, lymphoma, and myeloma particularly impact coagulation pathways, necessitating advanced diagnostic tools during treatment. In the U.S. alone, over 60,000 new cases of leukemia are expected in 2025, underlining the scale of demand.
Automated Analyzers Become Essential in Oncology Care & Drug Development
Coagulation analyzers play a critical role in supporting oncology care, especially during chemotherapy or surgery, where clotting risks escalate. As hospitals and oncology centers prioritize early detection and therapy optimization, the integration of high-throughput, automated analyzers becomes essential. This shift is also influencing pharmaceutical research, where precise coagulation monitoring supports drug development and clinical trials. The rising focus on cancer management is expected to remain a long-term growth catalyst for the market.
Restraint:
High Equipment Costs and Operational Expenses Limit Adoption
High upfront costs and ongoing operational expenses remain key barriers to wider adoption of coagulation analyzers, particularly in lower-income and resource-constrained markets. Advanced systems can cost upwards of US$50,000, with additional recurring costs for reagents, calibration, maintenance, and trained personnel. These financial burdens make high-throughput analyzers less viable for smaller hospitals and independent diagnostic labs.
Limited reimbursement policies further restrict uptake. In several developing regions, coagulation testing is not fully covered by public or private insurers, reducing the incentive for providers to invest in automated solutions. As a result, many facilities continue to rely on manual testing methods, which are slower and less precise. Without targeted policy reforms or cost-reduction strategies from manufacturers, this pricing challenge may continue to limit the market's full potential.
Opportunity:
Rise of Point-of-Care & AI-Enabled Coagulation Devices Expands Access
The push for decentralized diagnostics and personalized treatment is creating significant opportunities for next-generation coagulation analyzers. The market is seeing a rise in compact, AI-integrated devices designed for point-of-care use. These systems offer real-time results, support mobile diagnostics, and improve patient management in both acute care and outpatient settings. Industry players are also embedding smart connectivity features to streamline data integration with hospital information systems.
Growing Healthcare Investment Boosts Adoption in Emerging Regions
This shift is opening access to coagulation testing in underserved and remote regions, particularly in Asia Pacific and Latin America. With global healthcare spending expected to grow at a CAGR of over 5% through 2030, investment in portable and efficient diagnostic tools is rising. Companies offering rapid, user-friendly analyzers that support high-volume and remote testing environments are well-positioned to capture new market segments.
Trend:
Strategic Partnerships Drive Innovation and Market Penetration
Strategic alliances between diagnostic manufacturers, healthcare providers, and tech companies are reshaping the coagulation analyzer market. These partnerships are focused on co-developing integrated platforms that combine diagnostic accuracy with workflow automation. For example, Siemens Healthineers and Sysmex Corporation’s OEM agreement enables dual branding and cross-distribution of coagulation testing products, enhancing market penetration and system interoperability.
Industry Collaborations Accelerate Product Development & Global Reach
Collaborations are also driving faster product development, broader global reach, and improved compliance with local regulatory frameworks. In 2025, this trend is accelerating as companies seek to consolidate capabilities in AI-driven diagnostics, reagent optimization, and digital health integration. As competition intensifies, partnerships are becoming a core strategy for expanding global footprint and responding to diverse clinical demands.
Recent Developments
Dec 2024 – Siemens Healthineers: The company launched its new Atellica COAG 600 platform, targeting mid-volume labs with enhanced throughput and reduced sample turnaround times by up to 30%. This move strengthens Siemens' position in the mid-tier diagnostic segment and addresses rising demand for automated coagulation systems.
Feb 2025 – Sysmex Corporation: Sysmex expanded its strategic OEM partnership with Siemens Healthineers to include AI-powered result interpretation modules for hemostasis testing. The enhancement improves diagnostic accuracy and supports faster clinical decision-making, reinforcing both firms' leadership in high-precision coagulation diagnostics.
Apr 2025 – Werfen (ITC): Werfen announced the global rollout of its next-generation Hemochron Elite POC analyzer, featuring enhanced cartridge compatibility and wireless data transfer. The product is expected to increase point-of-care testing coverage by 18% across critical care settings, expanding ITC’s reach in the decentralized diagnostics market.
Jul 2025 – Thermo Fisher Scientific: Thermo Fisher acquired a minority stake in an India-based diagnostics start-up specializing in low-cost coagulation testing solutions. The deal, valued at approximately USD 42 million, aims to support affordable analyzer development for emerging markets. This enhances Thermo Fisher’s access to price-sensitive regions and early-stage technology innovation.
Sep 2025 – Roche Diagnostics: Roche entered the coagulation testing market with the launch of its Cobas ClotCheck series across Europe and selected Asia Pacific markets. The system integrates with Roche’s broader diagnostics ecosystem and is expected to capture up to 12% of new lab installations by 2026. The move positions Roche as a new entrant challenging established players with end-to-end diagnostic integration.