Contact Center as a Service (CCaaS) Market Size, Growth | CAGR 20.1%
Global Contact Center as a Service (CCaaS) Market Size, Share & Analysis By Function (Automatic Call Distribution, Call Recording, Customer Collaboration, Interactive Voice Response, Dialer, Other Functions), By End-Use Industry (BFSI, Healthcare, IT & Telecom, Government, Consumer Goods & Retail) Industry Regions & Key Players – CX Transformation, AI Integration & Forecast 2025–2034
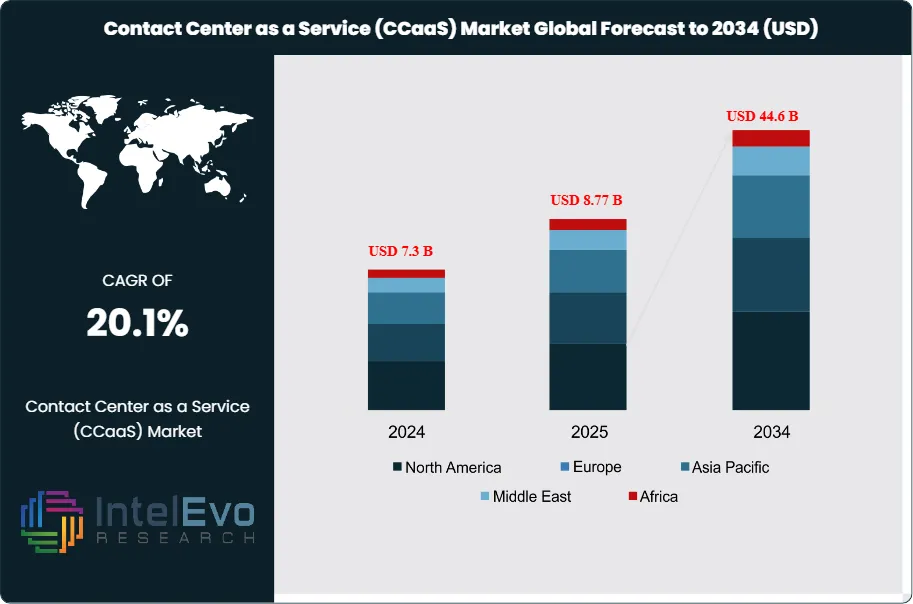
The Contact Center as a Service (CCaaS) Market size is expected to be worth around USD 44.6 Billion by 2034, from USD 7.3 Billion in 2024, growing at a CAGR of 20.1% during the forecast period from 2025 to 2034. This rapid expansion reflects the increasing global shift toward cloud-based communication platforms that enable enterprises to enhance customer engagement while reducing reliance on traditional, hardware-intensive call center models.
The market has evolved from being a niche offering to becoming a mainstream solution for organizations seeking agility, scalability, and cost efficiency in managing customer interactions. CCaaS platforms integrate a wide range of features, including interactive voice response (IVR), omnichannel routing, call recording, analytics, and seamless app integrations, which collectively enhance customer satisfaction and operational performance. Enterprises across sectors are leveraging these capabilities to deliver personalized, responsive, and consistent support experiences across voice, chat, email, and social media channels.
Key growth drivers include the rising demand for remote and hybrid customer support solutions, heightened focus on improving customer experience, and growing need for business continuity strategies. In particular, the surge in digital-first customer behavior is compelling organizations to adopt cloud-based contact centers that ensure scalability and flexibility while minimizing capital expenditure. However, challenges such as data security concerns, integration complexities with legacy systems, and compliance with regional data protection laws remain critical hurdles to broader adoption.
Technological innovation is playing a pivotal role in shaping the CCaaS landscape. Artificial intelligence (AI) and machine learning (ML) are being increasingly embedded into contact center platforms, enabling predictive routing, intelligent chatbots, real-time sentiment analysis, and workforce optimization. These advancements are expected to drive higher levels of automation and efficiency, reducing average handling times while enhancing customer engagement outcomes.
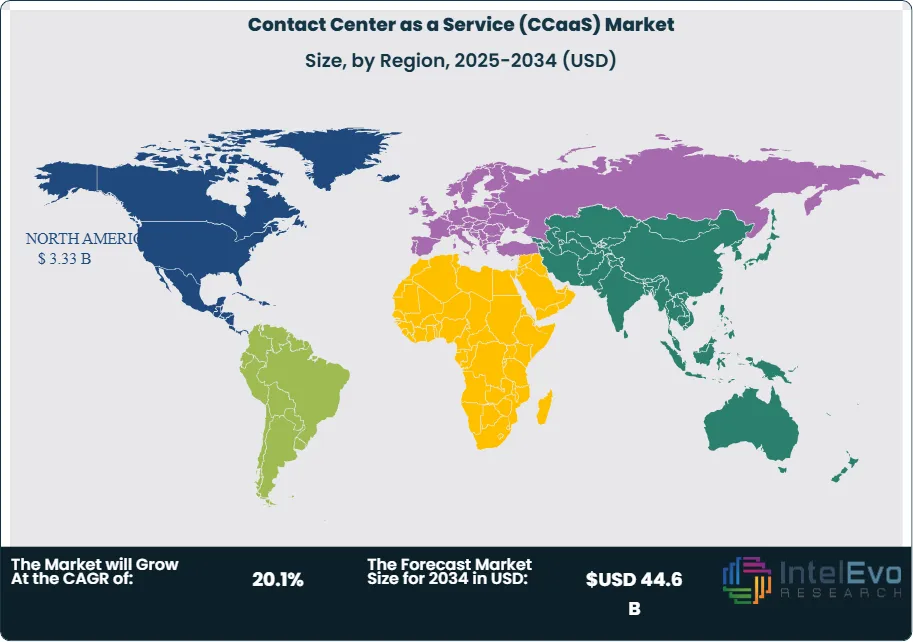
Regionally, North America dominates the market, underpinned by strong cloud adoption, technological maturity, and a concentration of leading vendors. Europe is witnessing steady growth fueled by regulatory compliance needs and digital transformation initiatives, while Asia-Pacific is emerging as a high-potential investment hotspot, driven by rapid enterprise digitization, expanding customer bases, and rising demand for cost-effective, scalable solutions. Collectively, these dynamics position the CCaaS market as a critical enabler of next-generation customer engagement strategies worldwide.
Market Growth: The Global Contact Center as a Service (CCaaS) industry is on a steep growth trajectory, forecast to rise from USD 7.3 Billion in 2024 to approximately USD 44.6 Billion by 2034. This reflects a strong CAGR of 20.1% over the 2024–2034 period, supported by widespread cloud adoption, the shift toward digital-first engagement, and the need for agile, cost-efficient communication models.
Functionality: Among solution categories, Automatic Call Distribution (ACD) continues to hold the largest share, as enterprises prioritize efficient routing of high call volumes to reduce waiting times and improve agent productivity. Meanwhile, customer collaboration tools are gaining momentum, helping organizations facilitate real-time, multi-channel interaction and boost customer satisfaction.
End-Use Industry: The banking, financial services, and insurance (BFSI) sector is the largest adopter of CCaaS solutions, driven by heavy customer interaction needs, digital banking initiatives, and strict compliance requirements. Looking forward, retail and e-commerce are expected to record the fastest uptake, fueled by the surge in online shopping and the need to manage omnichannel customer engagement at scale.
Growth Driver: Heightened focus on delivering seamless customer experiences and ensuring uninterrupted service in remote or hybrid work environments is propelling CCaaS adoption. Flexible cloud platforms allow enterprises to integrate voice, chat, and digital channels under one system, enabling consistent service delivery.
Restraint: Data protection concerns and regulatory complexities—especially around cross-border information handling—pose significant hurdles to wider adoption, particularly in heavily regulated verticals such as finance and healthcare.
Opportunity: Advanced use of artificial intelligence (AI) and machine learning (ML) is opening new growth avenues. Capabilities such as intelligent chatbots, predictive analytics, and real-time sentiment monitoring are helping companies lower costs, improve service quality, and scale automation across contact centers.
Trend: A major trend shaping the market is the move toward integrated omnichannel platforms, where enterprises unify voice, email, social media, and messaging into seamless workflows to provide consistent, personalized customer journeys.
Regional Outlook: North America currently leads the global market, supported by strong IT infrastructure, early adoption of cloud solutions, and the presence of leading providers including Cisco, Microsoft, and Genesys. The Asia-Pacific region is registering the fastest growth, driven by rapid digitalization, a surge in SMEs adopting cloud-based tools, and the booming e-commerce sector in economies such as India and China.
Function Analysis
In 2025, automatic call distribution (ACD) continues to represent the leading function within the global Contact Center as a Service (CCaaS) market, accounting for a significant share of total revenues. ACD solutions are valued for their ability to intelligently route high volumes of inbound calls to the most appropriate agents, thereby reducing wait times and improving overall service efficiency. For organizations managing thousands of customer interactions daily, this functionality has become indispensable to ensuring seamless operations and consistent service quality.
Beyond ACD, customer collaboration tools are gaining momentum as enterprises increasingly focus on two-way engagement and issue resolution through real-time feedback. Similarly, call recording and analytics functions are experiencing strong adoption, particularly within regulated industries where compliance, quality monitoring, and performance optimization are critical. Together, these capabilities reflect a market shift toward integrated, data-driven platforms that improve operational efficiency while enhancing the customer journey.
End-Use Industry Analysis
The Banking, Financial Services, and Insurance (BFSI) sector remains the dominant end-use industry in 2025, holding the largest revenue share of the CCaaS market. Digital transformation initiatives, the rise of mobile and online banking, and stricter compliance requirements have significantly increased customer touchpoints. As a result, financial institutions are relying heavily on CCaaS solutions to manage omnichannel interactions, strengthen client relationships, and ensure secure, compliant communications.
The IT and telecom sector is another critical adopter, leveraging CCaaS to handle vast volumes of technical queries and customer support requests. With the expansion of broadband, 5G networks, and cloud services, telecom providers are integrating AI-powered virtual assistants and interactive voice response (IVR) systems to streamline support delivery. Other industries such as healthcare, government, travel, and hospitality are also expanding their adoption, driven by rising expectations for accessible, responsive, and cost-effective customer engagement solutions.
Regional Analysis
North America continues to lead the global CCaaS market in 2025, holding over one-third of global revenue share. The region’s dominance is underpinned by rapid cloud adoption, advanced IT infrastructure, and the presence of leading technology providers such as Cisco Systems, Genesys, and Microsoft. Enterprises across sectors are deploying AI-enabled CCaaS solutions to deliver more personalized and predictive customer experiences, further reinforcing market growth in the region.
Meanwhile, the Asia-Pacific market is witnessing the fastest expansion, projected to record the highest CAGR over the forecast period. Factors such as the booming e-commerce sector, large-scale digitization initiatives, and growing adoption of cloud-based tools by small and medium enterprises are driving regional momentum. Countries including India, China, and Southeast Asian economies are emerging as high-potential investment hubs, as businesses increasingly prioritize scalable, multilingual, and cost-effective customer engagement platforms to serve rapidly expanding consumer bases.
By Function (Automatic Call Distribution, Call Recording, Customer Collaboration, Interactive Voice Response, Dialer, Other Functions), By End-Use Industry (BFSI, Healthcare, IT & Telecom, Government, Consumer Goods & Retail, Other End-Use Industries)
Research Methodology
Primary Research- 100 Interviews of Stakeholders
Secondary Research
Desk Research
Regional scope
North America (United States, Canada, Mexico)
Latin America (Brazil, Argentina, Columbia)
East Asia And Pacific (China, Japan, South Korea, Australia, Cambodia, Fiji, Indonesia)
Sea And South Asia (India, Singapore, Thailand, Taiwan, Malaysia)
Eastern Europe (Poland, Russia, Czech Republic, Romania)
Western Europe (Germany, U.K., France, Spain, Itlay)
Middle East & Africa (GCC Countries, Egypt, Nigeria, South Africa, Israel)
Competitive Landscape
Cisco Systems Inc., Microsoft Corporation, Genesys, SAP SE, NICE CXone, Enghouse Interactive Inc., Avaya Inc., Unify Inc., Alcatel Lucent Enterprise, Computer Talk Technology Inc., Oracle Corporation
Customization Scope
Customization for segments, region/country-level will be provided. Moreover, additional customization can be done based on the requirements.
Pricing and Purchase Options
Avail customized purchase options to meet your exact research needs. We have three licenses to opt for: Single User License, Multi-User License (Up to 5 Users), Corporate Use License (Unlimited User and Printable PDF).
TABLE OF CONTENTS
1. EXECUTIVE SUMMARY
1.1. MARKET SNAPSHOT
1.2. KEY FINDINGS & INSIGHTS
1.3. ANALYST RECOMMENDATIONS
1.4. FUTURE OUTLOOK
2. RESEARCH METHODOLOGY
2.1. MARKET DEFINITION & SCOPE
2.2. RESEARCH OBJECTIVES: PRIMARY & SECONDARY DATA SOURCES
2.3. DATA COLLECTION SOURCES
2.3.1. COVERAGE OF 100+ PRIMARY RESEARCH/CONSULTATION CALLS WITH INDUSTRY STAKEHOLDERS
FIGURE 17 NORTH AMERICA CONTACT CENTER AS A SERVICE CURRENT AND FUTURE TYPE ANALYSIS, 2025–2034, (USD MILLION)
FIGURE 18 NORTH AMERICA CONTACT CENTER AS A SERVICE CURRENT AND FUTURE END USER ANALYSIS, 2025–2034, (USD MILLION)
FIGURE 19 MARKET SHARE BY COUNTRY
FIGURE 20 LATIN AMERICA CONTACT CENTER AS A SERVICE CURRENT AND FUTURE TYPE ANALYSIS, 2025–2034, (USD MILLION)
FIGURE 21 LATIN AMERICA CONTACT CENTER AS A SERVICE CURRENT AND FUTURE END USER ANALYSIS, 2025–2034, (USD MILLION)
FIGURE 22 MARKET SHARE BY COUNTRY
FIGURE 23 EASTERN EUROPE CONTACT CENTER AS A SERVICE CURRENT AND FUTURE TYPE ANALYSIS, 2025–2034, (USD MILLION)
FIGURE 24 EASTERN EUROPE CONTACT CENTER AS A SERVICE CURRENT AND FUTURE END USER ANALYSIS, 2025–2034, (USD MILLION)
FIGURE 25 MARKET SHARE BY COUNTRY
FIGURE 26 WESTERN EUROPE CONTACT CENTER AS A SERVICE CURRENT AND FUTURE TYPE ANALYSIS, 2025–2034, (USD MILLION)
FIGURE 27 WESTERN EUROPE CONTACT CENTER AS A SERVICE CURRENT AND FUTURE END USER ANALYSIS, 2025–2034, (USD MILLION)
FIGURE 28 MARKET SHARE BY COUNTRY
FIGURE 29 EAST ASIA AND PACIFIC CONTACT CENTER AS A SERVICE CURRENT AND FUTURE TYPE ANALYSIS, 2025–2034, (USD MILLION)
FIGURE 30 EAST ASIA AND PACIFIC CONTACT CENTER AS A SERVICE CURRENT AND FUTURE END USER ANALYSIS, 2025–2034, (USD MILLION)
FIGURE 31 MARKET SHARE BY COUNTRY
FIGURE 32 SEA AND SOUTH ASIA CONTACT CENTER AS A SERVICE CURRENT AND FUTURE TYPE ANALYSIS, 2025–2034, (USD MILLION)
FIGURE 33 SEA AND SOUTH ASIA CONTACT CENTER AS A SERVICE CURRENT AND FUTURE END USER ANALYSIS, 2025–2034, (USD MILLION)
FIGURE 34 MARKET SHARE BY COUNTRY
FIGURE 35 MIDDLE EAST AND AFRICA CONTACT CENTER AS A SERVICE CURRENT AND FUTURE TYPE ANALYSIS, 2025–2034, (USD MILLION)
FIGURE 36 MIDDLE EAST AND AFRICA CONTACT CENTER AS A SERVICE CURRENT AND FUTURE END USER ANALYSIS, 2025–2034, (USD MILLION)
FIGURE 37 NORTH AMERICA CONTACT CENTER AS A SERVICE CURRENT AND FUTURE MARKET VOLUME SHARE REGIONAL ANALYSIS, 2025–2034, (USD MILLION)
FIGURE 38 U.S. CONTACT CENTER AS A SERVICE CURRENT AND FUTURE TYPE ANALYSIS, 2025–2034, (USD MILLION)
FIGURE 39 U.S. CONTACT CENTER AS A SERVICE CURRENT AND FUTURE END USER ANALYSIS, 2025–2034, (USD MILLION)
FIGURE 40 CANADA CONTACT CENTER AS A SERVICE CURRENT AND FUTURE TYPE ANALYSIS, 2025–2034, (USD MILLION)
FIGURE 41 CANADA CONTACT CENTER AS A SERVICE CURRENT AND FUTURE END USER ANALYSIS, 2025–2034, (USD MILLION)
FIGURE 42 LATIN AMERICA CONTACT CENTER AS A SERVICE CURRENT AND FUTURE MARKET VOLUME SHARE REGIONAL ANALYSIS, 2025–2034, (USD MILLION)
FIGURE 43 MEXICO CONTACT CENTER AS A SERVICE CURRENT AND FUTURE TYPE ANALYSIS, 2025–2034, (USD MILLION)
FIGURE 44 MEXICO CONTACT CENTER AS A SERVICE CURRENT AND FUTURE END USER ANALYSIS, 2025–2034, (USD MILLION)
FIGURE 45 BRAZIL CONTACT CENTER AS A SERVICE CURRENT AND FUTURE TYPE ANALYSIS, 2025–2034, (USD MILLION)
FIGURE 46 BRAZIL CONTACT CENTER AS A SERVICE CURRENT AND FUTURE END USER ANALYSIS, 2025–2034, (USD MILLION)
FIGURE 47 ARGENTINA CONTACT CENTER AS A SERVICE CURRENT AND FUTURE TYPE ANALYSIS, 2025–2034, (USD MILLION)
FIGURE 48 ARGENTINA CONTACT CENTER AS A SERVICE CURRENT AND FUTURE END USER ANALYSIS, 2025–2034, (USD MILLION)
FIGURE 49 COLUMBIA CONTACT CENTER AS A SERVICE CURRENT AND FUTURE TYPE ANALYSIS, 2025–2034, (USD MILLION)
FIGURE 50 COLUMBIA CONTACT CENTER AS A SERVICE CURRENT AND FUTURE END USER ANALYSIS, 2025–2034, (USD MILLION)
FIGURE 51 REST OF LATIN AMERICA CONTACT CENTER AS A SERVICE CURRENT AND FUTURE TYPE ANALYSIS, 2025–2034, (USD MILLION)
FIGURE 52 REST OF LATIN AMERICA CONTACT CENTER AS A SERVICE CURRENT AND FUTURE END USER ANALYSIS, 2025–2034, (USD MILLION)
FIGURE 53 EASTERN EUROPE CONTACT CENTER AS A SERVICE CURRENT AND FUTURE MARKET VOLUME SHARE REGIONAL ANALYSIS, 2025–2034, (USD MILLION)
FIGURE 54 POLAND CONTACT CENTER AS A SERVICE CURRENT AND FUTURE TYPE ANALYSIS, 2025–2034, (USD MILLION)
FIGURE 55 POLAND CONTACT CENTER AS A SERVICE CURRENT AND FUTURE END USER ANALYSIS, 2025–2034, (USD MILLION)
FIGURE 56 RUSSIA CONTACT CENTER AS A SERVICE CURRENT AND FUTURE TYPE ANALYSIS, 2025–2034, (USD MILLION)
FIGURE 57 RUSSIA CONTACT CENTER AS A SERVICE CURRENT AND FUTURE END USER ANALYSIS, 2025–2034, (USD MILLION)
FIGURE 58 CZECH REPUBLIC CONTACT CENTER AS A SERVICE CURRENT AND FUTURE TYPE ANALYSIS, 2025–2034, (USD MILLION)
FIGURE 59 CZECH REPUBLIC CONTACT CENTER AS A SERVICE CURRENT AND FUTURE END USER ANALYSIS, 2025–2034, (USD MILLION)
FIGURE 60 ROMANIA CONTACT CENTER AS A SERVICE CURRENT AND FUTURE TYPE ANALYSIS, 2025–2034, (USD MILLION)
FIGURE 61 ROMANIA CONTACT CENTER AS A SERVICE CURRENT AND FUTURE END USER ANALYSIS, 2025–2034, (USD MILLION)
FIGURE 62 REST OF EASTERN EUROPE CONTACT CENTER AS A SERVICE CURRENT AND FUTURE TYPE ANALYSIS, 2025–2034, (USD MILLION)
FIGURE 63 REST OF EASTERN EUROPE CONTACT CENTER AS A SERVICE CURRENT AND FUTURE END USER ANALYSIS, 2025–2034, (USD MILLION)
FIGURE 64 WESTERN EUROPE CONTACT CENTER AS A SERVICE CURRENT AND FUTURE MARKET VOLUME SHARE REGIONAL ANALYSIS, 2025–2034, (USD MILLION)
FIGURE 65 GERMANY CONTACT CENTER AS A SERVICE CURRENT AND FUTURE TYPE ANALYSIS, 2025–2034, (USD MILLION)
FIGURE 66 GERMANY CONTACT CENTER AS A SERVICE CURRENT AND FUTURE END USER ANALYSIS, 2025–2034, (USD MILLION)
FIGURE 67 FRANCE CONTACT CENTER AS A SERVICE CURRENT AND FUTURE TYPE ANALYSIS, 2025–2034, (USD MILLION)
FIGURE 68 FRANCE CONTACT CENTER AS A SERVICE CURRENT AND FUTURE END USER ANALYSIS, 2025–2034, (USD MILLION)
FIGURE 69 UK CONTACT CENTER AS A SERVICE CURRENT AND FUTURE TYPE ANALYSIS, 2025–2034, (USD MILLION)
FIGURE 70 UK CONTACT CENTER AS A SERVICE CURRENT AND FUTURE END USER ANALYSIS, 2025–2034, (USD MILLION)
FIGURE 71 SPAIN CONTACT CENTER AS A SERVICE CURRENT AND FUTURE TYPE ANALYSIS, 2025–2034, (USD MILLION)
FIGURE 72 SPAIN CONTACT CENTER AS A SERVICE CURRENT AND FUTURE END USER ANALYSIS, 2025–2034, (USD MILLION)
FIGURE 73 ITALY CONTACT CENTER AS A SERVICE CURRENT AND FUTURE TYPE ANALYSIS, 2025–2034, (USD MILLION)
FIGURE 74 ITALY CONTACT CENTER AS A SERVICE CURRENT AND FUTURE END USER ANALYSIS, 2025–2034, (USD MILLION)
FIGURE 75 REST OF WESTERN EUROPE CONTACT CENTER AS A SERVICE CURRENT AND FUTURE TYPE ANALYSIS, 2025–2034, (USD MILLION)
FIGURE 76 REST OF WESTERN EUROPE CONTACT CENTER AS A SERVICE CURRENT AND FUTURE END USER ANALYSIS, 2025–2034, (USD MILLION)
FIGURE 77 EAST ASIA AND PACIFIC CONTACT CENTER AS A SERVICE CURRENT AND FUTURE MARKET VOLUME SHARE REGIONAL ANALYSIS, 2025–2034, (USD MILLION)
FIGURE 78 CHINA CONTACT CENTER AS A SERVICE CURRENT AND FUTURE TYPE ANALYSIS, 2025–2034, (USD MILLION)
FIGURE 79 CHINA CONTACT CENTER AS A SERVICE CURRENT AND FUTURE END USER ANALYSIS, 2025–2034, (USD MILLION)
FIGURE 80 JAPAN CONTACT CENTER AS A SERVICE CURRENT AND FUTURE TYPE ANALYSIS, 2025–2034, (USD MILLION)
FIGURE 81 JAPAN CONTACT CENTER AS A SERVICE CURRENT AND FUTURE END USER ANALYSIS, 2025–2034, (USD MILLION)
FIGURE 82 AUSTRALIA CONTACT CENTER AS A SERVICE CURRENT AND FUTURE TYPE ANALYSIS, 2025–2034, (USD MILLION)
FIGURE 83 AUSTRALIA CONTACT CENTER AS A SERVICE CURRENT AND FUTURE END USER ANALYSIS, 2025–2034, (USD MILLION)
FIGURE 84 CAMBODIA CONTACT CENTER AS A SERVICE CURRENT AND FUTURE TYPE ANALYSIS, 2025–2034, (USD MILLION)
FIGURE 85 CAMBODIA CONTACT CENTER AS A SERVICE CURRENT AND FUTURE END USER ANALYSIS, 2025–2034, (USD MILLION)
FIGURE 86 FIJI CONTACT CENTER AS A SERVICE CURRENT AND FUTURE TYPE ANALYSIS, 2025–2034, (USD MILLION)
FIGURE 87 FIJI CONTACT CENTER AS A SERVICE CURRENT AND FUTURE END USER ANALYSIS, 2025–2034, (USD MILLION)
FIGURE 88 INDONESIA CONTACT CENTER AS A SERVICE CURRENT AND FUTURE TYPE ANALYSIS, 2025–2034, (USD MILLION)
FIGURE 89 INDONESIA CONTACT CENTER AS A SERVICE CURRENT AND FUTURE END USER ANALYSIS, 2025–2034, (USD MILLION)
FIGURE 90 SOUTH KOREA CONTACT CENTER AS A SERVICE CURRENT AND FUTURE TYPE ANALYSIS, 2025–2034, (USD MILLION)
FIGURE 91 SOUTH KOREA CONTACT CENTER AS A SERVICE CURRENT AND FUTURE END USER ANALYSIS, 2025–2034, (USD MILLION)
FIGURE 92 REST OF EAST ASIA AND PACIFIC CONTACT CENTER AS A SERVICE CURRENT AND FUTURE TYPE ANALYSIS, 2025–2034, (USD MILLION)
FIGURE 93 REST OF EAST ASIA AND PACIFIC CONTACT CENTER AS A SERVICE CURRENT AND FUTURE END USER ANALYSIS, 2025–2034, (USD MILLION)
FIGURE 94 SEA AND SOUTH ASIA CONTACT CENTER AS A SERVICE CURRENT AND FUTURE MARKET VOLUME SHARE REGIONAL ANALYSIS, 2025–2034, (USD MILLION)
FIGURE 95 BANGLADESH CONTACT CENTER AS A SERVICE CURRENT AND FUTURE TYPE ANALYSIS, 2025–2034, (USD MILLION)
FIGURE 96 BANGLADESH CONTACT CENTER AS A SERVICE CURRENT AND FUTURE END USER ANALYSIS, 2025–2034, (USD MILLION)
FIGURE 97 NEW ZEALAND CONTACT CENTER AS A SERVICE CURRENT AND FUTURE TYPE ANALYSIS, 2025–2034, (USD MILLION)
FIGURE 98 NEW ZEALAND CONTACT CENTER AS A SERVICE CURRENT AND FUTURE END USER ANALYSIS, 2025–2034, (USD MILLION)
FIGURE 99 INDIA CONTACT CENTER AS A SERVICE CURRENT AND FUTURE TYPE ANALYSIS, 2025–2034, (USD MILLION)
FIGURE 100 INDIA CONTACT CENTER AS A SERVICE CURRENT AND FUTURE END USER ANALYSIS, 2025–2034, (USD MILLION)
FIGURE 101 SINGAPORE CONTACT CENTER AS A SERVICE CURRENT AND FUTURE TYPE ANALYSIS, 2025–2034, (USD MILLION)
FIGURE 102 SINGAPORE CONTACT CENTER AS A SERVICE CURRENT AND FUTURE END USER ANALYSIS, 2025–2034, (USD MILLION)
FIGURE 103 THAILAND CONTACT CENTER AS A SERVICE CURRENT AND FUTURE TYPE ANALYSIS, 2025–2034, (USD MILLION)
FIGURE 104 THAILAND CONTACT CENTER AS A SERVICE CURRENT AND FUTURE END USER ANALYSIS, 2025–2034, (USD MILLION)
FIGURE 105 TAIWAN CONTACT CENTER AS A SERVICE CURRENT AND FUTURE TYPE ANALYSIS, 2025–2034, (USD MILLION)
FIGURE 106 TAIWAN CONTACT CENTER AS A SERVICE CURRENT AND FUTURE END USER ANALYSIS, 2025–2034, (USD MILLION)
FIGURE 107 MALAYSIA CONTACT CENTER AS A SERVICE CURRENT AND FUTURE TYPE ANALYSIS, 2025–2034, (USD MILLION)
FIGURE 108 MALAYSIA CONTACT CENTER AS A SERVICE CURRENT AND FUTURE END USER ANALYSIS, 2025–2034, (USD MILLION)
FIGURE 109 REST OF SEA AND SOUTH ASIA CONTACT CENTER AS A SERVICE CURRENT AND FUTURE TYPE ANALYSIS, 2025–2034, (USD MILLION)
FIGURE 110 REST OF SEA AND SOUTH ASIA CONTACT CENTER AS A SERVICE CURRENT AND FUTURE END USER ANALYSIS, 2025–2034, (USD MILLION)
FIGURE 111 MIDDLE EAST AND AFRICA CONTACT CENTER AS A SERVICE CURRENT AND FUTURE MARKET VOLUME SHARE REGIONAL ANALYSIS, 2025–2034, (USD MILLION)
FIGURE 112 GCC COUNTRIES CONTACT CENTER AS A SERVICE CURRENT AND FUTURE TYPE ANALYSIS, 2025–2034, (USD MILLION)
FIGURE 113 GCC COUNTRIES CONTACT CENTER AS A SERVICE CURRENT AND FUTURE END USER ANALYSIS, 2025–2034, (USD MILLION)
FIGURE 114 SAUDI ARABIA CONTACT CENTER AS A SERVICE CURRENT AND FUTURE TYPE ANALYSIS, 2025–2034, (USD MILLION)
FIGURE 115 SAUDI ARABIA CONTACT CENTER AS A SERVICE CURRENT AND FUTURE END USER ANALYSIS, 2025–2034, (USD MILLION)
FIGURE 116 UAE CONTACT CENTER AS A SERVICE CURRENT AND FUTURE TYPE ANALYSIS, 2025–2034, (USD MILLION)
FIGURE 117 UAE CONTACT CENTER AS A SERVICE CURRENT AND FUTURE END USER ANALYSIS, 2025–2034, (USD MILLION)
FIGURE 118 BAHRAIN CONTACT CENTER AS A SERVICE CURRENT AND FUTURE TYPE ANALYSIS, 2025–2034, (USD MILLION)
FIGURE 119 BAHRAIN CONTACT CENTER AS A SERVICE CURRENT AND FUTURE END USER ANALYSIS, 2025–2034, (USD MILLION)
FIGURE 120 KUWAIT CONTACT CENTER AS A SERVICE CURRENT AND FUTURE TYPE ANALYSIS, 2025–2034, (USD MILLION)
FIGURE 121 KUWAIT CONTACT CENTER AS A SERVICE CURRENT AND FUTURE END USER ANALYSIS, 2025–2034, (USD MILLION)
FIGURE 122 OMAN CONTACT CENTER AS A SERVICE CURRENT AND FUTURE TYPE ANALYSIS, 2025–2034, (USD MILLION)
FIGURE 123 OMAN CONTACT CENTER AS A SERVICE CURRENT AND FUTURE END USER ANALYSIS, 2025–2034, (USD MILLION)
FIGURE 124 QATAR CONTACT CENTER AS A SERVICE CURRENT AND FUTURE TYPE ANALYSIS, 2025–2034, (USD MILLION)
FIGURE 125 QATAR CONTACT CENTER AS A SERVICE CURRENT AND FUTURE END USER ANALYSIS, 2025–2034, (USD MILLION)
FIGURE 126 EGYPT CONTACT CENTER AS A SERVICE CURRENT AND FUTURE TYPE ANALYSIS, 2025–2034, (USD MILLION)
FIGURE 127 EGYPT CONTACT CENTER AS A SERVICE CURRENT AND FUTURE END USER ANALYSIS, 2025–2034, (USD MILLION)
FIGURE 128 NIGERIA CONTACT CENTER AS A SERVICE CURRENT AND FUTURE TYPE ANALYSIS, 2025–2034, (USD MILLION)
FIGURE 129 NIGERIA CONTACT CENTER AS A SERVICE CURRENT AND FUTURE END USER ANALYSIS, 2025–2034, (USD MILLION)
FIGURE 130 SOUTH AFRICA CONTACT CENTER AS A SERVICE CURRENT AND FUTURE TYPE ANALYSIS, 2025–2034, (USD MILLION)
FIGURE 131 SOUTH AFRICA CONTACT CENTER AS A SERVICE CURRENT AND FUTURE END USER ANALYSIS, 2025–2034, (USD MILLION)
FIGURE 132 ISRAEL CONTACT CENTER AS A SERVICE CURRENT AND FUTURE TYPE ANALYSIS, 2025–2034, (USD MILLION)
FIGURE 133 ISRAEL CONTACT CENTER AS A SERVICE CURRENT AND FUTURE END USER ANALYSIS, 2025–2034, (USD MILLION)
FIGURE 134 REST OF MEA CONTACT CENTER AS A SERVICE CURRENT AND FUTURE TYPE ANALYSIS, 2025–2034, (USD MILLION)
FIGURE 135 REST OF MEA CONTACT CENTER AS A SERVICE CURRENT AND FUTURE END USER ANALYSIS, 2025–2034, (USD MILLION)
FIGURE 136 U. S. MARKET SHARE ANALYSIS BY TYPE (2024)
FIGURE 137 U. S. MARKET SHARE ANALYSIS BY END USER (2024)
FIGURE 138 CANADA MARKET SHARE ANALYSIS BY TYPE (2024)
FIGURE 139 CANADA MARKET SHARE ANALYSIS BY END USER (2024)
FIGURE 140 MEXICO MARKET SHARE ANALYSIS BY TYPE (2024)
FIGURE 141 MEXICO MARKET SHARE ANALYSIS BY END USER (2024)
FIGURE 142 CHINA MARKET SHARE ANALYSIS BY TYPE (2024)
FIGURE 143 CHINA MARKET SHARE ANALYSIS BY END USER (2024)
FIGURE 144 JAPAN MARKET SHARE ANALYSIS BY TYPE (2024)
FIGURE 145 JAPAN MARKET SHARE ANALYSIS BY END USER (2024)
FIGURE 146 INDIA MARKET SHARE ANALYSIS BY TYPE (2024)
FIGURE 147 INDIA MARKET SHARE ANALYSIS BY END USER (2024)
FIGURE 148 SOUTH KOREA MARKET SHARE ANALYSIS BY TYPE (2024)
FIGURE 149 SOUTH KOREA MARKET SHARE ANALYSIS BY END USER (2024)
FIGURE 150 SAUDI ARABIA MARKET SHARE ANALYSIS BY TYPE (2024)
FIGURE 151 SAUDI ARABIA MARKET SHARE ANALYSIS BY END USER (2024)
FIGURE 152 UAE MARKET SHARE ANALYSIS BY TYPE (2024)
FIGURE 153 UAE MARKET SHARE ANALYSIS BY END USER (2024)
FIGURE 154 EGYPT MARKET SHARE ANALYSIS BY TYPE (2024)
FIGURE 155 EGYPT MARKET SHARE ANALYSIS BY END USER (2024)
FIGURE 156 NIGERIA MARKET SHARE ANALYSIS BY TYPE (2024)
FIGURE 157 NIGERIA MARKET SHARE ANALYSIS BY END USER (2024)
FIGURE 158 SOUTH AFRICA MARKET SHARE ANALYSIS BY TYPE (2024)
FIGURE 159 SOUTH AFRICA MARKET SHARE ANALYSIS BY END USER (2024)
FIGURE 160 GERMANY MARKET SHARE ANALYSIS BY TYPE (2024)
FIGURE 161 GERMANY MARKET SHARE ANALYSIS BY END USER (2024)
FIGURE 162 FRANCE MARKET SHARE ANALYSIS BY TYPE (2024)
FIGURE 163 FRANCE MARKET SHARE ANALYSIS BY END USER (2024)
FIGURE 164 UK MARKET SHARE ANALYSIS BY TYPE (2024)
FIGURE 165 UK MARKET SHARE ANALYSIS BY END USER (2024)
FIGURE 166 SPAIN MARKET SHARE ANALYSIS BY TYPE (2024)
FIGURE 167 SPAIN MARKET SHARE ANALYSIS BY END USER (2024)
FIGURE 168 ITALY MARKET SHARE ANALYSIS BY TYPE (2024)
FIGURE 169 ITALY MARKET SHARE ANALYSIS BY END USER (2024)
FIGURE 170 BRAZIL MARKET SHARE ANALYSIS BY TYPE (2024)
FIGURE 171 BRAZIL MARKET SHARE ANALYSIS BY END USER (2024)
FIGURE 172 ARGENTINA MARKET SHARE ANALYSIS BY TYPE (2024)
FIGURE 173 ARGENTINA MARKET SHARE ANALYSIS BY END USER (2024)
FIGURE 174 COLUMBIA MARKET SHARE ANALYSIS BY TYPE (2024)
FIGURE 175 COLUMBIA MARKET SHARE ANALYSIS BY END USER (2024)
FIGURE 176 GLOBAL CONTACT CENTER AS A SERVICE CURRENT AND FUTURE MARKET KEY COUNTRY LEVEL ANALYSIS, 2024–2034, (USD MILLION)
FIGURE 177 FINANCIAL OVERVIEW:
Key Player Analysis
Cisco Systems Inc.: Cisco Systems has established itself as a technology leader in cloud-based contact center infrastructure, with a strong focus on embedding artificial intelligence into enterprise communication systems. As of 2025, Cisco’s strategy revolves around integrating AI-driven automation, predictive analytics, and intelligent routing into its Webex Contact Center platform. This positions the company as a frontrunner in enabling enterprises to scale digital-first engagement while reducing operational overhead. Cisco differentiates itself through its robust security architecture and end-to-end cloud networking capabilities, which are particularly valuable for highly regulated industries managing sensitive customer data. Strategic partnerships with AI startups and cloud providers further strengthen its ability to deliver adaptive, hybrid solutions that combine reliability with advanced personalization features.
Microsoft Corporation: Microsoft leverages its Azure ecosystem and Dynamics 365 platform to deliver a deeply integrated CCaaS offering that capitalizes on the convergence of AI, data analytics, and enterprise collaboration tools. In 2025, Microsoft’s emphasis lies in embedding generative AI across customer service workflows, from intelligent chatbots and virtual agents to real-time sentiment analysis and automated knowledge retrieval. The company’s integration of Microsoft Teams into contact center workflows provides a seamless bridge between front-office and back-office operations, enabling faster resolution times and improved customer satisfaction. Microsoft’s competitive edge stems from its ability to unify enterprise applications, data, and AI under a single cloud ecosystem, making it a preferred partner for large-scale digital transformation projects.
Genesys: Genesys remains one of the most specialized players in the global CCaaS market, with a reputation for innovation in AI-powered customer engagement. Its Genesys Cloud CX platform continues to evolve in 2025 with advanced conversational AI, workforce engagement management, and predictive routing capabilities. Unlike broad-based tech giants, Genesys positions itself as a pure-play leader, focusing on delivering differentiated customer experiences at scale. The company has accelerated investments in generative AI, enabling enterprises to create dynamic, personalized interaction flows that adapt in real time to customer needs. Partnerships with hyperscalers and ecosystem integrations with CRMs further reinforce Genesys’s role as a disruptor in omnichannel engagement strategies.
SAP SE: SAP’s role in the contact center market is increasingly tied to its strengths in enterprise resource planning and customer experience management. By 2025, SAP has embedded AI-driven insights and automation capabilities into its SAP Service Cloud, offering organizations the ability to synchronize customer interactions with core business processes such as supply chain, finance, and human resources. This integrated approach allows companies to leverage customer data for predictive service and enhanced decision-making, setting SAP apart as a data-centric provider. SAP’s strategy emphasizes ecosystem collaboration, combining its ERP backbone with AI-powered engagement tools to support industries where process integration and compliance are critical. This positions the company as a key enabler of end-to-end digital transformation in customer service operations.
Market Key Players
Cisco Systems Inc.
Microsoft Corporation
Genesys
SAP SE
NICE CXone
Enghouse Interactive Inc.
Avaya Inc.
Unify Inc.
Alcatel Lucent Enterprise
Computer Talk Technology Inc.
Oracle Corporation
Driver
AI-Driven Automation Enhancing Customer Engagement and Efficiency
As of 2025, a key growth driver for the Contact Center as a Service (CCaaS) market is the integration of advanced automation and generative AI to streamline customer engagement. Enterprises are leveraging AI-powered routing, real-time analytics, and intelligent virtual assistants to reduce operational costs while delivering faster, more personalized support. These capabilities allow companies to minimize manual intervention, accelerate resolution times, and optimize workforce deployment. For small and medium-sized enterprises in particular, the shift to cloud-based CCaaS platforms eliminates heavy infrastructure costs, enabling cost-effective scalability and improved service quality across multiple communication channels.
Restraint
Cybersecurity and Legacy System Challenges Slowing Market Adoption
Despite strong adoption, the market continues to face challenges from rising cybersecurity risks and data compliance concerns. In 2025, organizations remain cautious about storing sensitive customer information — such as financial records, healthcare data, and personal identifiers — on cloud-based platforms that may be vulnerable to breaches. Legacy system integration also creates friction, as older IT infrastructures are not always compatible with modern CCaaS solutions, leading to higher transition costs and longer implementation timelines. These barriers slow adoption in highly regulated industries such as banking and healthcare, where security lapses could have significant legal and financial consequences.
Opportunity
Growth in Multilingual, Hyper-Personalized AI Contact Solutions
A major opportunity lies in the expansion of AI-driven, multilingual, and hyper-personalized engagement models. As customer bases diversify across regions and languages, companies are increasingly seeking CCaaS platforms equipped with natural language processing, sentiment analysis, and predictive engagement tools. Vendors investing in AI-enhanced capabilities can differentiate by offering proactive support, improved self-service, and contextual responses that strengthen customer loyalty. In addition, the growing emphasis on sustainability in IT operations is prompting enterprises to adopt cloud-based solutions that reduce energy consumption compared to traditional on-premise infrastructure, further reinforcing the market’s long-term growth potential.
Trend
Shift Toward Unified Omnichannel and Intelligent CX Ecosystems
One of the defining trends in 2025 is the convergence of CCaaS with digital transformation ecosystems such as customer data platforms, CRM systems, and workforce optimization tools. Enterprises are moving toward unified platforms that consolidate voice, chat, video, and social media interactions, creating a seamless omnichannel experience. AI-driven digital twins of customer journeys are also emerging, allowing businesses to simulate and optimize engagement flows before deployment. This shift toward intelligent, integrated platforms is reshaping the competitive landscape, with leading vendors like Genesys, Cisco, and Microsoft investing heavily in cloud-native architectures that support predictive, automated, and adaptive customer service models.
Recent Developments
December 2024 – NICE: Launched the CXone Mpower Orchestrator, enabling end-to-end orchestration of customer service workflows through agentic AI integration. This bolstered NICE’s position as a pioneer in automated front‑office and back‑office coordination and elevated its leadership in AI-powered CCaaS platforms.
March 2025 – NICE: Expanded its CXone Mpower platform with the “Orchestrator” module, marking the industry's first true agentic AI solution for customer service automation and earning recognition as Best Innovation in Customer Experience at Enterprise Connect 2025. This milestone reinforces NICE’s strategic differentiation through seamless AI-driven operational orchestration.
June 2025 – ICT Industry Broadcasters: Leading unified communications and technology providers signaled deeper expansion into CCaaS, embedding AI, video, and networking offerings into unified contact center capabilities. This intensifies competition and reflects a pivot toward integrated, full-stack customer experience infrastructure.