Global Contactless Stays Market Size, Share & Analysis By Type of Accommodation (Vacation Rentals, Apartments, Hotels, Resort, Hostels), By Technology Used (Keyless Entry, Mobile Check-In and Check-Outs, Touchless Payment, Other Technologies), By Booking Channel (Online Travel Agencies, Direct Bookings, Travel Agents, Other Channels), By End-User Industry Regions & Key Players – Smart Hospitality Trends & Forecast 2025–2034
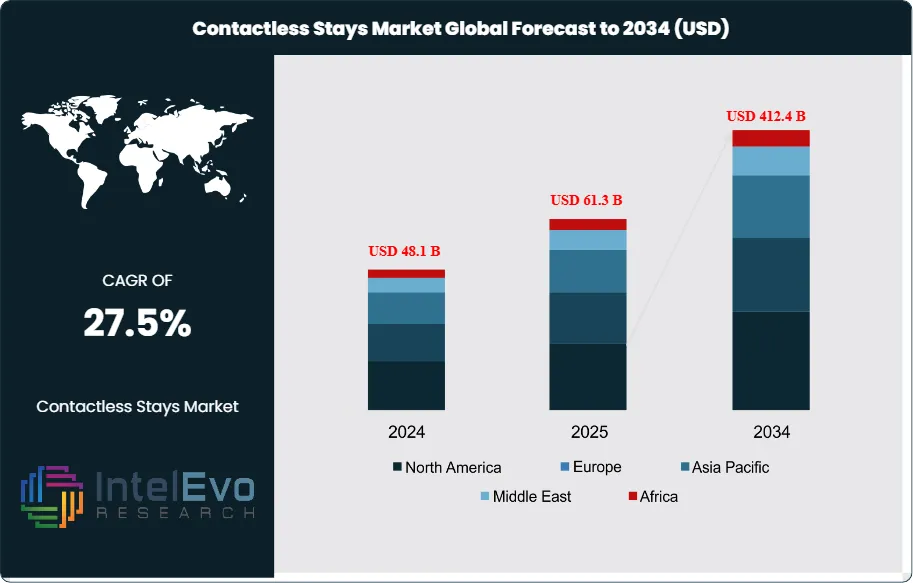
The Contactless Stays Market is estimated at USD 48.1 billion in 2024 and is on track to reach approximately USD 412.4 billion by 2034, implying a strong compound annual growth rate of about 27.5% over 2025–2034. Rapid adoption of digital check-ins, biometric authentication, IoT-enabled room controls, and automation-led guest services continues to reshape the hospitality landscape. As travelers increasingly prioritize safety, convenience, and frictionless experiences, hotels and short-term rentals are accelerating investment in AI-driven concierge tools and app-based property access systems.
This shift is redefining global travel expectations—contactless stays are no longer a pandemic-era trend but a core pillar of next-generation hospitality. With smart hotels expanding across the U.S., Europe, and APAC, the category is set to dominate premium guest engagement strategies and remain one of the fastest-scaling segments in the travel-tech ecosystem.
The contactless stays segment has shifted from a niche accommodation model to a fast-scaling global preference. Initially driven by the operational disruptions of COVID-19, demand accelerated as both travelers and providers prioritized safety, efficiency, and convenience. What began as a pandemic workaround has matured into a competitive necessity across hotels, serviced apartments, and short-term rentals. Adoption has deepened in North America and Western Europe, where over 65% of large hotel chains introduced mobile check-in and digital room access by mid-2024. At the same time, Asia-Pacific is seeing double-digit year-on-year growth in smart hospitality infrastructure, particularly in urban and resort corridors.
Key drivers include rising traveler expectations for autonomy, labor shortages in hospitality, and cost-reduction imperatives. Digital key systems now support over 50 million room nights annually, reducing front desk staffing needs by up to 40% per property. Operators report operational savings of 12–15% after deploying self-service platforms. Yet challenges persist. Capital expenditure on integrated property management systems can be high for mid-sized players. Data privacy regulations remain fragmented, limiting seamless tech deployment in markets like the EU and South Korea.
Technology adoption continues to shape differentiation. Biometric verification, AI-based guest messaging, and IoT-enabled room controls are shifting the service model. In 2024 alone, smart lock installations grew 34%, while over 70% of new hotel builds in the U.S. included digital concierge functionality. Material innovation also plays a role; antimicrobial surface coatings and touchless sensor systems reduce hygiene concerns while supporting operational compliance.
Investor interest is tracking with regional momentum. Dubai and Singapore have emerged as active development hubs, backed by regulatory support for smart tourism. In the U.S., major hospitality REITs are redirecting capital toward retrofit programs for contactless systems across aging portfolios.
As the sector evolves, contactless stays are no longer a feature—they are fast becoming a baseline expectation. Providers who fail to meet this shift risk disintermediation from digital-first platforms and traveler defection to tech-enabled competitors.
Key Takeaways
Market Growth: The global contactless stays market reached USD 48.1 billion in 2024 and is projected to hit USD 412.4 billion by 2034, registering a CAGR of 27.5%. Growth is driven by guest demand for low-touch experiences, labor cost reduction, and widespread digital transformation in hospitality.
Accommodation Type: Vacation rentals lead the market, accounting for over 45% of global revenue in 2024. Their decentralized operations and flexible service models accelerate adoption of keyless access and automated check-in systems.
Technology: Keyless entry systems are the dominant technology, integrated in over 60% of newly built or renovated properties by 2024. Mobile check-in and digital concierge tools are gaining ground, particularly among mid-tier hotel chains and urban serviced apartments.
Driver: Labor shortages and operational efficiency targets are pushing adoption. Properties using mobile-based check-in reported a 12–15% reduction in front desk staffing needs and a 9% increase in guest satisfaction scores.
Restraint: High upfront costs for tech integration and fragmented data privacy laws slow adoption. In the EU, compliance with local data rules has delayed full-scale deployment in over 30% of hotel groups surveyed in 2024.
Opportunity: Asia Pacific offers strong growth potential, with smart hospitality investments rising 18% year-over-year. Urban centers like Tokyo, Seoul, and Bangkok are investing in retrofit-ready infrastructure to support automated stays.
Trend: Digital room access, self-check-in kiosks, and AI-powered guest messaging systems are becoming standard. Smart lock installations rose 34% globally in 2024, with brands like Marriott and Hilton expanding contactless service models across major city properties.
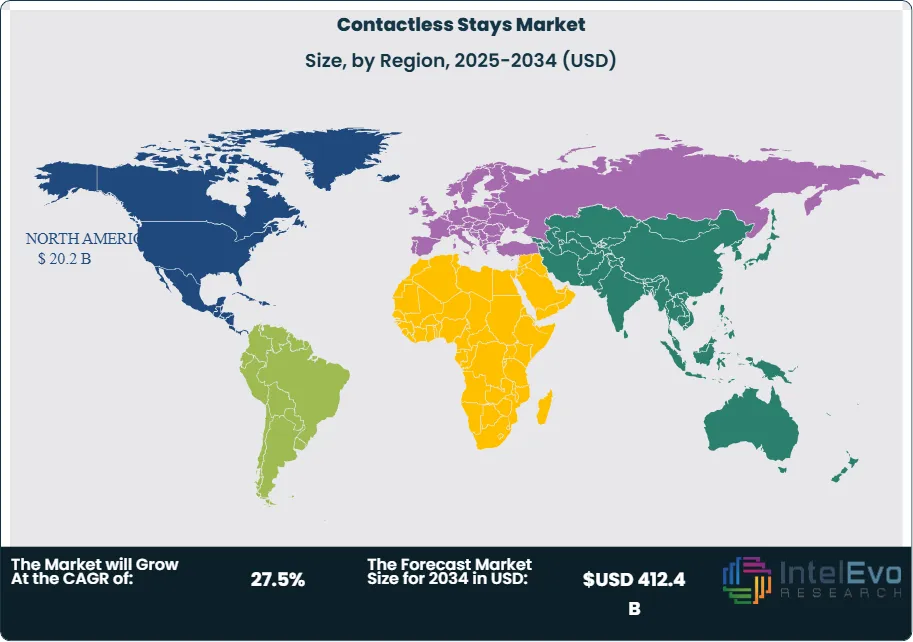
Regional Analysis: North America holds the largest revenue share at 38% in 2024, driven by early tech adoption and strong OTA partnerships. Asia Pacific is the fastest-growing region, forecasted to grow at a CAGR above 28% through 2032 due to rising domestic tourism and government-backed smart travel initiatives.
Accommodation Type
Vacation rentals remain the highest-performing segment within the global contactless stays market, contributing an estimated 38.5% to total market revenue in 2022. This category continues to gain momentum in 2025, supported by a projected CAGR of 26.2% through 2032. The operational model of vacation rentals—typically run by individuals or small-scale property managers—allows for quicker implementation of digital systems such as self-check-in, smart locks, and automated communication. Platforms like Airbnb and Vrbo have invested heavily in mobile-based access solutions and cleaning protocols, reinforcing guest confidence and streamlining property turnover.
Apartments represent the fastest-growing accommodation segment in this market. With an estimated market share of 24.5% in 2022, apartment-based stays have surged due to rising demand for private, low-contact environments. These properties often feature in-unit amenities such as kitchens and laundry, aligning with guest preferences for autonomy and hygiene. As of 2025, mid-tier serviced apartments in urban centers are increasingly integrating app-based access and automated checkout systems to meet growing traveler expectations and maintain competitive differentiation.
Technology Analysis
Keyless entry systems accounted for the largest share of revenue in 2022, contributing 48.6% to the global contactless stays technology market. These systems—enabled via mobile phones, RFID cards, or Bluetooth—allow guests to access their rooms without front desk interaction. By 2025, adoption is accelerating, particularly among hotel chains seeking to cut labor costs and reduce guest wait times. Property managers report improved operational efficiency and higher guest satisfaction scores following keyless system implementation, with some reporting a 15% reduction in overhead tied to staffing.
Mobile check-in and check-out services are the fastest-expanding segment within the technology category, recording a CAGR of 26.6% from 2022 to 2031. These tools enable guests to manage their arrivals and departures via smartphone apps, reducing the need for physical touchpoints. By 2025, over 70% of new hospitality developments in North America and Europe have embedded mobile check-in options into their booking infrastructure. This shift aligns with broader consumer behavior trends favoring speed, autonomy, and minimal contact.
Booking Channel Analysis
Online travel agencies (OTAs) continue to dominate the booking landscape for contactless stays, with a 51.2% share in 2022 and an expected CAGR of 27.8% through the forecast period. OTAs have been quick to integrate contactless technologies, including seamless payment gateways, mobile check-ins, and digital guest communication. Their platforms cater to a broad customer base seeking convenience and real-time availability, making them a preferred channel for both independent travelers and business users.
Direct bookings are gaining ground as the fastest-growing channel, with a projected CAGR of 26.3%. By 2025, this segment accounts for an estimated 26.8% of market value. Hotels and vacation rental hosts are increasingly investing in their own websites and reservation tools to reduce reliance on third-party platforms. Direct bookings allow operators to control the end-to-end guest experience, offer flexible pricing, and establish more personalized relationships—all while reducing commission costs. As mobile responsiveness and integrated tech improve, this channel is expected to capture a larger share of repeat customers.
Regional Analysis
North America led the global contactless stays market in 2022, accounting for 40.6% of total revenue. The region continues to hold its lead in 2025, driven by widespread tech infrastructure, high mobile penetration, and aggressive investment in smart hospitality. Major hotel chains and rental operators across the U.S. and Canada have retrofitted existing properties with digital locks, self-service kiosks, and automated messaging systems. The early influence of the COVID-19 pandemic further catalyzed adoption, and contactless service is now seen as a standard offering across urban and leisure travel markets.
Asia Pacific is the fastest-growing regional market, posting a CAGR of 25.8% and a projected market value of 25.5% by 2025. Demand is being fueled by a rising middle class, growing domestic tourism, and strong government support for smart infrastructure. Countries like China, Japan, and South Korea are expanding hotel and vacation rental footprints, with high adoption rates of mobile-first platforms. In Japan, for example, over 60% of new hotel developments in 2024 integrated contactless guest entry and voice-assisted room controls. This momentum is expected to continue as digital solutions become embedded in standard hospitality operations across the region.
By Type of Accommodation (Vacation Rentals, Apartments, Hotels, Resort, Hostels), By Technology Used (Keyless Entry, Mobile Check-In and Check-Outs, Touchless Payment, Other Technologies), By Booking Channel (Online Travel Agencies, Direct Bookings, Travel Agents, Other Channels)
Research Methodology
Primary Research- 100 Interviews of Stakeholders
Secondary Research
Desk Research
Regional scope
North America (United States, Canada, Mexico)
Latin America (Brazil, Argentina, Columbia)
East Asia And Pacific (China, Japan, South Korea, Australia, Cambodia, Fiji, Indonesia)
Sea And South Asia (India, Singapore, Thailand, Taiwan, Malaysia)
Eastern Europe (Poland, Russia, Czech Republic, Romania)
Western Europe (Germany, U.K., France, Spain, Itlay)
Middle East & Africa (GCC Countries, Egypt, Nigeria, South Africa, Israel)
Customization for segments, region/country-level will be provided. Moreover, additional customization can be done based on the requirements.
Pricing and Purchase Options
Avail customized purchase options to meet your exact research needs. We have three licenses to opt for: Single User License, Multi-User License (Up to 5 Users), Corporate Use License (Unlimited User and Printable PDF).
TABLE OF CONTENTS
1. EXECUTIVE SUMMARY
1.1. MARKET SNAPSHOT
1.2. KEY FINDINGS & INSIGHTS
1.3. ANALYST RECOMMENDATIONS
1.4. FUTURE OUTLOOK
2. RESEARCH METHODOLOGY
2.1. MARKET DEFINITION & SCOPE
2.2. RESEARCH OBJECTIVES: PRIMARY & SECONDARY DATA SOURCES
2.3. DATA COLLECTION SOURCES
2.3.1. COVERAGE OF 100+ PRIMARY RESEARCH/CONSULTATION CALLS WITH INDUSTRY STAKEHOLDERS
FIGURE 17 NORTH AMERICA CONTACTLESS STAYS CURRENT AND FUTURE TYPE ANALYSIS, 2025–2034, (USD MILLION)
FIGURE 18 NORTH AMERICA CONTACTLESS STAYS CURRENT AND FUTURE END USER ANALYSIS, 2025–2034, (USD MILLION)
FIGURE 19 MARKET SHARE BY COUNTRY
FIGURE 20 LATIN AMERICA CONTACTLESS STAYS CURRENT AND FUTURE TYPE ANALYSIS, 2025–2034, (USD MILLION)
FIGURE 21 LATIN AMERICA CONTACTLESS STAYS CURRENT AND FUTURE END USER ANALYSIS, 2025–2034, (USD MILLION)
FIGURE 22 MARKET SHARE BY COUNTRY
FIGURE 23 EASTERN EUROPE CONTACTLESS STAYS CURRENT AND FUTURE TYPE ANALYSIS, 2025–2034, (USD MILLION)
FIGURE 24 EASTERN EUROPE CONTACTLESS STAYS CURRENT AND FUTURE END USER ANALYSIS, 2025–2034, (USD MILLION)
FIGURE 25 MARKET SHARE BY COUNTRY
FIGURE 26 WESTERN EUROPE CONTACTLESS STAYS CURRENT AND FUTURE TYPE ANALYSIS, 2025–2034, (USD MILLION)
FIGURE 27 WESTERN EUROPE CONTACTLESS STAYS CURRENT AND FUTURE END USER ANALYSIS, 2025–2034, (USD MILLION)
FIGURE 28 MARKET SHARE BY COUNTRY
FIGURE 29 EAST ASIA AND PACIFIC CONTACTLESS STAYS CURRENT AND FUTURE TYPE ANALYSIS, 2025–2034, (USD MILLION)
FIGURE 30 EAST ASIA AND PACIFIC CONTACTLESS STAYS CURRENT AND FUTURE END USER ANALYSIS, 2025–2034, (USD MILLION)
FIGURE 31 MARKET SHARE BY COUNTRY
FIGURE 32 SEA AND SOUTH ASIA CONTACTLESS STAYS CURRENT AND FUTURE TYPE ANALYSIS, 2025–2034, (USD MILLION)
FIGURE 33 SEA AND SOUTH ASIA CONTACTLESS STAYS CURRENT AND FUTURE END USER ANALYSIS, 2025–2034, (USD MILLION)
FIGURE 34 MARKET SHARE BY COUNTRY
FIGURE 35 MIDDLE EAST AND AFRICA CONTACTLESS STAYS CURRENT AND FUTURE TYPE ANALYSIS, 2025–2034, (USD MILLION)
FIGURE 36 MIDDLE EAST AND AFRICA CONTACTLESS STAYS CURRENT AND FUTURE END USER ANALYSIS, 2025–2034, (USD MILLION)
FIGURE 37 NORTH AMERICA CONTACTLESS STAYS CURRENT AND FUTURE MARKET VOLUME SHARE REGIONAL ANALYSIS, 2025–2034, (USD MILLION)
FIGURE 38 U.S. CONTACTLESS STAYS CURRENT AND FUTURE TYPE ANALYSIS, 2025–2034, (USD MILLION)
FIGURE 39 U.S. CONTACTLESS STAYS CURRENT AND FUTURE END USER ANALYSIS, 2025–2034, (USD MILLION)
FIGURE 40 CANADA CONTACTLESS STAYS CURRENT AND FUTURE TYPE ANALYSIS, 2025–2034, (USD MILLION)
FIGURE 41 CANADA CONTACTLESS STAYS CURRENT AND FUTURE END USER ANALYSIS, 2025–2034, (USD MILLION)
FIGURE 42 LATIN AMERICA CONTACTLESS STAYS CURRENT AND FUTURE MARKET VOLUME SHARE REGIONAL ANALYSIS, 2025–2034, (USD MILLION)
FIGURE 43 MEXICO CONTACTLESS STAYS CURRENT AND FUTURE TYPE ANALYSIS, 2025–2034, (USD MILLION)
FIGURE 44 MEXICO CONTACTLESS STAYS CURRENT AND FUTURE END USER ANALYSIS, 2025–2034, (USD MILLION)
FIGURE 45 BRAZIL CONTACTLESS STAYS CURRENT AND FUTURE TYPE ANALYSIS, 2025–2034, (USD MILLION)
FIGURE 46 BRAZIL CONTACTLESS STAYS CURRENT AND FUTURE END USER ANALYSIS, 2025–2034, (USD MILLION)
FIGURE 47 ARGENTINA CONTACTLESS STAYS CURRENT AND FUTURE TYPE ANALYSIS, 2025–2034, (USD MILLION)
FIGURE 48 ARGENTINA CONTACTLESS STAYS CURRENT AND FUTURE END USER ANALYSIS, 2025–2034, (USD MILLION)
FIGURE 49 COLUMBIA CONTACTLESS STAYS CURRENT AND FUTURE TYPE ANALYSIS, 2025–2034, (USD MILLION)
FIGURE 50 COLUMBIA CONTACTLESS STAYS CURRENT AND FUTURE END USER ANALYSIS, 2025–2034, (USD MILLION)
FIGURE 51 REST OF LATIN AMERICA CONTACTLESS STAYS CURRENT AND FUTURE TYPE ANALYSIS, 2025–2034, (USD MILLION)
FIGURE 52 REST OF LATIN AMERICA CONTACTLESS STAYS CURRENT AND FUTURE END USER ANALYSIS, 2025–2034, (USD MILLION)
FIGURE 53 EASTERN EUROPE CONTACTLESS STAYS CURRENT AND FUTURE MARKET VOLUME SHARE REGIONAL ANALYSIS, 2025–2034, (USD MILLION)
FIGURE 54 POLAND CONTACTLESS STAYS CURRENT AND FUTURE TYPE ANALYSIS, 2025–2034, (USD MILLION)
FIGURE 55 POLAND CONTACTLESS STAYS CURRENT AND FUTURE END USER ANALYSIS, 2025–2034, (USD MILLION)
FIGURE 56 RUSSIA CONTACTLESS STAYS CURRENT AND FUTURE TYPE ANALYSIS, 2025–2034, (USD MILLION)
FIGURE 57 RUSSIA CONTACTLESS STAYS CURRENT AND FUTURE END USER ANALYSIS, 2025–2034, (USD MILLION)
FIGURE 58 CZECH REPUBLIC CONTACTLESS STAYS CURRENT AND FUTURE TYPE ANALYSIS, 2025–2034, (USD MILLION)
FIGURE 59 CZECH REPUBLIC CONTACTLESS STAYS CURRENT AND FUTURE END USER ANALYSIS, 2025–2034, (USD MILLION)
FIGURE 60 ROMANIA CONTACTLESS STAYS CURRENT AND FUTURE TYPE ANALYSIS, 2025–2034, (USD MILLION)
FIGURE 61 ROMANIA CONTACTLESS STAYS CURRENT AND FUTURE END USER ANALYSIS, 2025–2034, (USD MILLION)
FIGURE 62 REST OF EASTERN EUROPE CONTACTLESS STAYS CURRENT AND FUTURE TYPE ANALYSIS, 2025–2034, (USD MILLION)
FIGURE 63 REST OF EASTERN EUROPE CONTACTLESS STAYS CURRENT AND FUTURE END USER ANALYSIS, 2025–2034, (USD MILLION)
FIGURE 64 WESTERN EUROPE CONTACTLESS STAYS CURRENT AND FUTURE MARKET VOLUME SHARE REGIONAL ANALYSIS, 2025–2034, (USD MILLION)
FIGURE 65 GERMANY CONTACTLESS STAYS CURRENT AND FUTURE TYPE ANALYSIS, 2025–2034, (USD MILLION)
FIGURE 66 GERMANY CONTACTLESS STAYS CURRENT AND FUTURE END USER ANALYSIS, 2025–2034, (USD MILLION)
FIGURE 67 FRANCE CONTACTLESS STAYS CURRENT AND FUTURE TYPE ANALYSIS, 2025–2034, (USD MILLION)
FIGURE 68 FRANCE CONTACTLESS STAYS CURRENT AND FUTURE END USER ANALYSIS, 2025–2034, (USD MILLION)
FIGURE 69 UK CONTACTLESS STAYS CURRENT AND FUTURE TYPE ANALYSIS, 2025–2034, (USD MILLION)
FIGURE 70 UK CONTACTLESS STAYS CURRENT AND FUTURE END USER ANALYSIS, 2025–2034, (USD MILLION)
FIGURE 71 SPAIN CONTACTLESS STAYS CURRENT AND FUTURE TYPE ANALYSIS, 2025–2034, (USD MILLION)
FIGURE 72 SPAIN CONTACTLESS STAYS CURRENT AND FUTURE END USER ANALYSIS, 2025–2034, (USD MILLION)
FIGURE 73 ITALY CONTACTLESS STAYS CURRENT AND FUTURE TYPE ANALYSIS, 2025–2034, (USD MILLION)
FIGURE 74 ITALY CONTACTLESS STAYS CURRENT AND FUTURE END USER ANALYSIS, 2025–2034, (USD MILLION)
FIGURE 75 REST OF WESTERN EUROPE CONTACTLESS STAYS CURRENT AND FUTURE TYPE ANALYSIS, 2025–2034, (USD MILLION)
FIGURE 76 REST OF WESTERN EUROPE CONTACTLESS STAYS CURRENT AND FUTURE END USER ANALYSIS, 2025–2034, (USD MILLION)
FIGURE 77 EAST ASIA AND PACIFIC CONTACTLESS STAYS CURRENT AND FUTURE MARKET VOLUME SHARE REGIONAL ANALYSIS, 2025–2034, (USD MILLION)
FIGURE 78 CHINA CONTACTLESS STAYS CURRENT AND FUTURE TYPE ANALYSIS, 2025–2034, (USD MILLION)
FIGURE 79 CHINA CONTACTLESS STAYS CURRENT AND FUTURE END USER ANALYSIS, 2025–2034, (USD MILLION)
FIGURE 80 JAPAN CONTACTLESS STAYS CURRENT AND FUTURE TYPE ANALYSIS, 2025–2034, (USD MILLION)
FIGURE 81 JAPAN CONTACTLESS STAYS CURRENT AND FUTURE END USER ANALYSIS, 2025–2034, (USD MILLION)
FIGURE 82 AUSTRALIA CONTACTLESS STAYS CURRENT AND FUTURE TYPE ANALYSIS, 2025–2034, (USD MILLION)
FIGURE 83 AUSTRALIA CONTACTLESS STAYS CURRENT AND FUTURE END USER ANALYSIS, 2025–2034, (USD MILLION)
FIGURE 84 CAMBODIA CONTACTLESS STAYS CURRENT AND FUTURE TYPE ANALYSIS, 2025–2034, (USD MILLION)
FIGURE 85 CAMBODIA CONTACTLESS STAYS CURRENT AND FUTURE END USER ANALYSIS, 2025–2034, (USD MILLION)
FIGURE 86 FIJI CONTACTLESS STAYS CURRENT AND FUTURE TYPE ANALYSIS, 2025–2034, (USD MILLION)
FIGURE 87 FIJI CONTACTLESS STAYS CURRENT AND FUTURE END USER ANALYSIS, 2025–2034, (USD MILLION)
FIGURE 88 INDONESIA CONTACTLESS STAYS CURRENT AND FUTURE TYPE ANALYSIS, 2025–2034, (USD MILLION)
FIGURE 89 INDONESIA CONTACTLESS STAYS CURRENT AND FUTURE END USER ANALYSIS, 2025–2034, (USD MILLION)
FIGURE 90 SOUTH KOREA CONTACTLESS STAYS CURRENT AND FUTURE TYPE ANALYSIS, 2025–2034, (USD MILLION)
FIGURE 91 SOUTH KOREA CONTACTLESS STAYS CURRENT AND FUTURE END USER ANALYSIS, 2025–2034, (USD MILLION)
FIGURE 92 REST OF EAST ASIA AND PACIFIC CONTACTLESS STAYS CURRENT AND FUTURE TYPE ANALYSIS, 2025–2034, (USD MILLION)
FIGURE 93 REST OF EAST ASIA AND PACIFIC CONTACTLESS STAYS CURRENT AND FUTURE END USER ANALYSIS, 2025–2034, (USD MILLION)
FIGURE 94 SEA AND SOUTH ASIA CONTACTLESS STAYS CURRENT AND FUTURE MARKET VOLUME SHARE REGIONAL ANALYSIS, 2025–2034, (USD MILLION)
FIGURE 95 BANGLADESH CONTACTLESS STAYS CURRENT AND FUTURE TYPE ANALYSIS, 2025–2034, (USD MILLION)
FIGURE 96 BANGLADESH CONTACTLESS STAYS CURRENT AND FUTURE END USER ANALYSIS, 2025–2034, (USD MILLION)
FIGURE 97 NEW ZEALAND CONTACTLESS STAYS CURRENT AND FUTURE TYPE ANALYSIS, 2025–2034, (USD MILLION)
FIGURE 98 NEW ZEALAND CONTACTLESS STAYS CURRENT AND FUTURE END USER ANALYSIS, 2025–2034, (USD MILLION)
FIGURE 99 INDIA CONTACTLESS STAYS CURRENT AND FUTURE TYPE ANALYSIS, 2025–2034, (USD MILLION)
FIGURE 100 INDIA CONTACTLESS STAYS CURRENT AND FUTURE END USER ANALYSIS, 2025–2034, (USD MILLION)
FIGURE 101 SINGAPORE CONTACTLESS STAYS CURRENT AND FUTURE TYPE ANALYSIS, 2025–2034, (USD MILLION)
FIGURE 102 SINGAPORE CONTACTLESS STAYS CURRENT AND FUTURE END USER ANALYSIS, 2025–2034, (USD MILLION)
FIGURE 103 THAILAND CONTACTLESS STAYS CURRENT AND FUTURE TYPE ANALYSIS, 2025–2034, (USD MILLION)
FIGURE 104 THAILAND CONTACTLESS STAYS CURRENT AND FUTURE END USER ANALYSIS, 2025–2034, (USD MILLION)
FIGURE 105 TAIWAN CONTACTLESS STAYS CURRENT AND FUTURE TYPE ANALYSIS, 2025–2034, (USD MILLION)
FIGURE 106 TAIWAN CONTACTLESS STAYS CURRENT AND FUTURE END USER ANALYSIS, 2025–2034, (USD MILLION)
FIGURE 107 MALAYSIA CONTACTLESS STAYS CURRENT AND FUTURE TYPE ANALYSIS, 2025–2034, (USD MILLION)
FIGURE 108 MALAYSIA CONTACTLESS STAYS CURRENT AND FUTURE END USER ANALYSIS, 2025–2034, (USD MILLION)
FIGURE 109 REST OF SEA AND SOUTH ASIA CONTACTLESS STAYS CURRENT AND FUTURE TYPE ANALYSIS, 2025–2034, (USD MILLION)
FIGURE 110 REST OF SEA AND SOUTH ASIA CONTACTLESS STAYS CURRENT AND FUTURE END USER ANALYSIS, 2025–2034, (USD MILLION)
FIGURE 111 MIDDLE EAST AND AFRICA CONTACTLESS STAYS CURRENT AND FUTURE MARKET VOLUME SHARE REGIONAL ANALYSIS, 2025–2034, (USD MILLION)
FIGURE 112 GCC COUNTRIES CONTACTLESS STAYS CURRENT AND FUTURE TYPE ANALYSIS, 2025–2034, (USD MILLION)
FIGURE 113 GCC COUNTRIES CONTACTLESS STAYS CURRENT AND FUTURE END USER ANALYSIS, 2025–2034, (USD MILLION)
FIGURE 114 SAUDI ARABIA CONTACTLESS STAYS CURRENT AND FUTURE TYPE ANALYSIS, 2025–2034, (USD MILLION)
FIGURE 115 SAUDI ARABIA CONTACTLESS STAYS CURRENT AND FUTURE END USER ANALYSIS, 2025–2034, (USD MILLION)
FIGURE 116 UAE CONTACTLESS STAYS CURRENT AND FUTURE TYPE ANALYSIS, 2025–2034, (USD MILLION)
FIGURE 117 UAE CONTACTLESS STAYS CURRENT AND FUTURE END USER ANALYSIS, 2025–2034, (USD MILLION)
FIGURE 118 BAHRAIN CONTACTLESS STAYS CURRENT AND FUTURE TYPE ANALYSIS, 2025–2034, (USD MILLION)
FIGURE 119 BAHRAIN CONTACTLESS STAYS CURRENT AND FUTURE END USER ANALYSIS, 2025–2034, (USD MILLION)
FIGURE 120 KUWAIT CONTACTLESS STAYS CURRENT AND FUTURE TYPE ANALYSIS, 2025–2034, (USD MILLION)
FIGURE 121 KUWAIT CONTACTLESS STAYS CURRENT AND FUTURE END USER ANALYSIS, 2025–2034, (USD MILLION)
FIGURE 122 OMAN CONTACTLESS STAYS CURRENT AND FUTURE TYPE ANALYSIS, 2025–2034, (USD MILLION)
FIGURE 123 OMAN CONTACTLESS STAYS CURRENT AND FUTURE END USER ANALYSIS, 2025–2034, (USD MILLION)
FIGURE 124 QATAR CONTACTLESS STAYS CURRENT AND FUTURE TYPE ANALYSIS, 2025–2034, (USD MILLION)
FIGURE 125 QATAR CONTACTLESS STAYS CURRENT AND FUTURE END USER ANALYSIS, 2025–2034, (USD MILLION)
FIGURE 126 EGYPT CONTACTLESS STAYS CURRENT AND FUTURE TYPE ANALYSIS, 2025–2034, (USD MILLION)
FIGURE 127 EGYPT CONTACTLESS STAYS CURRENT AND FUTURE END USER ANALYSIS, 2025–2034, (USD MILLION)
FIGURE 128 NIGERIA CONTACTLESS STAYS CURRENT AND FUTURE TYPE ANALYSIS, 2025–2034, (USD MILLION)
FIGURE 129 NIGERIA CONTACTLESS STAYS CURRENT AND FUTURE END USER ANALYSIS, 2025–2034, (USD MILLION)
FIGURE 130 SOUTH AFRICA CONTACTLESS STAYS CURRENT AND FUTURE TYPE ANALYSIS, 2025–2034, (USD MILLION)
FIGURE 131 SOUTH AFRICA CONTACTLESS STAYS CURRENT AND FUTURE END USER ANALYSIS, 2025–2034, (USD MILLION)
FIGURE 132 ISRAEL CONTACTLESS STAYS CURRENT AND FUTURE TYPE ANALYSIS, 2025–2034, (USD MILLION)
FIGURE 133 ISRAEL CONTACTLESS STAYS CURRENT AND FUTURE END USER ANALYSIS, 2025–2034, (USD MILLION)
FIGURE 134 REST OF MEA CONTACTLESS STAYS CURRENT AND FUTURE TYPE ANALYSIS, 2025–2034, (USD MILLION)
FIGURE 135 REST OF MEA CONTACTLESS STAYS CURRENT AND FUTURE END USER ANALYSIS, 2025–2034, (USD MILLION)
FIGURE 136 U. S. MARKET SHARE ANALYSIS BY TYPE (2024)
FIGURE 137 U. S. MARKET SHARE ANALYSIS BY END USER (2024)
FIGURE 138 CANADA MARKET SHARE ANALYSIS BY TYPE (2024)
FIGURE 139 CANADA MARKET SHARE ANALYSIS BY END USER (2024)
FIGURE 140 MEXICO MARKET SHARE ANALYSIS BY TYPE (2024)
FIGURE 141 MEXICO MARKET SHARE ANALYSIS BY END USER (2024)
FIGURE 142 CHINA MARKET SHARE ANALYSIS BY TYPE (2024)
FIGURE 143 CHINA MARKET SHARE ANALYSIS BY END USER (2024)
FIGURE 144 JAPAN MARKET SHARE ANALYSIS BY TYPE (2024)
FIGURE 145 JAPAN MARKET SHARE ANALYSIS BY END USER (2024)
FIGURE 146 INDIA MARKET SHARE ANALYSIS BY TYPE (2024)
FIGURE 147 INDIA MARKET SHARE ANALYSIS BY END USER (2024)
FIGURE 148 SOUTH KOREA MARKET SHARE ANALYSIS BY TYPE (2024)
FIGURE 149 SOUTH KOREA MARKET SHARE ANALYSIS BY END USER (2024)
FIGURE 150 SAUDI ARABIA MARKET SHARE ANALYSIS BY TYPE (2024)
FIGURE 151 SAUDI ARABIA MARKET SHARE ANALYSIS BY END USER (2024)
FIGURE 152 UAE MARKET SHARE ANALYSIS BY TYPE (2024)
FIGURE 153 UAE MARKET SHARE ANALYSIS BY END USER (2024)
FIGURE 154 EGYPT MARKET SHARE ANALYSIS BY TYPE (2024)
FIGURE 155 EGYPT MARKET SHARE ANALYSIS BY END USER (2024)
FIGURE 156 NIGERIA MARKET SHARE ANALYSIS BY TYPE (2024)
FIGURE 157 NIGERIA MARKET SHARE ANALYSIS BY END USER (2024)
FIGURE 158 SOUTH AFRICA MARKET SHARE ANALYSIS BY TYPE (2024)
FIGURE 159 SOUTH AFRICA MARKET SHARE ANALYSIS BY END USER (2024)
FIGURE 160 GERMANY MARKET SHARE ANALYSIS BY TYPE (2024)
FIGURE 161 GERMANY MARKET SHARE ANALYSIS BY END USER (2024)
FIGURE 162 FRANCE MARKET SHARE ANALYSIS BY TYPE (2024)
FIGURE 163 FRANCE MARKET SHARE ANALYSIS BY END USER (2024)
FIGURE 164 UK MARKET SHARE ANALYSIS BY TYPE (2024)
FIGURE 165 UK MARKET SHARE ANALYSIS BY END USER (2024)
FIGURE 166 SPAIN MARKET SHARE ANALYSIS BY TYPE (2024)
FIGURE 167 SPAIN MARKET SHARE ANALYSIS BY END USER (2024)
FIGURE 168 ITALY MARKET SHARE ANALYSIS BY TYPE (2024)
FIGURE 169 ITALY MARKET SHARE ANALYSIS BY END USER (2024)
FIGURE 170 BRAZIL MARKET SHARE ANALYSIS BY TYPE (2024)
FIGURE 171 BRAZIL MARKET SHARE ANALYSIS BY END USER (2024)
FIGURE 172 ARGENTINA MARKET SHARE ANALYSIS BY TYPE (2024)
FIGURE 173 ARGENTINA MARKET SHARE ANALYSIS BY END USER (2024)
FIGURE 174 COLUMBIA MARKET SHARE ANALYSIS BY TYPE (2024)
FIGURE 175 COLUMBIA MARKET SHARE ANALYSIS BY END USER (2024)
FIGURE 176 GLOBAL CONTACTLESS STAYS CURRENT AND FUTURE MARKET KEY COUNTRY LEVEL ANALYSIS, 2024–2034, (USD MILLION)
FIGURE 177 FINANCIAL OVERVIEW:
Key Player Analysis
Airbnb.co.in: Airbnb continues to lead the vacation rental segment in the global contactless stays market, operating as a key disruptor in traditional hospitality. Its platform-based model enables direct-to-consumer bookings and rapid deployment of contactless features, including smart lock integration, self-check-in tools, and automated messaging. As of Q2 2025, over 80% of Airbnb listings in top urban markets offer contactless check-in, reflecting strong host adoption. The company has expanded its Airbnb-friendly apartment program in India and Southeast Asia, aligning with urban rental growth and rising digital travel preferences. Airbnb’s AI-driven personalization engine—launched in late 2024—allows tailored recommendations and predictive pricing, enhancing both guest retention and booking frequency.
Marriott International: Marriott positions itself as a global leader in integrating contactless technology within full-service hospitality. The company has deployed its "Mobile Key" service across 5,000+ properties globally as of early 2025, supported by its Marriott Bonvoy app. Marriott has invested in AI-powered service automation and real-time personalization features, including room selection, digital concierge, and on-demand housekeeping. In 2024, Marriott expanded its smart property infrastructure in the Middle East and North Africa through a $600 million tech-focused renovation program. This positions the brand competitively in tech-enabled premium stays while reinforcing its regional footprint in high-growth tourism corridors.
Hilton Worldwide Holdings Inc.: Hilton remains a challenger with strong digital adoption across its portfolio. The company’s Hilton Honors app, integrated with Digital Key and contactless booking tools, saw a 28% increase in active users in 2024. Hilton’s "Connected Room" initiative, now rolled out in 60% of its U.S. properties, allows guests to control lighting, temperature, and entertainment systems via mobile. Hilton has also emphasized sustainability, using contactless systems to reduce energy use and paper-based processes. Strategic partnerships with property tech firms in Europe have accelerated the group’s retrofit program, enabling older assets to align with evolving guest expectations in the contactless segment.
Booking.com: Booking.com acts as a dominant aggregator and a technology partner for small-to-mid-sized hospitality providers adopting contactless systems. With over 28 million listings, it offers the largest inventory of properties with mobile check-in and keyless access features. In 2025, the platform’s Smart Hotel Tools suite expanded to include automated guest messaging, room access APIs, and payment integration for independent operators. Booking Holdings reported that 62% of total bookings in 2024 were processed via mobile, underscoring the shift toward mobile-first travel. Its strategic push into Asia Pacific and Latin America includes region-specific enhancements and localized app features, positioning it as a key enabler of digital transformation in emerging markets.
Market Key Players
Booking.com
Hilton Worldwide Holdings Inc.
OYO Rooms
AccorHotels S.A.
Agoda.com
Expedia Group
Airbnb.co.in
Marriott International
Other Players
Driver
Shift Toward Fully Digital Guest Journeys
By 2025, contactless stays will have changed from a temporary response to the pandemic into a lasting and expected standard in the hospitality industry. Demand continues to grow due to operational convenience, improved guest safety, and the development of digital personalization tools that simplify the entire guest experience. Travelers are increasingly choosing to manage bookings, check-ins, room access, and payments entirely through mobile devices. As of 2025, over 65% of mid-to-large hotel groups worldwide have adopted mobile check-in and keyless entry systems, reinforcing the shift toward smooth, guest-led interactions.
Operational Efficiency and Satisfaction Gains
For operators, adopting contactless systems has led to noticeable improvements in efficiency and service delivery. Many hospitality providers report up to a 40% drop in front-desk traffic and around 15% savings in staffing costs due to automation of routine tasks. These efficiencies result in faster service, shorter wait times, and higher guest satisfaction scores. Consequently, digital-first service models are increasingly recognized as not just enhancements but also as long-term operational assets that boost competitiveness and create lasting value for technology-enabled hospitality businesses.
Restraint
High Upfront Costs and Infrastructure Gaps
Despite strong demand, the broad adoption of contactless stay technologies faces financial and operational challenges, especially among small and independent businesses. Installing secure digital systems, like keyless entry, integrated PMS platforms, and automated payment tools, can cost between USD 15,000 and 30,000 per property, creating hurdles for budget-conscious operators. In areas with limited broadband infrastructure, unreliable connectivity can disrupt essential functions, causing service failures that negatively affect guest experiences.
Data Privacy Concerns and Trust Risks
Consumer hesitancy regarding data privacy also limits adoption. In 2024, over 20% of travelers in Europe expressed discomfort with sharing biometric, geolocation, or identity-linked data needed for fully automated stays. System downtime, cyber vulnerabilities, and inconsistent user experiences heighten trust issues, potentially harming brand reputation if not proactively addressed. Providers that cannot guarantee strong security, clear consent, and dependable digital functionality may see slower adoption rates and higher turnover among travelers concerned about privacy.
Opportunity
Expansion Across New Hospitality Segments
There is a significant opportunity to extend contactless technologies beyond traditional hotels into emerging accommodation types. Vacation rentals, serviced apartments, and co-living spaces represent rapidly growing segments where contactless systems boost safety, operational efficiency, and guest control. This wider adoption is expected to support a market CAGR of about 26.5% through 2032. As operators diversify their offerings, digital key systems, remote access management, and automated guest communications will become important differentiators for scaling multi-unit property networks.
Smart Rooms and Sustainability-Driven Demand
Smart home-style features are opening new avenues for differentiation and revenue growth. App-controlled lighting, AI-driven climate control, and in-room wellness technologies appeal to younger, tech-savvy travelers looking for personalized environments. At the same time, energy-efficient contactless systems align with increasing ESG priorities, offering both environmental and operational benefits. As sustainability and health-conscious travel trends grow, properties that invest in innovative, contactless, and eco-friendly technologies are set to capture premium demand and enhance their competitive edge.
Trend
Rise of Autonomous, Self-Service Hospitality
By 2025, self-service hospitality models will reshape global market dynamics. More than 70% of new hotel developments in North America now include digital key technology as a standard feature, allowing guests to skip traditional reception desks entirely. Contactless payments have become the norm, with adoption exceeding 80% across major online travel agencies. This shift supports faster transaction cycles, smoother check-in/check-out processes, and greater operational agility for hotel operators coping with labor constraints.
Mobile-Enabled Upselling and Short-Term Rental Growth
Mobile apps now serve as complete guest engagement platforms, enabling hotels to provide personalized recommendations, upsell on-site services, and manage real-time interactions. Combined with the 18% year-over-year increase in demand for short-term rentals, this creates a broader ecosystem of autonomy-driven travel experiences where guests expect full control and minimal human interaction. As digital habits evolve, contactless travel increasingly reflects a lifestyle choice rather than just a convenience feature, fostering sustained adoption across all hospitality sectors.
Recent Developments
Dec 2024 – Hilton Worldwide Holdings Inc.: Hilton expanded its Connected Room technology to 500 additional properties across North America, bringing total deployment to over 60% of its U.S. portfolio. This move enables mobile-based control of room settings and further supports the company’s push toward contactless guest experiences. It strengthens Hilton’s positioning in the mid-to-premium smart stay segment.
Feb 2025 – Airbnb: Airbnb launched its AI-powered “Smart Host” feature across India, Japan, and Brazil, enabling automated guest communications, check-in instructions, and personalized local recommendations. The tool has seen 35% host adoption in key cities within the first 60 days. This enhances Airbnb’s competitiveness in non-hotel accommodations and scales automation across emerging markets.
Apr 2025 – Marriott International: Marriott entered into a USD 420 million partnership with a leading property tech firm to retrofit over 1,200 properties across Europe with mobile key and voice-enabled room controls by 2026. The initiative accelerates Marriott’s technology rollout in regulated markets while reducing reliance on front desk labor.
Jul 2025 – Booking.com: Booking.com introduced its "Smart Stay Toolkit" for independent hotels and short-term rentals, bundling digital check-in, keyless entry integration, and real-time guest messaging. The company reports a 22% increase in partner adoption across Southeast Asia since launch. It reinforces Booking.com’s role as a key enabler of digital transformation for small-to-mid-sized operators.
Sep 2025 – Accor: Accor announced the rollout of biometric-enabled check-in kiosks across 200 premium properties in the Middle East and Asia Pacific, supported by partnerships with regional identity verification providers. Pilot properties in Dubai and Singapore reported a 48% reduction in check-in times. This positions Accor at the forefront of biometric adoption in high-traffic urban travel hubs.