Global Conversational AI & Virtual Agents Market Size & Forecast 2034
Global Conversational AI and Virtual Agents Market Size, Share, and In-Depth Analysis By Component (Solutions, Services, Professional Services, Managed Services), By Deployment (Cloud, On-Premises), By Technology (NLP, Machine Learning, ASR, Text-to-Speech), By End User (BFSI, Healthcare, IT & Telecom, Retail & eCommerce, Education) Industry Outlook, Regional Analysis, Key Players, Market Dynamics, Competitive Strategies, Trends & Forecast 2025–2034
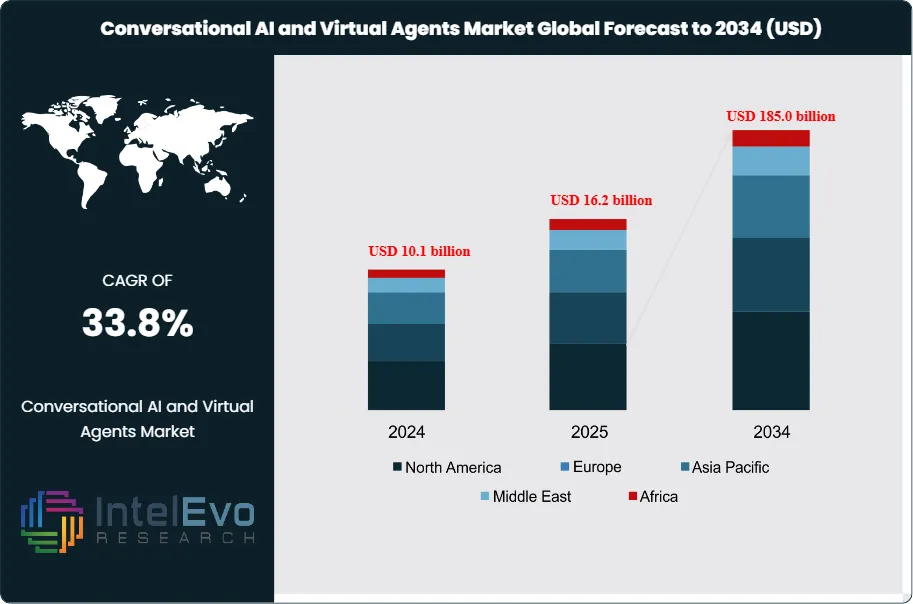
The Conversational AI and Virtual Agents Market is estimated to reach approximately USD 16.2 billion in 2025 and is projected to expand significantly to around USD 185.0 billion by 2034. Based on an estimated USD 18.0 billion market size in 2026, the market is expected to register a robust CAGR of about 33.8% during the forecast period from 2026 to 2034. This rapid expansion is driven by accelerating enterprise adoption of AI-powered customer engagement solutions, rising deployment of virtual agents across contact centers, banking, healthcare, and e-commerce, and continuous advances in natural language processing and generative AI. Growing demand for scalable, always-on customer support and cost-efficient automation further positions conversational AI as a core component of enterprise digital transformation strategies, supporting strong market momentum across global platforms.
This trajectory reflects rapid adoption of AI-driven dialogue systems across customer-facing and internal workflows. Enterprises deploy text and voice interfaces to automate high-volume interactions, shorten response times, and standardize service quality across channels and regions.
The market centers on platforms and solutions that simulate human dialogue, interpret intent, and execute tasks through natural language. Advances in large language models, speech recognition, and multimodal interfaces raise automation rates and reduce the need for human intervention in routine queries. On the demand side, sectors such as banking, telecommunications, retail, healthcare, and travel seek to manage rising interaction volumes without proportional increases in headcount. On the supply side, global cloud providers, independent software vendors, and specialized startups scale subscription and usage-based offerings, pushing down unit costs and expanding addressable demand.
Customer experience and operational efficiency remain primary growth drivers. Enterprises use virtual agents to provide 24/7 support, personalize journeys, and reduce call-center load, which translates into measurable cost savings and higher satisfaction scores. Cloud-native architectures and API-driven integration accelerate deployment across web, mobile, contact centers, and internal service desks. At the same time, technology complexity and integration with legacy systems create execution risk, while model accuracy, latency, and language coverage differentiate leading vendors from followers.
Regulation and enterprise risk governance shape adoption patterns. Data protection rules, sector-specific compliance requirements, and emerging AI governance frameworks influence how organizations design, deploy, and monitor conversational systems. Concerns around data security, hallucinations, and algorithmic bias drive investment in model oversight, encryption, and audit trails. Vendors that embed transparent controls, regional data hosting, and responsible AI capabilities gain advantage in regulated verticals such as financial services and healthcare.
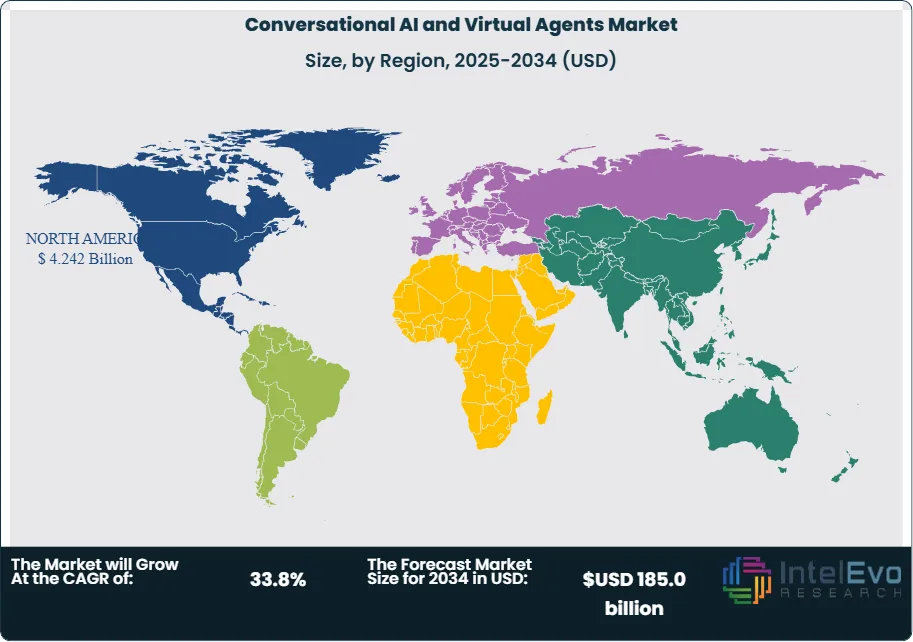
Regionally, North America leads adoption, accounting for 42.7% of global revenue in 2024 and generating about USD 5.8 Billion, with the U.S. projected to reach USD 4.67 Billion and grow at a 26.7% CAGR. Europe accelerates under strong focus on compliance and customer service transformation. Asia-Pacific emerges as a high-growth investment hotspot, supported by expanding digital economies, mobile-first engagement, and large multilingual populations. Across regions, rising labor costs, talent shortages in service roles, and rapid digitalization position conversational AI and virtual agents as a strategic pillar of enterprise transformation agendas.
Key Takeaways
Market Growth: The global Conversational AI & Virtual Agents market generates 16.2 billion in 2025 and is projected to reach USD 185.0 billion by 2034, reflecting a 33.8% CAGR over 2026-2034.
Segment Dominance: The Solutions segment dominates with 80.3% revenue share, 2024, indicating strong preference for packaged platforms over services. This segment is set to maintain leadership with estimated: 78.0% share, 2034 as enterprises standardize on scalable AI stacks.
Segment Dominance: On-premises deployments hold 64.7% of the market, 2024, underscoring demand for tighter control over data and integration. Within the technology stack, NLP capabilities contribute 35.8% share, 2024 as core engines for virtual agent performance.
Driver: Automation of BFSI interactions, which account for over 27.9% of total spending, 2024, acts as a major adoption driver for conversational AI. Institutions target efficiency gains of estimated: 15.0% reduction in service costs, 2024 by shifting routine queries to virtual agents.
Restraint: High upfront integration and compliance costs constrain adoption, with estimated: 20.0% of large enterprises, 2024 delaying full-scale rollouts. Data privacy and security concerns add friction, particularly in regulated sectors representing estimated: 35.0% of addressable demand, 2024.
Opportunity: Vendors see substantial upside in cloud-native and SME-focused offerings, expected to represent estimated: 40.0% of new deployments, 2034. Cross-channel integration into contact centers, apps, and messaging platforms can unlock incremental revenue of estimated: 25.0 billion USD, 2034.
Trend: A clear trend emerges toward hybrid and cloud deployment, with the on-premises share projected to fall from 64.7% in 2024 to estimated: 45.0% share, 2034. At the same time, enterprises shift from FAQ bots to task-oriented virtual agents that drive estimated: 60.0% of transaction volumes, 2034.
Regional Analysis: North America leads with 42.7% share and 5.8 billion USD revenue, 2024, while the U.S. market reaches 4.67 billion USD, 2024 and is forecast to grow at 26.7% CAGR over 2024-2034. Asia-Pacific and Europe emerge as fast followers, together targeted to reach estimated: 55.0% combined share, 2034 as digital customer engagement accelerates.
By Type
The market continues to show strong preference for solution-based platforms in 2025. Software-led offerings accounted for more than 80 percent of total spending in 2024 and remain the primary choice for enterprises that need fast deployment and consistent performance. Organizations adopt prebuilt conversational AI platforms because they connect easily to existing IT systems and provide measurable improvements in service response times and workflow efficiency. This pattern remains consistent across retail, telecom, banking, and healthcare, where firms seek predictable outputs and lower integration risk.
Growth in this segment also reflects the maturity of natural language processing and machine learning tools. Vendors now provide refined conversational models that support multilingual communication and improved intent recognition. As you expand customer engagement programs in 2025, these solutions give you the ability to run automated support, inbound service, and sales assistance without heavy custom development. Their role grows as enterprises look for reliable automation that reduces operational spending and supports continuous availability.
Virtual agents play a growing part in 24-hour customer support structures. Companies in sectors with high inquiry volumes continue to rely on software-led deployments because they maintain steady performance and reduce staff dependence during peak periods. As conversational systems integrate more advanced speech and text capabilities, demand for packaged solutions is expected to increase through 2030.
By Application
Pavers, retaining walls, and similar application areas adopt conversational AI to improve planning, procurement, and maintenance workflows. Firms in construction and materials distribution use AI-driven systems to guide customers through selection, scheduling, and order tracking. This segment gains further traction as suppliers shift toward digital platforms in 2025, where automated agents handle routine requests for specifications, pricing, and installation support.
Pavers remain the largest application segment due to the frequent customer need for detailed guidance and the high volume of inquiries related to residential and commercial projects. Retaining wall applications grow steadily as builders use conversational tools to reduce delays in documentation, scheduling, and contractor coordination. Other applications expand as companies adopt virtual assistants for equipment rentals, product catalog navigation, and post-installation support.
Across all applications, virtual agents lower processing time and reduce pressure on service teams. Firms that deploy these tools report shorter service cycles and fewer manual errors, which strengthens adoption across expanding markets.
By End-Use
Residential building applications show accelerated adoption as homeowners seek faster responses for installation, repairs, and service scheduling. Virtual agents support real-time assistance and guide users through product selection and vendor coordination. Commercial buildings adopt these systems at a similar pace to manage maintenance requests, customer interactions, and building service operations. Enterprises with multi-location facilities find these tools valuable for consistent communication and centralized control.
Industrial buildings adopt conversational systems to address higher complexity in equipment management and safety protocols. Automated agents assist with support tickets, compliance queries, and inventory checks, reducing manual effort for on-site teams. As you implement AI programs within industrial settings, these tools provide structured workflows and consistent reliability.
The shift toward automated communication across these three segments strengthens overall market demand. As digital transformation gains pace in 2025, virtual agents become a primary interface for daily service interactions across residential, commercial, and industrial environments.
By Region
North America held more than 42 percent of global spending in 2024 and continues to set the pace for adoption in 2025. Strong investment from the banking, telecom, and retail sectors supports this lead. Enterprises in the United States and Canada maintain aggressive deployment pipelines driven by the need for customer-centric engagement and high service capacity. Robust AI research programs and strong vendor presence reinforce this regional advantage.
Europe follows with steady expansion as regulators encourage responsible AI deployment and companies integrate virtual agents into customer-facing operations. Sectors such as financial services, utilities, and government adopt these tools to improve response accuracy and reduce operational strain. Asia Pacific shows the highest growth rate due to broad digital adoption, multilingual environments, and rapid investment in AI-based communication systems. Countries such as China, India, and Japan prioritize automation within retail, banking, and public services.
Latin America and the Middle East & Africa progress steadily as infrastructure strengthens and enterprises shift toward digital service models. Rising mobile usage and expanding online service channels drive adoption across various industries. These regions are expected to gain additional momentum through 2030 as virtual agents become essential for cost-effective customer engagement.
By Component(Solutions, Services), By Deployment (On-Premises, Cloud), By Technology (Natural Language Processing (NLP), ML and Deep Learning, Automatic Speech Recognition (ASR), Text to Speech, Text-based), By End User (BFSI, Healthcare, IT and Telecom, Retail and eCommerce, Education, Media and Entertainment, Automotive, Others (Government, Hospitality, Manufacturing, etc.))
Research Methodology
Primary Research- 100 Interviews of Stakeholders
Secondary Research
Desk Research
Regional scope
North America (United States, Canada, Mexico)
Latin America (Brazil, Argentina, Columbia)
East Asia And Pacific (China, Japan, South Korea, Australia, Cambodia, Fiji, Indonesia)
Sea And South Asia (India, Singapore, Thailand, Taiwan, Malaysia)
Eastern Europe (Poland, Russia, Czech Republic, Romania)
Western Europe (Germany, U.K., France, Spain, Itlay)
Middle East & Africa (GCC Countries, Egypt, Nigeria, South Africa, Israel)
Competitive Landscape
Google, Oracle, Conversica, Inc., Amazon Web Services, Inc., Kasisto, Nuance Communications, Inc., Artificial Solutions, FIS, Solvvy, Cognigy, IBM, Pypestream Inc., Avaamo, SAP SE, Jio Haptik Technologies Limited, Rasa Technologies Inc., Microsoft, Salesforce, Others
Customization Scope
Customization for segments, region/country-level will be provided. Moreover, additional customization can be done based on the requirements.
Pricing and Purchase Options
Avail customized purchase options to meet your exact research needs. We have three licenses to opt for: Single User License, Multi-User License (Up to 5 Users), Corporate Use License (Unlimited User and Printable PDF).
TABLE OF CONTENTS
1. EXECUTIVE SUMMARY
1.1. MARKET SNAPSHOT
1.2. KEY FINDINGS & INSIGHTS
1.3. ANALYST RECOMMENDATIONS
1.4. FUTURE OUTLOOK
2. RESEARCH METHODOLOGY
2.1. MARKET DEFINITION & SCOPE
2.2. RESEARCH OBJECTIVES: PRIMARY & SECONDARY DATA SOURCES
2.3. DATA COLLECTION SOURCES
2.3.1. COVERAGE OF 100+ PRIMARY RESEARCH/CONSULTATION CALLS WITH INDUSTRY STAKEHOLDERS
FIGURE 17 NORTH AMERICA CONVERSATIONAL AI AND VIRTUAL AGENTS CURRENT AND FUTURE TYPE ANALYSIS, 2025–2034, (USD MILLION)
FIGURE 18 NORTH AMERICA CONVERSATIONAL AI AND VIRTUAL AGENTS CURRENT AND FUTURE END USER ANALYSIS, 2025–2034, (USD MILLION)
FIGURE 19 MARKET SHARE BY COUNTRY
FIGURE 20 LATIN AMERICA CONVERSATIONAL AI AND VIRTUAL AGENTS CURRENT AND FUTURE TYPE ANALYSIS, 2025–2034, (USD MILLION)
FIGURE 21 LATIN AMERICA CONVERSATIONAL AI AND VIRTUAL AGENTS CURRENT AND FUTURE END USER ANALYSIS, 2025–2034, (USD MILLION)
FIGURE 22 MARKET SHARE BY COUNTRY
FIGURE 23 EASTERN EUROPE CONVERSATIONAL AI AND VIRTUAL AGENTS CURRENT AND FUTURE TYPE ANALYSIS, 2025–2034, (USD MILLION)
FIGURE 24 EASTERN EUROPE CONVERSATIONAL AI AND VIRTUAL AGENTS CURRENT AND FUTURE END USER ANALYSIS, 2025–2034, (USD MILLION)
FIGURE 25 MARKET SHARE BY COUNTRY
FIGURE 26 WESTERN EUROPE CONVERSATIONAL AI AND VIRTUAL AGENTS CURRENT AND FUTURE TYPE ANALYSIS, 2025–2034, (USD MILLION)
FIGURE 27 WESTERN EUROPE CONVERSATIONAL AI AND VIRTUAL AGENTS CURRENT AND FUTURE END USER ANALYSIS, 2025–2034, (USD MILLION)
FIGURE 28 MARKET SHARE BY COUNTRY
FIGURE 29 EAST ASIA AND PACIFIC CONVERSATIONAL AI AND VIRTUAL AGENTS CURRENT AND FUTURE TYPE ANALYSIS, 2025–2034, (USD MILLION)
FIGURE 30 EAST ASIA AND PACIFIC CONVERSATIONAL AI AND VIRTUAL AGENTS CURRENT AND FUTURE END USER ANALYSIS, 2025–2034, (USD MILLION)
FIGURE 31 MARKET SHARE BY COUNTRY
FIGURE 32 SEA AND SOUTH ASIA CONVERSATIONAL AI AND VIRTUAL AGENTS CURRENT AND FUTURE TYPE ANALYSIS, 2025–2034, (USD MILLION)
FIGURE 33 SEA AND SOUTH ASIA CONVERSATIONAL AI AND VIRTUAL AGENTS CURRENT AND FUTURE END USER ANALYSIS, 2025–2034, (USD MILLION)
FIGURE 34 MARKET SHARE BY COUNTRY
FIGURE 35 MIDDLE EAST AND AFRICA CONVERSATIONAL AI AND VIRTUAL AGENTS CURRENT AND FUTURE TYPE ANALYSIS, 2025–2034, (USD MILLION)
FIGURE 36 MIDDLE EAST AND AFRICA CONVERSATIONAL AI AND VIRTUAL AGENTS CURRENT AND FUTURE END USER ANALYSIS, 2025–2034, (USD MILLION)
FIGURE 37 NORTH AMERICA CONVERSATIONAL AI AND VIRTUAL AGENTS CURRENT AND FUTURE MARKET VOLUME SHARE REGIONAL ANALYSIS, 2025–2034, (USD MILLION)
FIGURE 38 U.S. CONVERSATIONAL AI AND VIRTUAL AGENTS CURRENT AND FUTURE TYPE ANALYSIS, 2025–2034, (USD MILLION)
FIGURE 39 U.S. CONVERSATIONAL AI AND VIRTUAL AGENTS CURRENT AND FUTURE END USER ANALYSIS, 2025–2034, (USD MILLION)
FIGURE 40 CANADA CONVERSATIONAL AI AND VIRTUAL AGENTS CURRENT AND FUTURE TYPE ANALYSIS, 2025–2034, (USD MILLION)
FIGURE 41 CANADA CONVERSATIONAL AI AND VIRTUAL AGENTS CURRENT AND FUTURE END USER ANALYSIS, 2025–2034, (USD MILLION)
FIGURE 42 LATIN AMERICA CONVERSATIONAL AI AND VIRTUAL AGENTS CURRENT AND FUTURE MARKET VOLUME SHARE REGIONAL ANALYSIS, 2025–2034, (USD MILLION)
FIGURE 43 MEXICO CONVERSATIONAL AI AND VIRTUAL AGENTS CURRENT AND FUTURE TYPE ANALYSIS, 2025–2034, (USD MILLION)
FIGURE 44 MEXICO CONVERSATIONAL AI AND VIRTUAL AGENTS CURRENT AND FUTURE END USER ANALYSIS, 2025–2034, (USD MILLION)
FIGURE 45 BRAZIL CONVERSATIONAL AI AND VIRTUAL AGENTS CURRENT AND FUTURE TYPE ANALYSIS, 2025–2034, (USD MILLION)
FIGURE 46 BRAZIL CONVERSATIONAL AI AND VIRTUAL AGENTS CURRENT AND FUTURE END USER ANALYSIS, 2025–2034, (USD MILLION)
FIGURE 47 ARGENTINA CONVERSATIONAL AI AND VIRTUAL AGENTS CURRENT AND FUTURE TYPE ANALYSIS, 2025–2034, (USD MILLION)
FIGURE 48 ARGENTINA CONVERSATIONAL AI AND VIRTUAL AGENTS CURRENT AND FUTURE END USER ANALYSIS, 2025–2034, (USD MILLION)
FIGURE 49 COLUMBIA CONVERSATIONAL AI AND VIRTUAL AGENTS CURRENT AND FUTURE TYPE ANALYSIS, 2025–2034, (USD MILLION)
FIGURE 50 COLUMBIA CONVERSATIONAL AI AND VIRTUAL AGENTS CURRENT AND FUTURE END USER ANALYSIS, 2025–2034, (USD MILLION)
FIGURE 51 REST OF LATIN AMERICA CONVERSATIONAL AI AND VIRTUAL AGENTS CURRENT AND FUTURE TYPE ANALYSIS, 2025–2034, (USD MILLION)
FIGURE 52 REST OF LATIN AMERICA CONVERSATIONAL AI AND VIRTUAL AGENTS CURRENT AND FUTURE END USER ANALYSIS, 2025–2034, (USD MILLION)
FIGURE 53 EASTERN EUROPE CONVERSATIONAL AI AND VIRTUAL AGENTS CURRENT AND FUTURE MARKET VOLUME SHARE REGIONAL ANALYSIS, 2025–2034, (USD MILLION)
FIGURE 54 POLAND CONVERSATIONAL AI AND VIRTUAL AGENTS CURRENT AND FUTURE TYPE ANALYSIS, 2025–2034, (USD MILLION)
FIGURE 55 POLAND CONVERSATIONAL AI AND VIRTUAL AGENTS CURRENT AND FUTURE END USER ANALYSIS, 2025–2034, (USD MILLION)
FIGURE 56 RUSSIA CONVERSATIONAL AI AND VIRTUAL AGENTS CURRENT AND FUTURE TYPE ANALYSIS, 2025–2034, (USD MILLION)
FIGURE 57 RUSSIA CONVERSATIONAL AI AND VIRTUAL AGENTS CURRENT AND FUTURE END USER ANALYSIS, 2025–2034, (USD MILLION)
FIGURE 58 CZECH REPUBLIC CONVERSATIONAL AI AND VIRTUAL AGENTS CURRENT AND FUTURE TYPE ANALYSIS, 2025–2034, (USD MILLION)
FIGURE 59 CZECH REPUBLIC CONVERSATIONAL AI AND VIRTUAL AGENTS CURRENT AND FUTURE END USER ANALYSIS, 2025–2034, (USD MILLION)
FIGURE 60 ROMANIA CONVERSATIONAL AI AND VIRTUAL AGENTS CURRENT AND FUTURE TYPE ANALYSIS, 2025–2034, (USD MILLION)
FIGURE 61 ROMANIA CONVERSATIONAL AI AND VIRTUAL AGENTS CURRENT AND FUTURE END USER ANALYSIS, 2025–2034, (USD MILLION)
FIGURE 62 REST OF EASTERN EUROPE CONVERSATIONAL AI AND VIRTUAL AGENTS CURRENT AND FUTURE TYPE ANALYSIS, 2025–2034, (USD MILLION)
FIGURE 63 REST OF EASTERN EUROPE CONVERSATIONAL AI AND VIRTUAL AGENTS CURRENT AND FUTURE END USER ANALYSIS, 2025–2034, (USD MILLION)
FIGURE 64 WESTERN EUROPE CONVERSATIONAL AI AND VIRTUAL AGENTS CURRENT AND FUTURE MARKET VOLUME SHARE REGIONAL ANALYSIS, 2025–2034, (USD MILLION)
FIGURE 65 GERMANY CONVERSATIONAL AI AND VIRTUAL AGENTS CURRENT AND FUTURE TYPE ANALYSIS, 2025–2034, (USD MILLION)
FIGURE 66 GERMANY CONVERSATIONAL AI AND VIRTUAL AGENTS CURRENT AND FUTURE END USER ANALYSIS, 2025–2034, (USD MILLION)
FIGURE 67 FRANCE CONVERSATIONAL AI AND VIRTUAL AGENTS CURRENT AND FUTURE TYPE ANALYSIS, 2025–2034, (USD MILLION)
FIGURE 68 FRANCE CONVERSATIONAL AI AND VIRTUAL AGENTS CURRENT AND FUTURE END USER ANALYSIS, 2025–2034, (USD MILLION)
FIGURE 69 UK CONVERSATIONAL AI AND VIRTUAL AGENTS CURRENT AND FUTURE TYPE ANALYSIS, 2025–2034, (USD MILLION)
FIGURE 70 UK CONVERSATIONAL AI AND VIRTUAL AGENTS CURRENT AND FUTURE END USER ANALYSIS, 2025–2034, (USD MILLION)
FIGURE 71 SPAIN CONVERSATIONAL AI AND VIRTUAL AGENTS CURRENT AND FUTURE TYPE ANALYSIS, 2025–2034, (USD MILLION)
FIGURE 72 SPAIN CONVERSATIONAL AI AND VIRTUAL AGENTS CURRENT AND FUTURE END USER ANALYSIS, 2025–2034, (USD MILLION)
FIGURE 73 ITALY CONVERSATIONAL AI AND VIRTUAL AGENTS CURRENT AND FUTURE TYPE ANALYSIS, 2025–2034, (USD MILLION)
FIGURE 74 ITALY CONVERSATIONAL AI AND VIRTUAL AGENTS CURRENT AND FUTURE END USER ANALYSIS, 2025–2034, (USD MILLION)
FIGURE 75 REST OF WESTERN EUROPE CONVERSATIONAL AI AND VIRTUAL AGENTS CURRENT AND FUTURE TYPE ANALYSIS, 2025–2034, (USD MILLION)
FIGURE 76 REST OF WESTERN EUROPE CONVERSATIONAL AI AND VIRTUAL AGENTS CURRENT AND FUTURE END USER ANALYSIS, 2025–2034, (USD MILLION)
FIGURE 77 EAST ASIA AND PACIFIC CONVERSATIONAL AI AND VIRTUAL AGENTS CURRENT AND FUTURE MARKET VOLUME SHARE REGIONAL ANALYSIS, 2025–2034, (USD MILLION)
FIGURE 78 CHINA CONVERSATIONAL AI AND VIRTUAL AGENTS CURRENT AND FUTURE TYPE ANALYSIS, 2025–2034, (USD MILLION)
FIGURE 79 CHINA CONVERSATIONAL AI AND VIRTUAL AGENTS CURRENT AND FUTURE END USER ANALYSIS, 2025–2034, (USD MILLION)
FIGURE 80 JAPAN CONVERSATIONAL AI AND VIRTUAL AGENTS CURRENT AND FUTURE TYPE ANALYSIS, 2025–2034, (USD MILLION)
FIGURE 81 JAPAN CONVERSATIONAL AI AND VIRTUAL AGENTS CURRENT AND FUTURE END USER ANALYSIS, 2025–2034, (USD MILLION)
FIGURE 82 AUSTRALIA CONVERSATIONAL AI AND VIRTUAL AGENTS CURRENT AND FUTURE TYPE ANALYSIS, 2025–2034, (USD MILLION)
FIGURE 83 AUSTRALIA CONVERSATIONAL AI AND VIRTUAL AGENTS CURRENT AND FUTURE END USER ANALYSIS, 2025–2034, (USD MILLION)
FIGURE 84 CAMBODIA CONVERSATIONAL AI AND VIRTUAL AGENTS CURRENT AND FUTURE TYPE ANALYSIS, 2025–2034, (USD MILLION)
FIGURE 85 CAMBODIA CONVERSATIONAL AI AND VIRTUAL AGENTS CURRENT AND FUTURE END USER ANALYSIS, 2025–2034, (USD MILLION)
FIGURE 86 FIJI CONVERSATIONAL AI AND VIRTUAL AGENTS CURRENT AND FUTURE TYPE ANALYSIS, 2025–2034, (USD MILLION)
FIGURE 87 FIJI CONVERSATIONAL AI AND VIRTUAL AGENTS CURRENT AND FUTURE END USER ANALYSIS, 2025–2034, (USD MILLION)
FIGURE 88 INDONESIA CONVERSATIONAL AI AND VIRTUAL AGENTS CURRENT AND FUTURE TYPE ANALYSIS, 2025–2034, (USD MILLION)
FIGURE 89 INDONESIA CONVERSATIONAL AI AND VIRTUAL AGENTS CURRENT AND FUTURE END USER ANALYSIS, 2025–2034, (USD MILLION)
FIGURE 90 SOUTH KOREA CONVERSATIONAL AI AND VIRTUAL AGENTS CURRENT AND FUTURE TYPE ANALYSIS, 2025–2034, (USD MILLION)
FIGURE 91 SOUTH KOREA CONVERSATIONAL AI AND VIRTUAL AGENTS CURRENT AND FUTURE END USER ANALYSIS, 2025–2034, (USD MILLION)
FIGURE 92 REST OF EAST ASIA AND PACIFIC CONVERSATIONAL AI AND VIRTUAL AGENTS CURRENT AND FUTURE TYPE ANALYSIS, 2025–2034, (USD MILLION)
FIGURE 93 REST OF EAST ASIA AND PACIFIC CONVERSATIONAL AI AND VIRTUAL AGENTS CURRENT AND FUTURE END USER ANALYSIS, 2025–2034, (USD MILLION)
FIGURE 94 SEA AND SOUTH ASIA CONVERSATIONAL AI AND VIRTUAL AGENTS CURRENT AND FUTURE MARKET VOLUME SHARE REGIONAL ANALYSIS, 2025–2034, (USD MILLION)
FIGURE 95 BANGLADESH CONVERSATIONAL AI AND VIRTUAL AGENTS CURRENT AND FUTURE TYPE ANALYSIS, 2025–2034, (USD MILLION)
FIGURE 96 BANGLADESH CONVERSATIONAL AI AND VIRTUAL AGENTS CURRENT AND FUTURE END USER ANALYSIS, 2025–2034, (USD MILLION)
FIGURE 97 NEW ZEALAND CONVERSATIONAL AI AND VIRTUAL AGENTS CURRENT AND FUTURE TYPE ANALYSIS, 2025–2034, (USD MILLION)
FIGURE 98 NEW ZEALAND CONVERSATIONAL AI AND VIRTUAL AGENTS CURRENT AND FUTURE END USER ANALYSIS, 2025–2034, (USD MILLION)
FIGURE 99 INDIA CONVERSATIONAL AI AND VIRTUAL AGENTS CURRENT AND FUTURE TYPE ANALYSIS, 2025–2034, (USD MILLION)
FIGURE 100 INDIA CONVERSATIONAL AI AND VIRTUAL AGENTS CURRENT AND FUTURE END USER ANALYSIS, 2025–2034, (USD MILLION)
FIGURE 101 SINGAPORE CONVERSATIONAL AI AND VIRTUAL AGENTS CURRENT AND FUTURE TYPE ANALYSIS, 2025–2034, (USD MILLION)
FIGURE 102 SINGAPORE CONVERSATIONAL AI AND VIRTUAL AGENTS CURRENT AND FUTURE END USER ANALYSIS, 2025–2034, (USD MILLION)
FIGURE 103 THAILAND CONVERSATIONAL AI AND VIRTUAL AGENTS CURRENT AND FUTURE TYPE ANALYSIS, 2025–2034, (USD MILLION)
FIGURE 104 THAILAND CONVERSATIONAL AI AND VIRTUAL AGENTS CURRENT AND FUTURE END USER ANALYSIS, 2025–2034, (USD MILLION)
FIGURE 105 TAIWAN CONVERSATIONAL AI AND VIRTUAL AGENTS CURRENT AND FUTURE TYPE ANALYSIS, 2025–2034, (USD MILLION)
FIGURE 106 TAIWAN CONVERSATIONAL AI AND VIRTUAL AGENTS CURRENT AND FUTURE END USER ANALYSIS, 2025–2034, (USD MILLION)
FIGURE 107 MALAYSIA CONVERSATIONAL AI AND VIRTUAL AGENTS CURRENT AND FUTURE TYPE ANALYSIS, 2025–2034, (USD MILLION)
FIGURE 108 MALAYSIA CONVERSATIONAL AI AND VIRTUAL AGENTS CURRENT AND FUTURE END USER ANALYSIS, 2025–2034, (USD MILLION)
FIGURE 109 REST OF SEA AND SOUTH ASIA CONVERSATIONAL AI AND VIRTUAL AGENTS CURRENT AND FUTURE TYPE ANALYSIS, 2025–2034, (USD MILLION)
FIGURE 110 REST OF SEA AND SOUTH ASIA CONVERSATIONAL AI AND VIRTUAL AGENTS CURRENT AND FUTURE END USER ANALYSIS, 2025–2034, (USD MILLION)
FIGURE 111 MIDDLE EAST AND AFRICA CONVERSATIONAL AI AND VIRTUAL AGENTS CURRENT AND FUTURE MARKET VOLUME SHARE REGIONAL ANALYSIS, 2025–2034, (USD MILLION)
FIGURE 112 GCC COUNTRIES CONVERSATIONAL AI AND VIRTUAL AGENTS CURRENT AND FUTURE TYPE ANALYSIS, 2025–2034, (USD MILLION)
FIGURE 113 GCC COUNTRIES CONVERSATIONAL AI AND VIRTUAL AGENTS CURRENT AND FUTURE END USER ANALYSIS, 2025–2034, (USD MILLION)
FIGURE 114 SAUDI ARABIA CONVERSATIONAL AI AND VIRTUAL AGENTS CURRENT AND FUTURE TYPE ANALYSIS, 2025–2034, (USD MILLION)
FIGURE 115 SAUDI ARABIA CONVERSATIONAL AI AND VIRTUAL AGENTS CURRENT AND FUTURE END USER ANALYSIS, 2025–2034, (USD MILLION)
FIGURE 116 UAE CONVERSATIONAL AI AND VIRTUAL AGENTS CURRENT AND FUTURE TYPE ANALYSIS, 2025–2034, (USD MILLION)
FIGURE 117 UAE CONVERSATIONAL AI AND VIRTUAL AGENTS CURRENT AND FUTURE END USER ANALYSIS, 2025–2034, (USD MILLION)
FIGURE 118 BAHRAIN CONVERSATIONAL AI AND VIRTUAL AGENTS CURRENT AND FUTURE TYPE ANALYSIS, 2025–2034, (USD MILLION)
FIGURE 119 BAHRAIN CONVERSATIONAL AI AND VIRTUAL AGENTS CURRENT AND FUTURE END USER ANALYSIS, 2025–2034, (USD MILLION)
FIGURE 120 KUWAIT CONVERSATIONAL AI AND VIRTUAL AGENTS CURRENT AND FUTURE TYPE ANALYSIS, 2025–2034, (USD MILLION)
FIGURE 121 KUWAIT CONVERSATIONAL AI AND VIRTUAL AGENTS CURRENT AND FUTURE END USER ANALYSIS, 2025–2034, (USD MILLION)
FIGURE 122 OMAN CONVERSATIONAL AI AND VIRTUAL AGENTS CURRENT AND FUTURE TYPE ANALYSIS, 2025–2034, (USD MILLION)
FIGURE 123 OMAN CONVERSATIONAL AI AND VIRTUAL AGENTS CURRENT AND FUTURE END USER ANALYSIS, 2025–2034, (USD MILLION)
FIGURE 124 QATAR CONVERSATIONAL AI AND VIRTUAL AGENTS CURRENT AND FUTURE TYPE ANALYSIS, 2025–2034, (USD MILLION)
FIGURE 125 QATAR CONVERSATIONAL AI AND VIRTUAL AGENTS CURRENT AND FUTURE END USER ANALYSIS, 2025–2034, (USD MILLION)
FIGURE 126 EGYPT CONVERSATIONAL AI AND VIRTUAL AGENTS CURRENT AND FUTURE TYPE ANALYSIS, 2025–2034, (USD MILLION)
FIGURE 127 EGYPT CONVERSATIONAL AI AND VIRTUAL AGENTS CURRENT AND FUTURE END USER ANALYSIS, 2025–2034, (USD MILLION)
FIGURE 128 NIGERIA CONVERSATIONAL AI AND VIRTUAL AGENTS CURRENT AND FUTURE TYPE ANALYSIS, 2025–2034, (USD MILLION)
FIGURE 129 NIGERIA CONVERSATIONAL AI AND VIRTUAL AGENTS CURRENT AND FUTURE END USER ANALYSIS, 2025–2034, (USD MILLION)
FIGURE 130 SOUTH AFRICA CONVERSATIONAL AI AND VIRTUAL AGENTS CURRENT AND FUTURE TYPE ANALYSIS, 2025–2034, (USD MILLION)
FIGURE 131 SOUTH AFRICA CONVERSATIONAL AI AND VIRTUAL AGENTS CURRENT AND FUTURE END USER ANALYSIS, 2025–2034, (USD MILLION)
FIGURE 132 ISRAEL CONVERSATIONAL AI AND VIRTUAL AGENTS CURRENT AND FUTURE TYPE ANALYSIS, 2025–2034, (USD MILLION)
FIGURE 133 ISRAEL CONVERSATIONAL AI AND VIRTUAL AGENTS CURRENT AND FUTURE END USER ANALYSIS, 2025–2034, (USD MILLION)
FIGURE 134 REST OF MEA CONVERSATIONAL AI AND VIRTUAL AGENTS CURRENT AND FUTURE TYPE ANALYSIS, 2025–2034, (USD MILLION)
FIGURE 135 REST OF MEA CONVERSATIONAL AI AND VIRTUAL AGENTS CURRENT AND FUTURE END USER ANALYSIS, 2025–2034, (USD MILLION)
FIGURE 136 U. S. MARKET SHARE ANALYSIS BY TYPE (2024)
FIGURE 137 U. S. MARKET SHARE ANALYSIS BY END USER (2024)
FIGURE 138 CANADA MARKET SHARE ANALYSIS BY TYPE (2024)
FIGURE 139 CANADA MARKET SHARE ANALYSIS BY END USER (2024)
FIGURE 140 MEXICO MARKET SHARE ANALYSIS BY TYPE (2024)
FIGURE 141 MEXICO MARKET SHARE ANALYSIS BY END USER (2024)
FIGURE 142 CHINA MARKET SHARE ANALYSIS BY TYPE (2024)
FIGURE 143 CHINA MARKET SHARE ANALYSIS BY END USER (2024)
FIGURE 144 JAPAN MARKET SHARE ANALYSIS BY TYPE (2024)
FIGURE 145 JAPAN MARKET SHARE ANALYSIS BY END USER (2024)
FIGURE 146 INDIA MARKET SHARE ANALYSIS BY TYPE (2024)
FIGURE 147 INDIA MARKET SHARE ANALYSIS BY END USER (2024)
FIGURE 148 SOUTH KOREA MARKET SHARE ANALYSIS BY TYPE (2024)
FIGURE 149 SOUTH KOREA MARKET SHARE ANALYSIS BY END USER (2024)
FIGURE 150 SAUDI ARABIA MARKET SHARE ANALYSIS BY TYPE (2024)
FIGURE 151 SAUDI ARABIA MARKET SHARE ANALYSIS BY END USER (2024)
FIGURE 152 UAE MARKET SHARE ANALYSIS BY TYPE (2024)
FIGURE 153 UAE MARKET SHARE ANALYSIS BY END USER (2024)
FIGURE 154 EGYPT MARKET SHARE ANALYSIS BY TYPE (2024)
FIGURE 155 EGYPT MARKET SHARE ANALYSIS BY END USER (2024)
FIGURE 156 NIGERIA MARKET SHARE ANALYSIS BY TYPE (2024)
FIGURE 157 NIGERIA MARKET SHARE ANALYSIS BY END USER (2024)
FIGURE 158 SOUTH AFRICA MARKET SHARE ANALYSIS BY TYPE (2024)
FIGURE 159 SOUTH AFRICA MARKET SHARE ANALYSIS BY END USER (2024)
FIGURE 160 GERMANY MARKET SHARE ANALYSIS BY TYPE (2024)
FIGURE 161 GERMANY MARKET SHARE ANALYSIS BY END USER (2024)
FIGURE 162 FRANCE MARKET SHARE ANALYSIS BY TYPE (2024)
FIGURE 163 FRANCE MARKET SHARE ANALYSIS BY END USER (2024)
FIGURE 164 UK MARKET SHARE ANALYSIS BY TYPE (2024)
FIGURE 165 UK MARKET SHARE ANALYSIS BY END USER (2024)
FIGURE 166 SPAIN MARKET SHARE ANALYSIS BY TYPE (2024)
FIGURE 167 SPAIN MARKET SHARE ANALYSIS BY END USER (2024)
FIGURE 168 ITALY MARKET SHARE ANALYSIS BY TYPE (2024)
FIGURE 169 ITALY MARKET SHARE ANALYSIS BY END USER (2024)
FIGURE 170 BRAZIL MARKET SHARE ANALYSIS BY TYPE (2024)
FIGURE 171 BRAZIL MARKET SHARE ANALYSIS BY END USER (2024)
FIGURE 172 ARGENTINA MARKET SHARE ANALYSIS BY TYPE (2024)
FIGURE 173 ARGENTINA MARKET SHARE ANALYSIS BY END USER (2024)
FIGURE 174 COLUMBIA MARKET SHARE ANALYSIS BY TYPE (2024)
FIGURE 175 COLUMBIA MARKET SHARE ANALYSIS BY END USER (2024)
FIGURE 176 GLOBAL CONVERSATIONAL AI AND VIRTUAL AGENTS CURRENT AND FUTURE MARKET KEY COUNTRY LEVEL ANALYSIS, 2024–2034, (USD MILLION)
FIGURE 177 FINANCIAL OVERVIEW:
Key Players Analysis
Google: Google plays a major role in the conversational AI and virtual agents market through its natural language processing and generative AI features in Google Cloud. The company uses large language models, speech-to-text, and multilingual AI frameworks to support virtual agents in customer service, healthcare, retail, and enterprise productivity. Google’s strength comes from its scalable cloud infrastructure and its ongoing improvements in understanding context and analyzing sentiment. Its focus on combining conversational AI with analytics, search intelligence, and automation tools positions the company well among large enterprises looking for complete AI-driven engagement solutions. Strategic investments in responsible AI and data security further support use in regulated industries.
Microsoft: Microsoft is a major player in the market, driven by its Azure-based conversational AI ecosystem and strong enterprise relationships. Through Azure AI, Copilot, and integrated virtual agent platforms, Microsoft helps businesses deploy conversational solutions in customer support, internal operations, and productivity workflows. The company benefits from smooth integration with Microsoft Teams, Dynamics 365, and enterprise IT environments, making it easy for existing customers to adopt. Microsoft’s investments in generative AI, automation, and security compliance boost its competitive position, especially in the BFSI, healthcare, and government sectors. Its global cloud presence and focus on scalable, enterprise-grade AI solutions help maintain its market leadership.
IBM: IBM remains a key player in the conversational AI and virtual agents market with its Watson-based AI solutions, focusing on enterprise and regulated industries. IBM stands out by emphasizing explainable AI, governance, and data privacy, making its platforms appealing to industries like banking, healthcare, and insurance. The company’s conversational AI solutions are widely used for customer service automation, internal help desks, and process improvement. IBM’s hybrid cloud strategy allows organizations to deploy virtual agents in both on-premise and cloud settings, addressing data sovereignty issues. This strategy supports adoption among large enterprises with complicated compliance needs.
Amazon Web Services: Amazon Web Services (AWS) plays a big role in the market by providing scalable conversational AI services such as Amazon Lex, Connect, and AI-driven voice and chat solutions. AWS allows enterprises to build and deploy virtual agents that handle high-volume customer interactions with low latency and global reach. Its strength lies in flexibility, letting organizations customize conversational workflows while integrating AI with contact center operations and analytics. AWS enjoys strong adoption among e-commerce, retail, travel, and digital-native businesses. Ongoing improvements in speech recognition, intent detection, and automation position AWS as a top choice for large-scale conversational deployments.
Salesforce: Salesforce is a notable participant in the conversational AI market, driven by its Einstein AI and Service Cloud virtual agent features. The company aims to improve customer relationship management through AI-driven chatbots and automated engagement tools closely linked with CRM workflows. Salesforce’s conversational AI solutions enable personalized, data-driven customer interactions across sales, marketing, and support areas. Its robust ecosystem of partners and third-party integrations speeds up adoption in industries like retail, BFSI, and telecommunications. By embedding AI directly into customer data platforms, Salesforce strengthens its appeal for enterprises looking for unified, insightful conversational experiences.
MarketKey Players
Google
Oracle
Conversica, Inc.
Amazon Web Services, Inc.
Kasisto
Nuance Communications, Inc.
Artificial Solutions
FIS
Solvvy
Cognigy
IBM
Pypestream Inc.
Avaamo
SAP SE
Jio Haptik Technologies Limited
Rasa Technologies Inc.
Microsoft
Salesforce
Others
Driver:
Rising Automation to Manage Service Volume Growth
By 2025, businesses will accelerate automation efforts as customer service volumes grow and labor costs rise across different regions. Conversational AI and virtual agents are key to this change. They can manage millions of interactions at once without needing proportional growth in staff. This effect is especially noticeable in banking, telecom, and e-commerce, where annual customer inquiry volumes are increasing by over 20 percent. This puts pressure on conventional support models.
Cost Reduction and Consistent Customer Engagement
Virtual agents are taking on more real-time support, onboarding, and transactional queries with greater accuracy as machine learning and AI training continue to improve. Automated engagement offers clear benefits by cutting service costs by 30 to 40 percent while keeping response quality steady across digital platforms. This focus on efficiency boosts the long-term market prospects and encourages ongoing use among businesses.
Restraint:
Data Privacy and Regulatory Compliance Challenges
Data protection poses a significant hurdle to widespread use. Conversational AI platforms deal with sensitive financial, healthcare, and personal identity information, increasing compliance risks for global companies operating in various jurisdictions. Businesses must follow strict regulations, including GDPR and CCPA, along with new AI governance standards, which makes deployment more complex.
Security Costs and Deployment Delays
The expense and time needed to set up secure AI systems can hinder market growth. Over one-third of enterprise AI projects face delays because of long privacy assessments or the need for internal security approvals. Ongoing worries about data breaches, improper use of AI-generated responses, and potential regulatory penalties continue to restrict adoption in heavily regulated sectors where trust and compliance are crucial.
Opportunity:
Expansion of Automated Customer Service
The fast move toward automated customer service offers a significant growth chance through 2030. As contact centers shift away from voice-dependent operations, virtual agents are now managing over 60 percent of standard customer queries. This shift creates a global revenue opportunity projected to exceed USD 40 billion by the decade's end.
Productivity Gains Across High-Volume Industries
Businesses benefit directly by lowering average handling times, enhancing service consistency across channels, and assigning human agents to more complex, high-value interactions. Retail, financial services, travel, and utilities are well-positioned to reap considerable returns as they implement conversational AI across vital service and support roles.
Trend:
Shift Toward Unified Multi-Channel Experiences
A major trend in 2025 will be the growth of multi-channel conversational ecosystems. Companies increasingly seek virtual agents that can function smoothly across websites, mobile apps, messaging platforms, and voice interfaces. This integration helps reduce fragmentation and allows for centralized management of customer interactions.
Growth of Internal Enterprise Automation
In addition to customer-related applications, internal automation is also gaining ground. HR, IT, and procurement teams are now using virtual agents to handle common employee questions, automate ticketing, and streamline processes. Improvements in natural language processing and contextual AI further boost intent recognition and sentiment analysis, broadening the market beyond traditional customer service roles.
Recent Developments
Dec 2024 – Google (Alphabet Inc.): Google DeepMind introduced Gemini 2.0 and the 2.0 Flash model, positioning them as core engines for agentic AI experiences across Google products, including Gemini, Search and experimental projects like Astra and Mariner. The rollout gives developers access to real-time multimodal APIs and tool use, and extends conversational agents to an installed base of products serving more than 2 billion users across seven Google services, strengthening Google’s role as a foundational platform for virtual agents in both consumer and enterprise contexts.
Feb 2025 – Amazon: Amazon unveiled Alexa+, an AI-enhanced version of its voice assistant built on its Nova model and integrated with third-party models through Amazon Bedrock, with access included in Prime and a standalone price of around USD 19.99 per month for other users. By combining contextual memory, autonomous online task execution and control over an estimated base of 500 million Alexa-capable devices, the upgrade seeks to regain share in the global virtual assistant market and deepen customer lock-in across commerce and smart-home ecosystems.
Apr 2025 – Capgemini and Google Cloud: Capgemini expanded its strategic partnership with Google Cloud to launch industry-specific agentic AI solutions for customer experience, using Google Agentspace and Customer Engagement Suite as the core platform. The program targets priority verticals such as telecom, retail and financial services and builds on research showing that about 90 percent of enterprises using generative and agentic AI expect improvements in first-contact resolution, positioning both firms to capture service-transformation projects with multi-year contract value in the hundreds of millions of dollars.
Jul 2025 – OpenAI: OpenAI launched the ChatGPT agent, an autonomous capability that can execute multi-step tasks such as shopping, form-filling and file manipulation using a virtual computer, initially for Pro, Plus and Team subscribers. By merging earlier features like Operator and Deep Research into a single agent framework, OpenAI moves beyond pure dialogue into task completion, broadening its monetization base in enterprise workflows and intensifying competition with agentic offerings from Google, Microsoft and other hyperscalers.
Sep 2025 – Genesys: Genesys announced new AI agents, including enhanced Copilots and Virtual Agents on the Genesys Cloud CX platform, with native Agent2Agent collaboration and Model Context Protocol support to coordinate actions across enterprise systems. Serving more than 8,000 organizations worldwide, the company positions these capabilities to drive autonomous yet governed customer engagement, improve contact-center efficiency and increase customer retention, reinforcing Genesys as a key enterprise provider of conversational AI and virtual-agent infrastructure.