The Cross-Border E-commerce Market size is projected to reach approximately USD 7,102.8 Billion by 2034, up from USD 1,254.6 Billion in 2024, growing at a CAGR of 18.7% during the forecast period from 2025 to 2034. This tremendous growth is driven by the rapid adoption of digital payment systems, international logistics advancements, and the increasing participation of SMEs and D2C brands in global online trade. Consumers worldwide are demanding diverse, high-quality, and affordable products, fueling transactions across regions. With AI-powered personalization, blockchain-based supply chain tracking, and rising demand from emerging economies, cross-border e-commerce is transforming global retail — empowering brands to reach borderless markets and redefine international commerce.
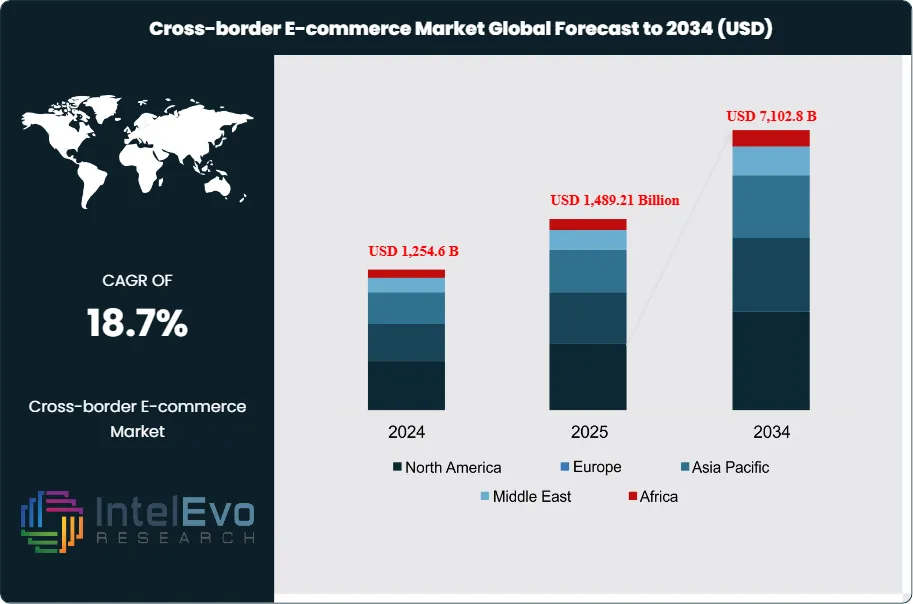
The cross-border e-commerce market involves the online trade of goods and services across international borders through various digital platforms. This market encompasses a broad array of product categories including electronics and media, fashion and apparel, personal care and beauty, food and beverages, and automotive parts, offering consumers access to global brands beyond domestic boundaries. Factors propelling the market growth include increasing internet penetration, the widespread adoption of smartphones, growing consumer demand for international products, and the expanding capabilities of logistics providers enabling faster and more reliable cross-border deliveries. Additionally, supportive policies and advances in secure cross-border payment solutions are facilitating seamless transactions and building customer trust.
Furthermore, the market has been significantly influenced by dynamic platform types, primarily B2C, B2B, and C2C models. B2C platforms such as Alibaba, Amazon, and JD.com dominate due to their vast product assortments, strong brand equity, and efficient fulfillment capabilities. Credit and debit card payments, along with digital wallets, have emerged as preferred payment methods, while robust logistics partnerships and advanced warehousing support have addressed cross-border delivery challenges. However, currency fluctuations, complex tax regulations, and customs clearance complexities still pose operational constraints for retailers venturing into global markets.
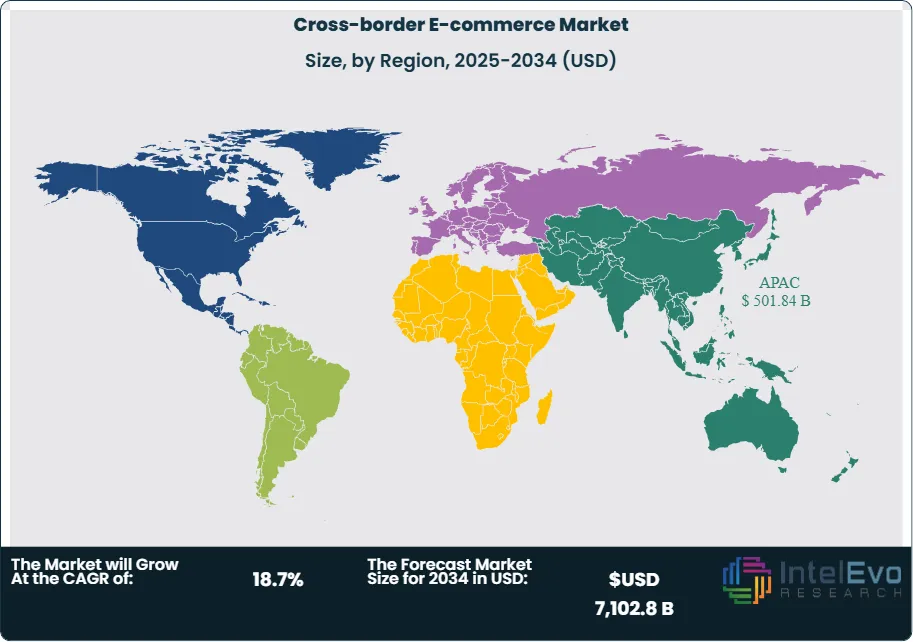
Regionally, Asia Pacific leads the cross-border e-commerce landscape, driven by a tech-savvy population, substantial growth in disposable incomes, and widespread digital infrastructure in China, Japan, South Korea, and Southeast Asia. North America and Europe also represent lucrative regions, backed by mature logistics frameworks and high demand for foreign products. Latin America and the Middle East & Africa are emerging markets that offer strong growth potential in the coming years due to their rapidly evolving e-commerce ecosystems and rising cross-border purchasing trends.
The COVID-19 pandemic had a mixed impact on the market. On the one hand, it disrupted supply chains, leading to delays and inventory shortages. On the other hand, it accelerated digital adoption as lockdowns encouraged more consumers to shop internationally online. This shift has created lasting changes in shopping behavior, with cross-border e-commerce becoming an essential component of global retail strategies.
Key Takeaways:
Market Growth: The Cross-border E-commerce Market is expected to reach USD 7,102.8 Billion by 2034, fueled by technological advancements, evolving consumer preferences, and the globalization of retail operations.
Product Category Dominance: Electronics and media have emerged as the dominant product category, driven by strong consumer demand for gadgets, entertainment products, and cross-border access to exclusive releases.
Platform Type Dominance: B2C platforms lead due to their sophisticated logistics networks, trust-building measures, and efficient payment gateways, which collectively enhance the cross-border shopping experience.
Payment Method Dominance: Credit and debit cards remain the most preferred payment method, benefiting from widespread global acceptance and perceived transaction security.
Driver: Digital transformation, including mobile commerce and secure payment infrastructure, is a key driver fostering sustained cross-border transactions.
Restraint: Regulatory challenges and customs complexities remain significant barriers, increasing operational costs and delivery timelines for merchants.
Opportunity: Emerging economies and the growing demand for niche international products present immense opportunities for retailers to capture untapped markets.
Trend: Personalization of shopping experiences and integration of AI-powered recommendation engines are transforming cross-border retail engagement.
Regional Analysis: Asia Pacific dominates, propelled by China’s large cross-border shopper base and supportive policies, while Europe and North America continue to mature, and Latin America shows strong momentum.
Product Category Analysis:
Electronics & Media Leads With more than 30% Market Share In Cross-border E-commerce Market, Electronics and media constitute the largest share of cross-border e-commerce transactions. Consumers across regions increasingly purchase smartphones, laptops, tablets, cameras, and entertainment content from international sellers to gain access to the latest technology at competitive prices. High product margins, frequent product launches, and strong marketing campaigns have also fueled this segment. Brands leverage exclusive cross-border deals and partnerships with logistics companies to ensure timely delivery and after-sales service, further cementing consumer trust. As digital lifestyles evolve, this segment will remain central to the market’s expansion.
Platform Type Analysis:
B2C models dominate the market as platforms like Amazon, Alibaba, and JD.com have established global footprints, offering unparalleled product variety, transparent pricing, and robust customer support. These platforms invest heavily in cross-border logistics, warehousing, and localized marketing to address language, currency, and regulatory barriers. Their advanced ecosystems integrate payment gateways, fraud prevention, and real-time tracking, all of which significantly improve the shopping experience and reduce cart abandonment. Consequently, B2C channels will continue driving cross-border e-commerce growth.
Payment Method Analysis:
Credit and debit cards are the preferred payment method for cross-border e-commerce transactions, accounting for a substantial portion of sales value. Consumers trust these instruments for their fraud protection mechanisms and ease of currency conversion. Card providers have also introduced solutions tailored for international purchases, such as multi-currency wallets, installment options, and cashback rewards. This widespread adoption, combined with regulatory frameworks ensuring secure processing, will sustain cards’ dominance, although digital wallets are gaining ground rapidly among younger demographics.
Region Analysis:
Asia Pacific Leads With over 40% Market Share In Cross-border E-commerce Market, The Asia Pacific region leads the global cross-border e-commerce market, driven by its position as the world's manufacturing hub, advanced digital infrastructure, and rapidly growing middle-class population with increasing disposable income. China dominates this regional leadership through its massive e-commerce ecosystem, supported by platforms like Alibaba, JD.com, and Tmall, which have created comprehensive cross-border commerce solutions. The region benefits from government initiatives promoting digital trade, favorable regulatory frameworks, and investments in logistics infrastructure that facilitate international commerce. Additionally, the high smartphone adoption rates and mobile-first commerce strategies in countries like South Korea, Japan, and Southeast Asian nations have accelerated cross-border e-commerce adoption.
North America and Europe represent mature markets with established e-commerce ecosystems, high consumer purchasing power, and advanced payment infrastructures. These regions show steady growth with consumers increasingly seeking international products for variety and competitive pricing. Latin America and Africa present significant growth opportunities, with improving internet connectivity, rising smartphone adoption, and growing consumer confidence in online transactions driving market expansion. The electronics and media segment is expected to maintain its growth trajectory across all regions, while fashion and personal care segments show promising potential in emerging markets as consumer preferences evolve and international brand awareness increases.
By Category, Fashion & Apparel, Electronics & Consumer Goods, Beauty & Personal Care, Food & Beverages, Home & Living, Automotive Parts & Accessories, Others, By Platform Type, B2C (Business to Consumer), B2B (Business to Business), C2C (Consumer to Consumer), By Payment Method, Digital Wallets, Credit/Debit Cards, Bank Transfers, Cash on Delivery (COD), Others, By End-User, Individual Consumers, Small & Medium Enterprises (SMEs), Large Enterprises
Research Methodology
Primary Research- 100 Interviews of Stakeholders
Secondary Research
Desk Research
Regional scope
North America (United States, Canada, Mexico)
Latin America (Brazil, Argentina, Columbia)
East Asia And Pacific (China, Japan, South Korea, Australia, Cambodia, Fiji, Indonesia)
Sea And South Asia (India, Singapore, Thailand, Taiwan, Malaysia)
Eastern Europe (Poland, Russia, Czech Republic, Romania)
Western Europe (Germany, U.K., France, Spain, Itlay)
Middle East & Africa (GCC Countries, Egypt, Nigeria, South Africa, Israel)
Customization for segments, region/country-level will be provided. Moreover, additional customization can be done based on the requirements.
Pricing and Purchase Options
Avail customized purchase options to meet your exact research needs. We have three licenses to opt for: Single User License, Multi-User License (Up to 5 Users), Corporate Use License (Unlimited User and Printable PDF).
TABLE OF CONTENTS
1. EXECUTIVE SUMMARY
1.1. MARKET SNAPSHOT
1.2. KEY FINDINGS & INSIGHTS
1.3. ANALYST RECOMMENDATIONS
1.4. FUTURE OUTLOOK
2. RESEARCH METHODOLOGY
2.1. MARKET DEFINITION & SCOPE
2.2. RESEARCH OBJECTIVES: PRIMARY & SECONDARY DATA SOURCES
2.3. DATA COLLECTION SOURCES
2.3.1. COVERAGE OF 100+ PRIMARY RESEARCH/CONSULTATION CALLS WITH INDUSTRY STAKEHOLDERS
FIGURE 17 NORTH AMERICA CROSS-BORDER E-COMMERCE CURRENT AND FUTURE TYPE ANALYSIS, 2025–2034, (USD MILLION)
FIGURE 18 NORTH AMERICA CROSS-BORDER E-COMMERCE CURRENT AND FUTURE END USER ANALYSIS, 2025–2034, (USD MILLION)
FIGURE 19 MARKET SHARE BY COUNTRY
FIGURE 20 LATIN AMERICA CROSS-BORDER E-COMMERCE CURRENT AND FUTURE TYPE ANALYSIS, 2025–2034, (USD MILLION)
FIGURE 21 LATIN AMERICA CROSS-BORDER E-COMMERCE CURRENT AND FUTURE END USER ANALYSIS, 2025–2034, (USD MILLION)
FIGURE 22 MARKET SHARE BY COUNTRY
FIGURE 23 EASTERN EUROPE CROSS-BORDER E-COMMERCE CURRENT AND FUTURE TYPE ANALYSIS, 2025–2034, (USD MILLION)
FIGURE 24 EASTERN EUROPE CROSS-BORDER E-COMMERCE CURRENT AND FUTURE END USER ANALYSIS, 2025–2034, (USD MILLION)
FIGURE 25 MARKET SHARE BY COUNTRY
FIGURE 26 WESTERN EUROPE CROSS-BORDER E-COMMERCE CURRENT AND FUTURE TYPE ANALYSIS, 2025–2034, (USD MILLION)
FIGURE 27 WESTERN EUROPE CROSS-BORDER E-COMMERCE CURRENT AND FUTURE END USER ANALYSIS, 2025–2034, (USD MILLION)
FIGURE 28 MARKET SHARE BY COUNTRY
FIGURE 29 EAST ASIA AND PACIFIC CROSS-BORDER E-COMMERCE CURRENT AND FUTURE TYPE ANALYSIS, 2025–2034, (USD MILLION)
FIGURE 30 EAST ASIA AND PACIFIC CROSS-BORDER E-COMMERCE CURRENT AND FUTURE END USER ANALYSIS, 2025–2034, (USD MILLION)
FIGURE 31 MARKET SHARE BY COUNTRY
FIGURE 32 SEA AND SOUTH ASIA CROSS-BORDER E-COMMERCE CURRENT AND FUTURE TYPE ANALYSIS, 2025–2034, (USD MILLION)
FIGURE 33 SEA AND SOUTH ASIA CROSS-BORDER E-COMMERCE CURRENT AND FUTURE END USER ANALYSIS, 2025–2034, (USD MILLION)
FIGURE 34 MARKET SHARE BY COUNTRY
FIGURE 35 MIDDLE EAST AND AFRICA CROSS-BORDER E-COMMERCE CURRENT AND FUTURE TYPE ANALYSIS, 2025–2034, (USD MILLION)
FIGURE 36 MIDDLE EAST AND AFRICA CROSS-BORDER E-COMMERCE CURRENT AND FUTURE END USER ANALYSIS, 2025–2034, (USD MILLION)
FIGURE 37 NORTH AMERICA CROSS-BORDER E-COMMERCE CURRENT AND FUTURE MARKET VOLUME SHARE REGIONAL ANALYSIS, 2025–2034, (USD MILLION)
FIGURE 38 U.S. CROSS-BORDER E-COMMERCE CURRENT AND FUTURE TYPE ANALYSIS, 2025–2034, (USD MILLION)
FIGURE 39 U.S. CROSS-BORDER E-COMMERCE CURRENT AND FUTURE END USER ANALYSIS, 2025–2034, (USD MILLION)
FIGURE 40 CANADA CROSS-BORDER E-COMMERCE CURRENT AND FUTURE TYPE ANALYSIS, 2025–2034, (USD MILLION)
FIGURE 41 CANADA CROSS-BORDER E-COMMERCE CURRENT AND FUTURE END USER ANALYSIS, 2025–2034, (USD MILLION)
FIGURE 42 LATIN AMERICA CROSS-BORDER E-COMMERCE CURRENT AND FUTURE MARKET VOLUME SHARE REGIONAL ANALYSIS, 2025–2034, (USD MILLION)
FIGURE 43 MEXICO CROSS-BORDER E-COMMERCE CURRENT AND FUTURE TYPE ANALYSIS, 2025–2034, (USD MILLION)
FIGURE 44 MEXICO CROSS-BORDER E-COMMERCE CURRENT AND FUTURE END USER ANALYSIS, 2025–2034, (USD MILLION)
FIGURE 45 BRAZIL CROSS-BORDER E-COMMERCE CURRENT AND FUTURE TYPE ANALYSIS, 2025–2034, (USD MILLION)
FIGURE 46 BRAZIL CROSS-BORDER E-COMMERCE CURRENT AND FUTURE END USER ANALYSIS, 2025–2034, (USD MILLION)
FIGURE 47 ARGENTINA CROSS-BORDER E-COMMERCE CURRENT AND FUTURE TYPE ANALYSIS, 2025–2034, (USD MILLION)
FIGURE 48 ARGENTINA CROSS-BORDER E-COMMERCE CURRENT AND FUTURE END USER ANALYSIS, 2025–2034, (USD MILLION)
FIGURE 49 COLUMBIA CROSS-BORDER E-COMMERCE CURRENT AND FUTURE TYPE ANALYSIS, 2025–2034, (USD MILLION)
FIGURE 50 COLUMBIA CROSS-BORDER E-COMMERCE CURRENT AND FUTURE END USER ANALYSIS, 2025–2034, (USD MILLION)
FIGURE 51 REST OF LATIN AMERICA CROSS-BORDER E-COMMERCE CURRENT AND FUTURE TYPE ANALYSIS, 2025–2034, (USD MILLION)
FIGURE 52 REST OF LATIN AMERICA CROSS-BORDER E-COMMERCE CURRENT AND FUTURE END USER ANALYSIS, 2025–2034, (USD MILLION)
FIGURE 53 EASTERN EUROPE CROSS-BORDER E-COMMERCE CURRENT AND FUTURE MARKET VOLUME SHARE REGIONAL ANALYSIS, 2025–2034, (USD MILLION)
FIGURE 54 POLAND CROSS-BORDER E-COMMERCE CURRENT AND FUTURE TYPE ANALYSIS, 2025–2034, (USD MILLION)
FIGURE 55 POLAND CROSS-BORDER E-COMMERCE CURRENT AND FUTURE END USER ANALYSIS, 2025–2034, (USD MILLION)
FIGURE 56 RUSSIA CROSS-BORDER E-COMMERCE CURRENT AND FUTURE TYPE ANALYSIS, 2025–2034, (USD MILLION)
FIGURE 57 RUSSIA CROSS-BORDER E-COMMERCE CURRENT AND FUTURE END USER ANALYSIS, 2025–2034, (USD MILLION)
FIGURE 58 CZECH REPUBLIC CROSS-BORDER E-COMMERCE CURRENT AND FUTURE TYPE ANALYSIS, 2025–2034, (USD MILLION)
FIGURE 59 CZECH REPUBLIC CROSS-BORDER E-COMMERCE CURRENT AND FUTURE END USER ANALYSIS, 2025–2034, (USD MILLION)
FIGURE 60 ROMANIA CROSS-BORDER E-COMMERCE CURRENT AND FUTURE TYPE ANALYSIS, 2025–2034, (USD MILLION)
FIGURE 61 ROMANIA CROSS-BORDER E-COMMERCE CURRENT AND FUTURE END USER ANALYSIS, 2025–2034, (USD MILLION)
FIGURE 62 REST OF EASTERN EUROPE CROSS-BORDER E-COMMERCE CURRENT AND FUTURE TYPE ANALYSIS, 2025–2034, (USD MILLION)
FIGURE 63 REST OF EASTERN EUROPE CROSS-BORDER E-COMMERCE CURRENT AND FUTURE END USER ANALYSIS, 2025–2034, (USD MILLION)
FIGURE 64 WESTERN EUROPE CROSS-BORDER E-COMMERCE CURRENT AND FUTURE MARKET VOLUME SHARE REGIONAL ANALYSIS, 2025–2034, (USD MILLION)
FIGURE 65 GERMANY CROSS-BORDER E-COMMERCE CURRENT AND FUTURE TYPE ANALYSIS, 2025–2034, (USD MILLION)
FIGURE 66 GERMANY CROSS-BORDER E-COMMERCE CURRENT AND FUTURE END USER ANALYSIS, 2025–2034, (USD MILLION)
FIGURE 67 FRANCE CROSS-BORDER E-COMMERCE CURRENT AND FUTURE TYPE ANALYSIS, 2025–2034, (USD MILLION)
FIGURE 68 FRANCE CROSS-BORDER E-COMMERCE CURRENT AND FUTURE END USER ANALYSIS, 2025–2034, (USD MILLION)
FIGURE 69 UK CROSS-BORDER E-COMMERCE CURRENT AND FUTURE TYPE ANALYSIS, 2025–2034, (USD MILLION)
FIGURE 70 UK CROSS-BORDER E-COMMERCE CURRENT AND FUTURE END USER ANALYSIS, 2025–2034, (USD MILLION)
FIGURE 71 SPAIN CROSS-BORDER E-COMMERCE CURRENT AND FUTURE TYPE ANALYSIS, 2025–2034, (USD MILLION)
FIGURE 72 SPAIN CROSS-BORDER E-COMMERCE CURRENT AND FUTURE END USER ANALYSIS, 2025–2034, (USD MILLION)
FIGURE 73 ITALY CROSS-BORDER E-COMMERCE CURRENT AND FUTURE TYPE ANALYSIS, 2025–2034, (USD MILLION)
FIGURE 74 ITALY CROSS-BORDER E-COMMERCE CURRENT AND FUTURE END USER ANALYSIS, 2025–2034, (USD MILLION)
FIGURE 75 REST OF WESTERN EUROPE CROSS-BORDER E-COMMERCE CURRENT AND FUTURE TYPE ANALYSIS, 2025–2034, (USD MILLION)
FIGURE 76 REST OF WESTERN EUROPE CROSS-BORDER E-COMMERCE CURRENT AND FUTURE END USER ANALYSIS, 2025–2034, (USD MILLION)
FIGURE 77 EAST ASIA AND PACIFIC CROSS-BORDER E-COMMERCE CURRENT AND FUTURE MARKET VOLUME SHARE REGIONAL ANALYSIS, 2025–2034, (USD MILLION)
FIGURE 78 CHINA CROSS-BORDER E-COMMERCE CURRENT AND FUTURE TYPE ANALYSIS, 2025–2034, (USD MILLION)
FIGURE 79 CHINA CROSS-BORDER E-COMMERCE CURRENT AND FUTURE END USER ANALYSIS, 2025–2034, (USD MILLION)
FIGURE 80 JAPAN CROSS-BORDER E-COMMERCE CURRENT AND FUTURE TYPE ANALYSIS, 2025–2034, (USD MILLION)
FIGURE 81 JAPAN CROSS-BORDER E-COMMERCE CURRENT AND FUTURE END USER ANALYSIS, 2025–2034, (USD MILLION)
FIGURE 82 AUSTRALIA CROSS-BORDER E-COMMERCE CURRENT AND FUTURE TYPE ANALYSIS, 2025–2034, (USD MILLION)
FIGURE 83 AUSTRALIA CROSS-BORDER E-COMMERCE CURRENT AND FUTURE END USER ANALYSIS, 2025–2034, (USD MILLION)
FIGURE 84 CAMBODIA CROSS-BORDER E-COMMERCE CURRENT AND FUTURE TYPE ANALYSIS, 2025–2034, (USD MILLION)
FIGURE 85 CAMBODIA CROSS-BORDER E-COMMERCE CURRENT AND FUTURE END USER ANALYSIS, 2025–2034, (USD MILLION)
FIGURE 86 FIJI CROSS-BORDER E-COMMERCE CURRENT AND FUTURE TYPE ANALYSIS, 2025–2034, (USD MILLION)
FIGURE 87 FIJI CROSS-BORDER E-COMMERCE CURRENT AND FUTURE END USER ANALYSIS, 2025–2034, (USD MILLION)
FIGURE 88 INDONESIA CROSS-BORDER E-COMMERCE CURRENT AND FUTURE TYPE ANALYSIS, 2025–2034, (USD MILLION)
FIGURE 89 INDONESIA CROSS-BORDER E-COMMERCE CURRENT AND FUTURE END USER ANALYSIS, 2025–2034, (USD MILLION)
FIGURE 90 SOUTH KOREA CROSS-BORDER E-COMMERCE CURRENT AND FUTURE TYPE ANALYSIS, 2025–2034, (USD MILLION)
FIGURE 91 SOUTH KOREA CROSS-BORDER E-COMMERCE CURRENT AND FUTURE END USER ANALYSIS, 2025–2034, (USD MILLION)
FIGURE 92 REST OF EAST ASIA AND PACIFIC CROSS-BORDER E-COMMERCE CURRENT AND FUTURE TYPE ANALYSIS, 2025–2034, (USD MILLION)
FIGURE 93 REST OF EAST ASIA AND PACIFIC CROSS-BORDER E-COMMERCE CURRENT AND FUTURE END USER ANALYSIS, 2025–2034, (USD MILLION)
FIGURE 94 SEA AND SOUTH ASIA CROSS-BORDER E-COMMERCE CURRENT AND FUTURE MARKET VOLUME SHARE REGIONAL ANALYSIS, 2025–2034, (USD MILLION)
FIGURE 95 BANGLADESH CROSS-BORDER E-COMMERCE CURRENT AND FUTURE TYPE ANALYSIS, 2025–2034, (USD MILLION)
FIGURE 96 BANGLADESH CROSS-BORDER E-COMMERCE CURRENT AND FUTURE END USER ANALYSIS, 2025–2034, (USD MILLION)
FIGURE 97 NEW ZEALAND CROSS-BORDER E-COMMERCE CURRENT AND FUTURE TYPE ANALYSIS, 2025–2034, (USD MILLION)
FIGURE 98 NEW ZEALAND CROSS-BORDER E-COMMERCE CURRENT AND FUTURE END USER ANALYSIS, 2025–2034, (USD MILLION)
FIGURE 99 INDIA CROSS-BORDER E-COMMERCE CURRENT AND FUTURE TYPE ANALYSIS, 2025–2034, (USD MILLION)
FIGURE 100 INDIA CROSS-BORDER E-COMMERCE CURRENT AND FUTURE END USER ANALYSIS, 2025–2034, (USD MILLION)
FIGURE 101 SINGAPORE CROSS-BORDER E-COMMERCE CURRENT AND FUTURE TYPE ANALYSIS, 2025–2034, (USD MILLION)
FIGURE 102 SINGAPORE CROSS-BORDER E-COMMERCE CURRENT AND FUTURE END USER ANALYSIS, 2025–2034, (USD MILLION)
FIGURE 103 THAILAND CROSS-BORDER E-COMMERCE CURRENT AND FUTURE TYPE ANALYSIS, 2025–2034, (USD MILLION)
FIGURE 104 THAILAND CROSS-BORDER E-COMMERCE CURRENT AND FUTURE END USER ANALYSIS, 2025–2034, (USD MILLION)
FIGURE 105 TAIWAN CROSS-BORDER E-COMMERCE CURRENT AND FUTURE TYPE ANALYSIS, 2025–2034, (USD MILLION)
FIGURE 106 TAIWAN CROSS-BORDER E-COMMERCE CURRENT AND FUTURE END USER ANALYSIS, 2025–2034, (USD MILLION)
FIGURE 107 MALAYSIA CROSS-BORDER E-COMMERCE CURRENT AND FUTURE TYPE ANALYSIS, 2025–2034, (USD MILLION)
FIGURE 108 MALAYSIA CROSS-BORDER E-COMMERCE CURRENT AND FUTURE END USER ANALYSIS, 2025–2034, (USD MILLION)
FIGURE 109 REST OF SEA AND SOUTH ASIA CROSS-BORDER E-COMMERCE CURRENT AND FUTURE TYPE ANALYSIS, 2025–2034, (USD MILLION)
FIGURE 110 REST OF SEA AND SOUTH ASIA CROSS-BORDER E-COMMERCE CURRENT AND FUTURE END USER ANALYSIS, 2025–2034, (USD MILLION)
FIGURE 111 MIDDLE EAST AND AFRICA CROSS-BORDER E-COMMERCE CURRENT AND FUTURE MARKET VOLUME SHARE REGIONAL ANALYSIS, 2025–2034, (USD MILLION)
FIGURE 112 GCC COUNTRIES CROSS-BORDER E-COMMERCE CURRENT AND FUTURE TYPE ANALYSIS, 2025–2034, (USD MILLION)
FIGURE 113 GCC COUNTRIES CROSS-BORDER E-COMMERCE CURRENT AND FUTURE END USER ANALYSIS, 2025–2034, (USD MILLION)
FIGURE 114 SAUDI ARABIA CROSS-BORDER E-COMMERCE CURRENT AND FUTURE TYPE ANALYSIS, 2025–2034, (USD MILLION)
FIGURE 115 SAUDI ARABIA CROSS-BORDER E-COMMERCE CURRENT AND FUTURE END USER ANALYSIS, 2025–2034, (USD MILLION)
FIGURE 116 UAE CROSS-BORDER E-COMMERCE CURRENT AND FUTURE TYPE ANALYSIS, 2025–2034, (USD MILLION)
FIGURE 117 UAE CROSS-BORDER E-COMMERCE CURRENT AND FUTURE END USER ANALYSIS, 2025–2034, (USD MILLION)
FIGURE 118 BAHRAIN CROSS-BORDER E-COMMERCE CURRENT AND FUTURE TYPE ANALYSIS, 2025–2034, (USD MILLION)
FIGURE 119 BAHRAIN CROSS-BORDER E-COMMERCE CURRENT AND FUTURE END USER ANALYSIS, 2025–2034, (USD MILLION)
FIGURE 120 KUWAIT CROSS-BORDER E-COMMERCE CURRENT AND FUTURE TYPE ANALYSIS, 2025–2034, (USD MILLION)
FIGURE 121 KUWAIT CROSS-BORDER E-COMMERCE CURRENT AND FUTURE END USER ANALYSIS, 2025–2034, (USD MILLION)
FIGURE 122 OMAN CROSS-BORDER E-COMMERCE CURRENT AND FUTURE TYPE ANALYSIS, 2025–2034, (USD MILLION)
FIGURE 123 OMAN CROSS-BORDER E-COMMERCE CURRENT AND FUTURE END USER ANALYSIS, 2025–2034, (USD MILLION)
FIGURE 124 QATAR CROSS-BORDER E-COMMERCE CURRENT AND FUTURE TYPE ANALYSIS, 2025–2034, (USD MILLION)
FIGURE 125 QATAR CROSS-BORDER E-COMMERCE CURRENT AND FUTURE END USER ANALYSIS, 2025–2034, (USD MILLION)
FIGURE 126 EGYPT CROSS-BORDER E-COMMERCE CURRENT AND FUTURE TYPE ANALYSIS, 2025–2034, (USD MILLION)
FIGURE 127 EGYPT CROSS-BORDER E-COMMERCE CURRENT AND FUTURE END USER ANALYSIS, 2025–2034, (USD MILLION)
FIGURE 128 NIGERIA CROSS-BORDER E-COMMERCE CURRENT AND FUTURE TYPE ANALYSIS, 2025–2034, (USD MILLION)
FIGURE 129 NIGERIA CROSS-BORDER E-COMMERCE CURRENT AND FUTURE END USER ANALYSIS, 2025–2034, (USD MILLION)
FIGURE 130 SOUTH AFRICA CROSS-BORDER E-COMMERCE CURRENT AND FUTURE TYPE ANALYSIS, 2025–2034, (USD MILLION)
FIGURE 131 SOUTH AFRICA CROSS-BORDER E-COMMERCE CURRENT AND FUTURE END USER ANALYSIS, 2025–2034, (USD MILLION)
FIGURE 132 ISRAEL CROSS-BORDER E-COMMERCE CURRENT AND FUTURE TYPE ANALYSIS, 2025–2034, (USD MILLION)
FIGURE 133 ISRAEL CROSS-BORDER E-COMMERCE CURRENT AND FUTURE END USER ANALYSIS, 2025–2034, (USD MILLION)
FIGURE 134 REST OF MEA CROSS-BORDER E-COMMERCE CURRENT AND FUTURE TYPE ANALYSIS, 2025–2034, (USD MILLION)
FIGURE 135 REST OF MEA CROSS-BORDER E-COMMERCE CURRENT AND FUTURE END USER ANALYSIS, 2025–2034, (USD MILLION)
FIGURE 136 U. S. MARKET SHARE ANALYSIS BY TYPE (2024)
FIGURE 137 U. S. MARKET SHARE ANALYSIS BY END USER (2024)
FIGURE 138 CANADA MARKET SHARE ANALYSIS BY TYPE (2024)
FIGURE 139 CANADA MARKET SHARE ANALYSIS BY END USER (2024)
FIGURE 140 MEXICO MARKET SHARE ANALYSIS BY TYPE (2024)
FIGURE 141 MEXICO MARKET SHARE ANALYSIS BY END USER (2024)
FIGURE 142 CHINA MARKET SHARE ANALYSIS BY TYPE (2024)
FIGURE 143 CHINA MARKET SHARE ANALYSIS BY END USER (2024)
FIGURE 144 JAPAN MARKET SHARE ANALYSIS BY TYPE (2024)
FIGURE 145 JAPAN MARKET SHARE ANALYSIS BY END USER (2024)
FIGURE 146 INDIA MARKET SHARE ANALYSIS BY TYPE (2024)
FIGURE 147 INDIA MARKET SHARE ANALYSIS BY END USER (2024)
FIGURE 148 SOUTH KOREA MARKET SHARE ANALYSIS BY TYPE (2024)
FIGURE 149 SOUTH KOREA MARKET SHARE ANALYSIS BY END USER (2024)
FIGURE 150 SAUDI ARABIA MARKET SHARE ANALYSIS BY TYPE (2024)
FIGURE 151 SAUDI ARABIA MARKET SHARE ANALYSIS BY END USER (2024)
FIGURE 152 UAE MARKET SHARE ANALYSIS BY TYPE (2024)
FIGURE 153 UAE MARKET SHARE ANALYSIS BY END USER (2024)
FIGURE 154 EGYPT MARKET SHARE ANALYSIS BY TYPE (2024)
FIGURE 155 EGYPT MARKET SHARE ANALYSIS BY END USER (2024)
FIGURE 156 NIGERIA MARKET SHARE ANALYSIS BY TYPE (2024)
FIGURE 157 NIGERIA MARKET SHARE ANALYSIS BY END USER (2024)
FIGURE 158 SOUTH AFRICA MARKET SHARE ANALYSIS BY TYPE (2024)
FIGURE 159 SOUTH AFRICA MARKET SHARE ANALYSIS BY END USER (2024)
FIGURE 160 GERMANY MARKET SHARE ANALYSIS BY TYPE (2024)
FIGURE 161 GERMANY MARKET SHARE ANALYSIS BY END USER (2024)
FIGURE 162 FRANCE MARKET SHARE ANALYSIS BY TYPE (2024)
FIGURE 163 FRANCE MARKET SHARE ANALYSIS BY END USER (2024)
FIGURE 164 UK MARKET SHARE ANALYSIS BY TYPE (2024)
FIGURE 165 UK MARKET SHARE ANALYSIS BY END USER (2024)
FIGURE 166 SPAIN MARKET SHARE ANALYSIS BY TYPE (2024)
FIGURE 167 SPAIN MARKET SHARE ANALYSIS BY END USER (2024)
FIGURE 168 ITALY MARKET SHARE ANALYSIS BY TYPE (2024)
FIGURE 169 ITALY MARKET SHARE ANALYSIS BY END USER (2024)
FIGURE 170 BRAZIL MARKET SHARE ANALYSIS BY TYPE (2024)
FIGURE 171 BRAZIL MARKET SHARE ANALYSIS BY END USER (2024)
FIGURE 172 ARGENTINA MARKET SHARE ANALYSIS BY TYPE (2024)
FIGURE 173 ARGENTINA MARKET SHARE ANALYSIS BY END USER (2024)
FIGURE 174 COLUMBIA MARKET SHARE ANALYSIS BY TYPE (2024)
FIGURE 175 COLUMBIA MARKET SHARE ANALYSIS BY END USER (2024)
FIGURE 176 GLOBAL CROSS-BORDER E-COMMERCE CURRENT AND FUTURE MARKET KEY COUNTRY LEVEL ANALYSIS, 2024–2034, (USD MILLION)
FIGURE 177 FINANCIAL OVERVIEW:
Key Players Analysis:
Amazon.com, Inc.: Amazon stands as the undisputed giant in the cross-border e-commerce market, leveraging its massive global infrastructure, advanced logistics network, and comprehensive technology platform to dominate international commerce. The company's success stems from its customer-centric approach, vast product selection, and reliable delivery systems that have set industry standards for cross-border e-commerce. Amazon's sophisticated fulfillment network, including Amazon Prime's expedited shipping services, has revolutionized consumer expectations for international deliveries. The platform's advanced recommendation algorithms, powered by machine learning and artificial intelligence, provide personalized shopping experiences that drive customer loyalty and repeat purchases. Additionally, Amazon's marketplace model allows millions of international sellers to reach global audiences, creating a comprehensive ecosystem that benefits both businesses and consumers. The company's continuous investment in technology innovation, including drone delivery systems, automated warehouses, and cloud computing services, maintains its competitive advantage in the rapidly evolving cross-border e-commerce landscape.
Alibaba Group Holding Limited: Alibaba represents the dominant force in Asia Pacific cross-border e-commerce, with its comprehensive ecosystem of platforms including Tmall, Taobao, and AliExpress serving different segments of the international market. The company's strength lies in its deep understanding of Chinese manufacturing capabilities and its ability to connect global consumers with Chinese suppliers through user-friendly platforms and integrated services. Alibaba's innovative approach to cross-border commerce includes the development of sophisticated logistics networks, digital payment systems through Alipay, and comprehensive seller support services that enable small and medium enterprises to participate in international trade. The company's annual Singles' Day shopping festival has become a global phenomenon, demonstrating the power of event-driven marketing in cross-border e-commerce. Alibaba's investment in emerging technologies, including artificial intelligence, blockchain, and cloud computing, positions it at the forefront of next-generation e-commerce solutions. The company's expansion into Southeast Asia through strategic partnerships and acquisitions has further strengthened its position in the growing Asian e-commerce market.
eBay Inc.: eBay has established itself as a pioneering force in cross-border e-commerce, with its auction-based model and marketplace platform enabling millions of international transactions across diverse product categories. The company's strength lies in its ability to facilitate transactions between individual sellers and buyers across different countries, creating a global marketplace for both new and used goods. eBay's comprehensive seller tools, including international shipping calculators, currency conversion systems, and global selling programs, have made cross-border commerce accessible to small businesses and individual entrepreneurs. The platform's robust buyer protection programs and dispute resolution mechanisms have built consumer confidence in international transactions, particularly for higher-value items. eBay's focus on collectibles, vintage items, and unique products has created a distinct market position that differentiates it from other major e-commerce platforms. The company's continuous innovation in mobile commerce, with features like image search and augmented reality integration, demonstrates its commitment to enhancing the cross-border shopping experience for tech-savvy consumers.
JD.com.: JD.com has emerged as a major player in cross-border e-commerce, particularly in the Asia Pacific region, through its focus on direct sales, quality assurance, and superior logistics capabilities. The company's strength lies in its self-operated retail model, which ensures product authenticity and quality control, addressing key concerns that consumers have about cross-border purchases. JD's investment in advanced logistics infrastructure, including automated warehouses, drone delivery systems, and same-day delivery services, has set new standards for cross-border commerce efficiency. The company's comprehensive technology platform integrates artificial intelligence, big data analytics, and cloud computing to provide personalized shopping experiences and optimize supply chain operations. JD's strategic partnerships with international brands and retailers have expanded its product portfolio and enhanced its appeal to consumers seeking authentic foreign products. The company's focus on rural market expansion and its innovative social commerce initiatives demonstrate its commitment to reaching underserved consumer segments and driving market growth through inclusive commerce strategies.
Market Key Players
Alibaba Group Holding Limited
ETao
AirBridgeCargo Airlines
AliExpress.com
Veepee
Amazon.com, Inc.
Fruugo.com Ltd.
ASOS
BigCommerce
eBay Inc.
LightInTheBox
Eunimart Multichannel
Jagged Peak
Zalando
JD.com
Vipshop
Pitney Bowes
Tmall
Driver:
Advancements in Digital Payment Ecosystems:
The evolution of secure digital payment systems has dramatically accelerated cross-border e-commerce adoption. Leading payment gateways and banks have developed sophisticated anti-fraud mechanisms, multi-currency processing, and seamless checkout integrations that build consumer confidence in transacting with foreign sellers. These systems reduce friction in payments, supporting impulse buying and repeat purchases across borders.
Mobile Commerce Proliferation:
Rising smartphone penetration has empowered consumers to shop anytime, anywhere. Mobile-optimized platforms and apps from Amazon, Alibaba, and Rakuten enable users to browse products, track orders, and complete payments on the go. Push notifications, app-exclusive discounts, and simplified checkout processes have collectively driven cross-border sales via mobile devices to unprecedented levels.
Restrain:
Regulatory Complexity and Customs Duties:
Cross-border transactions often involve compliance with varying tax regulations, import/export duties, and customs procedures that increase fulfillment costs and delivery times. These challenges deter smaller sellers from participating and may lead to unexpected fees for buyers, affecting customer satisfaction and loyalty.
Currency Fluctuations and Payment Risks:
Volatile exchange rates can create uncertainty in pricing and margins for merchants and consumers alike. Additionally, cross-border payments are more susceptible to chargebacks, fraud, and settlement delays, requiring continuous investment in risk management and financial reconciliation systems.
Opportunities:
Expansion in Emerging Markets:
Rapid digital adoption in Latin America, Southeast Asia, and parts of Africa presents significant untapped potential. Consumers in these regions increasingly seek high-quality international products unavailable domestically. Retailers that localize payment methods and logistics can capitalize on this growing demand.
Demand for Niche and Authentic Products:
There is a rising consumer preference for authentic and niche products, such as specialty beauty items, organic foods, and luxury fashion. Brands and marketplaces that can showcase unique international assortments stand to gain loyal customer bases seeking exclusivity and authenticity.
Trends:
Personalization and AI Integration:
Leading platforms are leveraging artificial intelligence and machine learning to create personalized shopping experiences. AI-powered recommendation engines, dynamic pricing, and chatbots enhance user engagement and conversion rates, setting new standards in cross-border retail.
Sustainable and Ethical Sourcing:
Consumers are increasingly concerned about sustainability and ethical practices. Cross-border sellers are responding with transparent sourcing information, carbon-neutral shipping options, and eco-friendly packaging. These initiatives not only attract environmentally conscious buyers but also strengthen brand reputation.
Recent Development:
In February 2025: Shift4, a global leader in integrated payments and commerce technology, has announced a definitive agreement to acquire Global Blue, a premier provider of specialty payments and technology solutions for tax-free shopping, dynamic currency conversion, and payment services to some of the world’s largest retail brands.
In May 2024: Global e-commerce leader Ubuy has marked a significant milestone by inaugurating its first warehouse in Germany. This strategic move is designed to enhance the company’s logistics capabilities and better serve its international customer base.