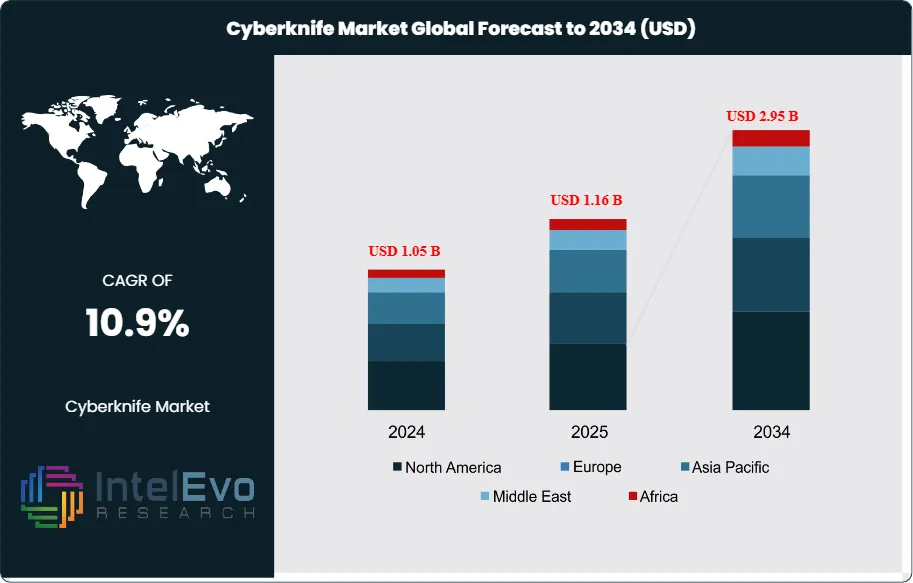
The CyberKnife Market is estimated at USD 1.05 billion in 2024 and is projected to reach approximately USD 2.95 billion by 2034, registering a strong CAGR of about 10.9% during 2025–2034. This sustained growth is driven by rising adoption of non-invasive stereotactic radiosurgery for oncology indications, increasing preference for outpatient radiation therapies, and expanding use in treating complex tumors of the brain, spine, lung, and prostate. Continuous technological upgrades—such as real-time tumor tracking, AI-assisted treatment planning, and improved robotic precision—are further strengthening clinical outcomes and accelerating CyberKnife installations across advanced cancer centers and specialty hospitals worldwide.
This growth reflects accelerating demand for non-invasive cancer treatments worldwide. Cyberknife uses robotic-guided stereotactic radiosurgery to deliver precise radiation doses to tumors without surgical incisions or extended recovery periods. The system targets lesions across multiple anatomical sites including prostate, brain, spine, lung, liver, kidney, and pancreas. Its advantage over conventional radiation therapy lies in real-time tumor tracking and sub-millimeter accuracy, reducing collateral damage to healthy tissue.
Rising cancer incidence drives market expansion. Lifestyle factors such as physical inactivity, unhealthy diets, and tobacco and alcohol consumption contribute to growing cancer rates globally. The World Health Organization projects cancer cases will rise by nearly 50% by 2030, creating urgent demand for effective treatment options. Cyberknife addresses this need by offering outpatient procedures that minimize hospitalization costs and patient downtime.
Technology advances strengthen market positioning. Recent systems integrate artificial intelligence for treatment planning, enabling faster dose calculations and improved precision. Manufacturers focus on expanding treatable conditions beyond oncology into benign tumors and functional disorders. Software upgrades allow physicians to treat moving targets like lung tumors that shift with breathing, previously challenging for traditional radiosurgery platforms.
North America dominates market share due to established healthcare infrastructure and reimbursement frameworks supporting advanced cancer care. The region accounts for approximately 45% of global installations. However, Asia Pacific shows the fastest growth trajectory as healthcare spending increases and medical tourism expands. Countries like India and China invest in specialty cancer centers equipped with advanced radiosurgery systems to serve large patient populations.
Market challenges include high equipment costs, which restrict adoption in resource-limited settings, and competition from alternative technologies like proton therapy and conventional linear accelerators. Reimbursement variability across regions affects treatment accessibility. Despite these headwinds, clinical evidence supporting Cyberknife efficacy and patient preference for non-invasive options position the market for sustained growth. Strategic focus areas include emerging markets, clinical protocol development for new indications, and partnerships between device manufacturers and healthcare providers to expand treatment access.
Key Takeaways
Market Growth: The global Cyberknife market expanded from USD 1.05 billion in 2024 to an estimated USD 4.85 billion by 2034, registering a 16.2% CAGR. Rising cancer incidence combined with patient preference for non-invasive treatment options drives this trajectory.
Application: Oncology applications account for over 85% of Cyberknife procedures, with brain tumors, lung cancer, and prostate cancer representing the highest treatment volumes. These three cancer types generate approximately 60% of total procedure revenue due to complex anatomical requirements that favor robotic precision.
End User: Specialty cancer centers and hospitals with dedicated radiosurgery departments capture roughly 75% of market installations. These facilities justify capital investments through high patient throughput and premium reimbursement rates for stereotactic procedures.
Driver: Growing cancer burden worldwide fuels demand. Global cancer cases are projected to exceed 28 million annually by 2030, up from 19.3 million in 2020, creating sustained need for effective treatment capacity.
Restraint: High equipment acquisition costs ranging from USD 3 to 6 Million per system limit adoption in emerging markets and smaller healthcare facilities. This pricing barrier restricts market penetration to approximately 500 installations globally.
Opportunity: Asia Pacific markets show 15-18% annual growth potential as healthcare infrastructure modernizes and medical tourism expands. India and China add an estimated 30-40 Cyberknife systems annually to serve large patient populations.
Trend: Artificial intelligence integration for treatment planning reduces procedure setup time by 30-40% and improves dose optimization accuracy. Major manufacturers now embed AI algorithms in software platforms to enhance clinical workflow efficiency.
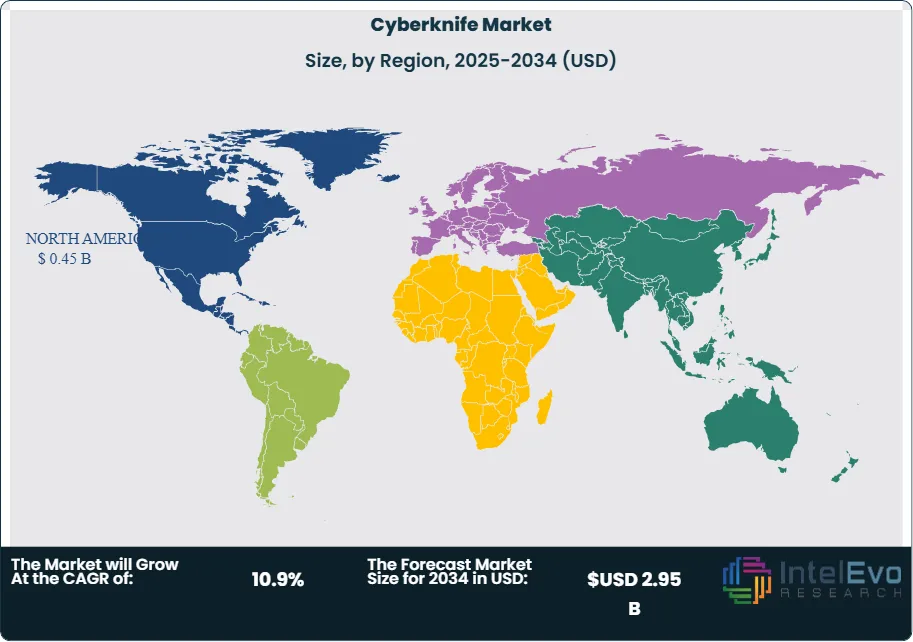
Regional Analysis: North America holds 45% market share due to established reimbursement frameworks and high healthcare spending. Europe accounts for 30%, while Asia Pacific captures 20% but grows fastest at projected 16-17% CAGR through 2032.
Product Analysis
Body Cyberknife systems generate the highest revenue in the global market, driven primarily by escalating breast and abdominal cancer diagnoses worldwide. These systems treat tumors in the torso, including lung, liver, pancreas, and prostate lesions, which collectively account for over 60% of cancer cases requiring stereotactic radiosurgery. Breast cancer alone affects approximately 2.3 million women annually, creating substantial demand for body-focused treatment platforms.
Head Cyberknife systems capture a smaller but growing market segment, addressing brain tumors, acoustic neuromas, and trigeminal neuralgia. These units serve specialized neurosurgery departments and require additional imaging protocols for intracranial precision. Market growth for head systems reaches 10-11% annually as adoption spreads beyond major academic medical centers into community hospitals.
Equipment manufacturers increasingly offer dual-purpose systems capable of treating both anatomical regions, reducing facility capital requirements. This integration approach appeals to mid-sized hospitals seeking comprehensive radiosurgery capabilities without purchasing separate platforms.
Application Analysis
Cancer applications dominate Cyberknife utilization, representing approximately 70% of total procedures. Prostate, lung, and colorectal cancers comprise the top treatment volumes in most markets, reflecting both disease prevalence and clinical evidence supporting radiosurgery outcomes. The United States reports these three cancer types among its five most diagnosed conditions, directly correlating with Cyberknife procedure demand.
Vascular malformation treatment shows the fastest growth trajectory at projected 14-16% CAGR through 2030. Arteriovenous malformations and cavernous angiomas respond well to non-invasive radiation delivery, eliminating surgical risks associated with traditional open procedures. Patients experience minimal recovery time and avoid complications like bleeding or neurological deficits.
Tumor applications beyond cancer, including benign growths and functional disorders, expand the addressable market. Pituitary adenomas, meningiomas, and vestibular schwannomas increasingly receive Cyberknife treatment as clinical protocols develop. This diversification reduces dependence on oncology referrals alone and stabilizes revenue streams for radiosurgery centers.
End User Analysis
Hospitals control 43% of the Cyberknife market and maintain the strongest growth outlook through 2028. These facilities possess the infrastructure, staffing expertise, and patient volumes required to justify multi-million dollar system investments. Large medical centers treat 300-500 patients annually per Cyberknife unit, generating substantial procedure revenue.
Radiotherapy centers represent the second largest segment, offering specialized cancer treatment in dedicated outpatient facilities. These centers emphasize workflow efficiency and rapid patient throughput, treating higher volumes than general hospitals. Their focus on radiation oncology allows deeper expertise in complex treatment planning and delivery.
Ambulatory surgical centers show emerging potential with projected 13-15% annual growth. Lower facility costs and reduced wait times attract patients seeking convenient outpatient care. ASCs invest in Cyberknife systems to differentiate services and capture insured patients willing to pay premium rates for non-hospital settings. However, regulatory requirements and reimbursement limitations in certain jurisdictions constrain broader adoption.
Regional Analysis
North America holds 43% global market share, supported by robust healthcare infrastructure and favorable reimbursement policies. The United States added radiation therapy facilities at 16.7% annually from 2020-2024, expanding treatment access across metropolitan and rural markets. Medicare and private insurers cover Cyberknife procedures for most indications, removing financial barriers for patients.
Asia Pacific exhibits the fastest regional growth at 16-18% CAGR, driven by massive population scale and rising cancer rates. The region accounts for 49% of global cancer diagnoses but maintains significantly lower radiosurgery penetration than developed markets. China and India prioritize advanced cancer care investments to address growing patient demand and reduce overseas medical travel.
Europe captures approximately 28% market share with steady 9-10% growth rates. Western European countries maintain mature adoption levels, while Eastern European markets accelerate installations as healthcare budgets increase. Middle East and Africa remain nascent markets with under 5% combined share but show interest from Gulf Cooperation Council nations building specialty cancer centers to serve regional populations.
By Product (Head Cyberknife, Body Cyberknife), By Application (Vascular Malformation, Cancer, Tumor, Others Application), By End-User (Radiotherapy Centers, Hospitals, Clinics, Ambulatory Surgical Center, Other End Users)
Research Methodology
Primary Research- 100 Interviews of Stakeholders
Secondary Research
Desk Research
Regional scope
North America (United States, Canada, Mexico)
Latin America (Brazil, Argentina, Columbia)
East Asia And Pacific (China, Japan, South Korea, Australia, Cambodia, Fiji, Indonesia)
Sea And South Asia (India, Singapore, Thailand, Taiwan, Malaysia)
Eastern Europe (Poland, Russia, Czech Republic, Romania)
Western Europe (Germany, U.K., France, Spain, Itlay)
Middle East & Africa (GCC Countries, Egypt, Nigeria, South Africa, Israel)
Competitive Landscape
Shenzhen Genemdx Biotech, Elekta AB, Philips Healthcare, Varian Medical Systems, Mevion Medical Systems, Inc., Intraop Medical, Sumitomo Heavy Industry Ltd, Accuray Incorporated, Nordion Inc., Sensus Healthcare, Toshiba Medical Systems Corporation, Varian Medical Systems International Ag, IBA Group, GE Healthcare, Nucletron B.V., Mitsubishi Electric, Koninklijke Philips N.V., Other Key Players
Customization Scope
Customization for segments, region/country-level will be provided. Moreover, additional customization can be done based on the requirements.
Pricing and Purchase Options
Avail customized purchase options to meet your exact research needs. We have three licenses to opt for: Single User License, Multi-User License (Up to 5 Users), Corporate Use License (Unlimited User and Printable PDF).
TABLE OF CONTENTS
1. EXECUTIVE SUMMARY
1.1. MARKET SNAPSHOT
1.2. KEY FINDINGS & INSIGHTS
1.3. ANALYST RECOMMENDATIONS
1.4. FUTURE OUTLOOK
2. RESEARCH METHODOLOGY
2.1. MARKET DEFINITION & SCOPE
2.2. RESEARCH OBJECTIVES: PRIMARY & SECONDARY DATA SOURCES
2.3. DATA COLLECTION SOURCES
2.3.1. COVERAGE OF 100+ PRIMARY RESEARCH/CONSULTATION CALLS WITH INDUSTRY STAKEHOLDERS
FIGURE 17 NORTH AMERICA CYBERKNIFE CURRENT AND FUTURE TYPE ANALYSIS, 2025–2034, (USD MILLION)
FIGURE 18 NORTH AMERICA CYBERKNIFE CURRENT AND FUTURE END USER ANALYSIS, 2025–2034, (USD MILLION)
FIGURE 19 MARKET SHARE BY COUNTRY
FIGURE 20 LATIN AMERICA CYBERKNIFE CURRENT AND FUTURE TYPE ANALYSIS, 2025–2034, (USD MILLION)
FIGURE 21 LATIN AMERICA CYBERKNIFE CURRENT AND FUTURE END USER ANALYSIS, 2025–2034, (USD MILLION)
FIGURE 22 MARKET SHARE BY COUNTRY
FIGURE 23 EASTERN EUROPE CYBERKNIFE CURRENT AND FUTURE TYPE ANALYSIS, 2025–2034, (USD MILLION)
FIGURE 24 EASTERN EUROPE CYBERKNIFE CURRENT AND FUTURE END USER ANALYSIS, 2025–2034, (USD MILLION)
FIGURE 25 MARKET SHARE BY COUNTRY
FIGURE 26 WESTERN EUROPE CYBERKNIFE CURRENT AND FUTURE TYPE ANALYSIS, 2025–2034, (USD MILLION)
FIGURE 27 WESTERN EUROPE CYBERKNIFE CURRENT AND FUTURE END USER ANALYSIS, 2025–2034, (USD MILLION)
FIGURE 28 MARKET SHARE BY COUNTRY
FIGURE 29 EAST ASIA AND PACIFIC CYBERKNIFE CURRENT AND FUTURE TYPE ANALYSIS, 2025–2034, (USD MILLION)
FIGURE 30 EAST ASIA AND PACIFIC CYBERKNIFE CURRENT AND FUTURE END USER ANALYSIS, 2025–2034, (USD MILLION)
FIGURE 31 MARKET SHARE BY COUNTRY
FIGURE 32 SEA AND SOUTH ASIA CYBERKNIFE CURRENT AND FUTURE TYPE ANALYSIS, 2025–2034, (USD MILLION)
FIGURE 33 SEA AND SOUTH ASIA CYBERKNIFE CURRENT AND FUTURE END USER ANALYSIS, 2025–2034, (USD MILLION)
FIGURE 34 MARKET SHARE BY COUNTRY
FIGURE 35 MIDDLE EAST AND AFRICA CYBERKNIFE CURRENT AND FUTURE TYPE ANALYSIS, 2025–2034, (USD MILLION)
FIGURE 36 MIDDLE EAST AND AFRICA CYBERKNIFE CURRENT AND FUTURE END USER ANALYSIS, 2025–2034, (USD MILLION)
FIGURE 37 NORTH AMERICA CYBERKNIFE CURRENT AND FUTURE MARKET VOLUME SHARE REGIONAL ANALYSIS, 2025–2034, (USD MILLION)
FIGURE 38 U.S. CYBERKNIFE CURRENT AND FUTURE TYPE ANALYSIS, 2025–2034, (USD MILLION)
FIGURE 39 U.S. CYBERKNIFE CURRENT AND FUTURE END USER ANALYSIS, 2025–2034, (USD MILLION)
FIGURE 40 CANADA CYBERKNIFE CURRENT AND FUTURE TYPE ANALYSIS, 2025–2034, (USD MILLION)
FIGURE 41 CANADA CYBERKNIFE CURRENT AND FUTURE END USER ANALYSIS, 2025–2034, (USD MILLION)
FIGURE 42 LATIN AMERICA CYBERKNIFE CURRENT AND FUTURE MARKET VOLUME SHARE REGIONAL ANALYSIS, 2025–2034, (USD MILLION)
FIGURE 43 MEXICO CYBERKNIFE CURRENT AND FUTURE TYPE ANALYSIS, 2025–2034, (USD MILLION)
FIGURE 44 MEXICO CYBERKNIFE CURRENT AND FUTURE END USER ANALYSIS, 2025–2034, (USD MILLION)
FIGURE 45 BRAZIL CYBERKNIFE CURRENT AND FUTURE TYPE ANALYSIS, 2025–2034, (USD MILLION)
FIGURE 46 BRAZIL CYBERKNIFE CURRENT AND FUTURE END USER ANALYSIS, 2025–2034, (USD MILLION)
FIGURE 47 ARGENTINA CYBERKNIFE CURRENT AND FUTURE TYPE ANALYSIS, 2025–2034, (USD MILLION)
FIGURE 48 ARGENTINA CYBERKNIFE CURRENT AND FUTURE END USER ANALYSIS, 2025–2034, (USD MILLION)
FIGURE 49 COLUMBIA CYBERKNIFE CURRENT AND FUTURE TYPE ANALYSIS, 2025–2034, (USD MILLION)
FIGURE 50 COLUMBIA CYBERKNIFE CURRENT AND FUTURE END USER ANALYSIS, 2025–2034, (USD MILLION)
FIGURE 51 REST OF LATIN AMERICA CYBERKNIFE CURRENT AND FUTURE TYPE ANALYSIS, 2025–2034, (USD MILLION)
FIGURE 52 REST OF LATIN AMERICA CYBERKNIFE CURRENT AND FUTURE END USER ANALYSIS, 2025–2034, (USD MILLION)
FIGURE 53 EASTERN EUROPE CYBERKNIFE CURRENT AND FUTURE MARKET VOLUME SHARE REGIONAL ANALYSIS, 2025–2034, (USD MILLION)
FIGURE 54 POLAND CYBERKNIFE CURRENT AND FUTURE TYPE ANALYSIS, 2025–2034, (USD MILLION)
FIGURE 55 POLAND CYBERKNIFE CURRENT AND FUTURE END USER ANALYSIS, 2025–2034, (USD MILLION)
FIGURE 56 RUSSIA CYBERKNIFE CURRENT AND FUTURE TYPE ANALYSIS, 2025–2034, (USD MILLION)
FIGURE 57 RUSSIA CYBERKNIFE CURRENT AND FUTURE END USER ANALYSIS, 2025–2034, (USD MILLION)
FIGURE 58 CZECH REPUBLIC CYBERKNIFE CURRENT AND FUTURE TYPE ANALYSIS, 2025–2034, (USD MILLION)
FIGURE 59 CZECH REPUBLIC CYBERKNIFE CURRENT AND FUTURE END USER ANALYSIS, 2025–2034, (USD MILLION)
FIGURE 60 ROMANIA CYBERKNIFE CURRENT AND FUTURE TYPE ANALYSIS, 2025–2034, (USD MILLION)
FIGURE 61 ROMANIA CYBERKNIFE CURRENT AND FUTURE END USER ANALYSIS, 2025–2034, (USD MILLION)
FIGURE 62 REST OF EASTERN EUROPE CYBERKNIFE CURRENT AND FUTURE TYPE ANALYSIS, 2025–2034, (USD MILLION)
FIGURE 63 REST OF EASTERN EUROPE CYBERKNIFE CURRENT AND FUTURE END USER ANALYSIS, 2025–2034, (USD MILLION)
FIGURE 64 WESTERN EUROPE CYBERKNIFE CURRENT AND FUTURE MARKET VOLUME SHARE REGIONAL ANALYSIS, 2025–2034, (USD MILLION)
FIGURE 65 GERMANY CYBERKNIFE CURRENT AND FUTURE TYPE ANALYSIS, 2025–2034, (USD MILLION)
FIGURE 66 GERMANY CYBERKNIFE CURRENT AND FUTURE END USER ANALYSIS, 2025–2034, (USD MILLION)
FIGURE 67 FRANCE CYBERKNIFE CURRENT AND FUTURE TYPE ANALYSIS, 2025–2034, (USD MILLION)
FIGURE 68 FRANCE CYBERKNIFE CURRENT AND FUTURE END USER ANALYSIS, 2025–2034, (USD MILLION)
FIGURE 69 UK CYBERKNIFE CURRENT AND FUTURE TYPE ANALYSIS, 2025–2034, (USD MILLION)
FIGURE 70 UK CYBERKNIFE CURRENT AND FUTURE END USER ANALYSIS, 2025–2034, (USD MILLION)
FIGURE 71 SPAIN CYBERKNIFE CURRENT AND FUTURE TYPE ANALYSIS, 2025–2034, (USD MILLION)
FIGURE 72 SPAIN CYBERKNIFE CURRENT AND FUTURE END USER ANALYSIS, 2025–2034, (USD MILLION)
FIGURE 73 ITALY CYBERKNIFE CURRENT AND FUTURE TYPE ANALYSIS, 2025–2034, (USD MILLION)
FIGURE 74 ITALY CYBERKNIFE CURRENT AND FUTURE END USER ANALYSIS, 2025–2034, (USD MILLION)
FIGURE 75 REST OF WESTERN EUROPE CYBERKNIFE CURRENT AND FUTURE TYPE ANALYSIS, 2025–2034, (USD MILLION)
FIGURE 76 REST OF WESTERN EUROPE CYBERKNIFE CURRENT AND FUTURE END USER ANALYSIS, 2025–2034, (USD MILLION)
FIGURE 77 EAST ASIA AND PACIFIC CYBERKNIFE CURRENT AND FUTURE MARKET VOLUME SHARE REGIONAL ANALYSIS, 2025–2034, (USD MILLION)
FIGURE 78 CHINA CYBERKNIFE CURRENT AND FUTURE TYPE ANALYSIS, 2025–2034, (USD MILLION)
FIGURE 79 CHINA CYBERKNIFE CURRENT AND FUTURE END USER ANALYSIS, 2025–2034, (USD MILLION)
FIGURE 80 JAPAN CYBERKNIFE CURRENT AND FUTURE TYPE ANALYSIS, 2025–2034, (USD MILLION)
FIGURE 81 JAPAN CYBERKNIFE CURRENT AND FUTURE END USER ANALYSIS, 2025–2034, (USD MILLION)
FIGURE 82 AUSTRALIA CYBERKNIFE CURRENT AND FUTURE TYPE ANALYSIS, 2025–2034, (USD MILLION)
FIGURE 83 AUSTRALIA CYBERKNIFE CURRENT AND FUTURE END USER ANALYSIS, 2025–2034, (USD MILLION)
FIGURE 84 CAMBODIA CYBERKNIFE CURRENT AND FUTURE TYPE ANALYSIS, 2025–2034, (USD MILLION)
FIGURE 85 CAMBODIA CYBERKNIFE CURRENT AND FUTURE END USER ANALYSIS, 2025–2034, (USD MILLION)
FIGURE 86 FIJI CYBERKNIFE CURRENT AND FUTURE TYPE ANALYSIS, 2025–2034, (USD MILLION)
FIGURE 87 FIJI CYBERKNIFE CURRENT AND FUTURE END USER ANALYSIS, 2025–2034, (USD MILLION)
FIGURE 88 INDONESIA CYBERKNIFE CURRENT AND FUTURE TYPE ANALYSIS, 2025–2034, (USD MILLION)
FIGURE 89 INDONESIA CYBERKNIFE CURRENT AND FUTURE END USER ANALYSIS, 2025–2034, (USD MILLION)
FIGURE 90 SOUTH KOREA CYBERKNIFE CURRENT AND FUTURE TYPE ANALYSIS, 2025–2034, (USD MILLION)
FIGURE 91 SOUTH KOREA CYBERKNIFE CURRENT AND FUTURE END USER ANALYSIS, 2025–2034, (USD MILLION)
FIGURE 92 REST OF EAST ASIA AND PACIFIC CYBERKNIFE CURRENT AND FUTURE TYPE ANALYSIS, 2025–2034, (USD MILLION)
FIGURE 93 REST OF EAST ASIA AND PACIFIC CYBERKNIFE CURRENT AND FUTURE END USER ANALYSIS, 2025–2034, (USD MILLION)
FIGURE 94 SEA AND SOUTH ASIA CYBERKNIFE CURRENT AND FUTURE MARKET VOLUME SHARE REGIONAL ANALYSIS, 2025–2034, (USD MILLION)
FIGURE 95 BANGLADESH CYBERKNIFE CURRENT AND FUTURE TYPE ANALYSIS, 2025–2034, (USD MILLION)
FIGURE 96 BANGLADESH CYBERKNIFE CURRENT AND FUTURE END USER ANALYSIS, 2025–2034, (USD MILLION)
FIGURE 97 NEW ZEALAND CYBERKNIFE CURRENT AND FUTURE TYPE ANALYSIS, 2025–2034, (USD MILLION)
FIGURE 98 NEW ZEALAND CYBERKNIFE CURRENT AND FUTURE END USER ANALYSIS, 2025–2034, (USD MILLION)
FIGURE 99 INDIA CYBERKNIFE CURRENT AND FUTURE TYPE ANALYSIS, 2025–2034, (USD MILLION)
FIGURE 100 INDIA CYBERKNIFE CURRENT AND FUTURE END USER ANALYSIS, 2025–2034, (USD MILLION)
FIGURE 101 SINGAPORE CYBERKNIFE CURRENT AND FUTURE TYPE ANALYSIS, 2025–2034, (USD MILLION)
FIGURE 102 SINGAPORE CYBERKNIFE CURRENT AND FUTURE END USER ANALYSIS, 2025–2034, (USD MILLION)
FIGURE 103 THAILAND CYBERKNIFE CURRENT AND FUTURE TYPE ANALYSIS, 2025–2034, (USD MILLION)
FIGURE 104 THAILAND CYBERKNIFE CURRENT AND FUTURE END USER ANALYSIS, 2025–2034, (USD MILLION)
FIGURE 105 TAIWAN CYBERKNIFE CURRENT AND FUTURE TYPE ANALYSIS, 2025–2034, (USD MILLION)
FIGURE 106 TAIWAN CYBERKNIFE CURRENT AND FUTURE END USER ANALYSIS, 2025–2034, (USD MILLION)
FIGURE 107 MALAYSIA CYBERKNIFE CURRENT AND FUTURE TYPE ANALYSIS, 2025–2034, (USD MILLION)
FIGURE 108 MALAYSIA CYBERKNIFE CURRENT AND FUTURE END USER ANALYSIS, 2025–2034, (USD MILLION)
FIGURE 109 REST OF SEA AND SOUTH ASIA CYBERKNIFE CURRENT AND FUTURE TYPE ANALYSIS, 2025–2034, (USD MILLION)
FIGURE 110 REST OF SEA AND SOUTH ASIA CYBERKNIFE CURRENT AND FUTURE END USER ANALYSIS, 2025–2034, (USD MILLION)
FIGURE 111 MIDDLE EAST AND AFRICA CYBERKNIFE CURRENT AND FUTURE MARKET VOLUME SHARE REGIONAL ANALYSIS, 2025–2034, (USD MILLION)
FIGURE 112 GCC COUNTRIES CYBERKNIFE CURRENT AND FUTURE TYPE ANALYSIS, 2025–2034, (USD MILLION)
FIGURE 113 GCC COUNTRIES CYBERKNIFE CURRENT AND FUTURE END USER ANALYSIS, 2025–2034, (USD MILLION)
FIGURE 114 SAUDI ARABIA CYBERKNIFE CURRENT AND FUTURE TYPE ANALYSIS, 2025–2034, (USD MILLION)
FIGURE 115 SAUDI ARABIA CYBERKNIFE CURRENT AND FUTURE END USER ANALYSIS, 2025–2034, (USD MILLION)
FIGURE 116 UAE CYBERKNIFE CURRENT AND FUTURE TYPE ANALYSIS, 2025–2034, (USD MILLION)
FIGURE 117 UAE CYBERKNIFE CURRENT AND FUTURE END USER ANALYSIS, 2025–2034, (USD MILLION)
FIGURE 118 BAHRAIN CYBERKNIFE CURRENT AND FUTURE TYPE ANALYSIS, 2025–2034, (USD MILLION)
FIGURE 119 BAHRAIN CYBERKNIFE CURRENT AND FUTURE END USER ANALYSIS, 2025–2034, (USD MILLION)
FIGURE 120 KUWAIT CYBERKNIFE CURRENT AND FUTURE TYPE ANALYSIS, 2025–2034, (USD MILLION)
FIGURE 121 KUWAIT CYBERKNIFE CURRENT AND FUTURE END USER ANALYSIS, 2025–2034, (USD MILLION)
FIGURE 122 OMAN CYBERKNIFE CURRENT AND FUTURE TYPE ANALYSIS, 2025–2034, (USD MILLION)
FIGURE 123 OMAN CYBERKNIFE CURRENT AND FUTURE END USER ANALYSIS, 2025–2034, (USD MILLION)
FIGURE 124 QATAR CYBERKNIFE CURRENT AND FUTURE TYPE ANALYSIS, 2025–2034, (USD MILLION)
FIGURE 125 QATAR CYBERKNIFE CURRENT AND FUTURE END USER ANALYSIS, 2025–2034, (USD MILLION)
FIGURE 126 EGYPT CYBERKNIFE CURRENT AND FUTURE TYPE ANALYSIS, 2025–2034, (USD MILLION)
FIGURE 127 EGYPT CYBERKNIFE CURRENT AND FUTURE END USER ANALYSIS, 2025–2034, (USD MILLION)
FIGURE 128 NIGERIA CYBERKNIFE CURRENT AND FUTURE TYPE ANALYSIS, 2025–2034, (USD MILLION)
FIGURE 129 NIGERIA CYBERKNIFE CURRENT AND FUTURE END USER ANALYSIS, 2025–2034, (USD MILLION)
FIGURE 130 SOUTH AFRICA CYBERKNIFE CURRENT AND FUTURE TYPE ANALYSIS, 2025–2034, (USD MILLION)
FIGURE 131 SOUTH AFRICA CYBERKNIFE CURRENT AND FUTURE END USER ANALYSIS, 2025–2034, (USD MILLION)
FIGURE 132 ISRAEL CYBERKNIFE CURRENT AND FUTURE TYPE ANALYSIS, 2025–2034, (USD MILLION)
FIGURE 133 ISRAEL CYBERKNIFE CURRENT AND FUTURE END USER ANALYSIS, 2025–2034, (USD MILLION)
FIGURE 134 REST OF MEA CYBERKNIFE CURRENT AND FUTURE TYPE ANALYSIS, 2025–2034, (USD MILLION)
FIGURE 135 REST OF MEA CYBERKNIFE CURRENT AND FUTURE END USER ANALYSIS, 2025–2034, (USD MILLION)
FIGURE 136 U. S. MARKET SHARE ANALYSIS BY TYPE (2024)
FIGURE 137 U. S. MARKET SHARE ANALYSIS BY END USER (2024)
FIGURE 138 CANADA MARKET SHARE ANALYSIS BY TYPE (2024)
FIGURE 139 CANADA MARKET SHARE ANALYSIS BY END USER (2024)
FIGURE 140 MEXICO MARKET SHARE ANALYSIS BY TYPE (2024)
FIGURE 141 MEXICO MARKET SHARE ANALYSIS BY END USER (2024)
FIGURE 142 CHINA MARKET SHARE ANALYSIS BY TYPE (2024)
FIGURE 143 CHINA MARKET SHARE ANALYSIS BY END USER (2024)
FIGURE 144 JAPAN MARKET SHARE ANALYSIS BY TYPE (2024)
FIGURE 145 JAPAN MARKET SHARE ANALYSIS BY END USER (2024)
FIGURE 146 INDIA MARKET SHARE ANALYSIS BY TYPE (2024)
FIGURE 147 INDIA MARKET SHARE ANALYSIS BY END USER (2024)
FIGURE 148 SOUTH KOREA MARKET SHARE ANALYSIS BY TYPE (2024)
FIGURE 149 SOUTH KOREA MARKET SHARE ANALYSIS BY END USER (2024)
FIGURE 150 SAUDI ARABIA MARKET SHARE ANALYSIS BY TYPE (2024)
FIGURE 151 SAUDI ARABIA MARKET SHARE ANALYSIS BY END USER (2024)
FIGURE 152 UAE MARKET SHARE ANALYSIS BY TYPE (2024)
FIGURE 153 UAE MARKET SHARE ANALYSIS BY END USER (2024)
FIGURE 154 EGYPT MARKET SHARE ANALYSIS BY TYPE (2024)
FIGURE 155 EGYPT MARKET SHARE ANALYSIS BY END USER (2024)
FIGURE 156 NIGERIA MARKET SHARE ANALYSIS BY TYPE (2024)
FIGURE 157 NIGERIA MARKET SHARE ANALYSIS BY END USER (2024)
FIGURE 158 SOUTH AFRICA MARKET SHARE ANALYSIS BY TYPE (2024)
FIGURE 159 SOUTH AFRICA MARKET SHARE ANALYSIS BY END USER (2024)
FIGURE 160 GERMANY MARKET SHARE ANALYSIS BY TYPE (2024)
FIGURE 161 GERMANY MARKET SHARE ANALYSIS BY END USER (2024)
FIGURE 162 FRANCE MARKET SHARE ANALYSIS BY TYPE (2024)
FIGURE 163 FRANCE MARKET SHARE ANALYSIS BY END USER (2024)
FIGURE 164 UK MARKET SHARE ANALYSIS BY TYPE (2024)
FIGURE 165 UK MARKET SHARE ANALYSIS BY END USER (2024)
FIGURE 166 SPAIN MARKET SHARE ANALYSIS BY TYPE (2024)
FIGURE 167 SPAIN MARKET SHARE ANALYSIS BY END USER (2024)
FIGURE 168 ITALY MARKET SHARE ANALYSIS BY TYPE (2024)
FIGURE 169 ITALY MARKET SHARE ANALYSIS BY END USER (2024)
FIGURE 170 BRAZIL MARKET SHARE ANALYSIS BY TYPE (2024)
FIGURE 171 BRAZIL MARKET SHARE ANALYSIS BY END USER (2024)
FIGURE 172 ARGENTINA MARKET SHARE ANALYSIS BY TYPE (2024)
FIGURE 173 ARGENTINA MARKET SHARE ANALYSIS BY END USER (2024)
FIGURE 174 COLUMBIA MARKET SHARE ANALYSIS BY TYPE (2024)
FIGURE 175 COLUMBIA MARKET SHARE ANALYSIS BY END USER (2024)
FIGURE 176 GLOBAL CYBERKNIFE CURRENT AND FUTURE MARKET KEY COUNTRY LEVEL ANALYSIS, 2024–2034, (USD MILLION)
FIGURE 177 FINANCIAL OVERVIEW:
Key Player Analysis
Accuray Incorporated: Accuray operates as a specialized player in robotic radiosurgery with its CyberKnife platform controlling 14-18% of the stereotactic radiation therapy market. The company posted USD 458.5 Million in revenue for fiscal 2025, reflecting 2.7% growth driven by Asia Pacific expansion and service contract renewals. Its CyberKnife S7 system remains the only dedicated robotic platform for stereotactic radiosurgery and stereotactic body radiation therapy, differentiating it from multi-purpose linear accelerators offered by larger competitors.
Strategic focus centers on emerging market penetration and technology advancement. Asia Pacific revenue surged 22% in fiscal 2025, with installations accelerating in China, Japan, and Australia where 5D Clinics opened Melbourne's first CyberKnife center in October 2025. The company maintains a book-to-bill ratio of 1.4 and a USD 452 Million backlog with zero order cancellations. Accuray integrates artificial intelligence for real-time tumor tracking and motion compensation, requiring only 1-5 treatment sessions versus 30-40 for conventional therapy. This efficiency appeals to outpatient facilities and ambulatory surgical centers seeking high-throughput capabilities. However, Accuray's narrow product portfolio and modest market capitalization of USD 181 Million limit its ability to compete with diversified medical equipment conglomerates in bundled procurement contracts.
Elekta AB: Elekta commands the largest position in stereotactic radiation therapy with 28-32% market share and holds 42% of the broader radiotherapy equipment market globally. The Swedish manufacturer offers comprehensive solutions including Elekta Unity MR-Linac for real-time adaptive therapy and Leksell Gamma Knife for intracranial radiosurgery. First quarter fiscal 2025/26 revenue increased 3% year-over-year, supported by European market strength and consistent equipment installations across developed healthcare systems.
Strategic differentiation comes through adaptive radiation therapy capabilities that adjust treatment plans during delivery based on real-time MRI imaging. This technology addresses tumor motion and anatomical changes, improving dose precision for soft tissue cancers. Elekta maintains strong relationships with academic medical centers and comprehensive cancer networks, positioning it for large-scale procurement opportunities. The company targets underserved low and middle-income countries where radiotherapy access remains limited, with these markets expected to drive long-term growth. Elekta's established service infrastructure and oncology informatics software create recurring revenue streams that stabilize financial performance across economic cycles. Recent installations emphasize hybrid MR-linear accelerator systems that command premium pricing and differentiate from conventional radiation platforms.
GE Healthcare: GE Healthcare positions itself as a late-stage challenger in radiation oncology, entering the market through diagnostic imaging integration rather than traditional linear accelerator manufacturing. The company unveiled its AI-enabled MR Contour DL solution at ESTRO 2025 Congress and showcased Prime for RT, the first photon-counting CT system designed specifically for radiation therapy planning. GE's strategy focuses on workflow optimization and imaging precision rather than beam delivery systems.
Differentiation stems from upstream diagnostic capabilities that streamline treatment planning. The Intelligent Radiation Therapy software standardizes complex workflows and reduces timeline from diagnosis to treatment by automating contouring processes and dose calculations. GE announced plans to acquire Sweden-based Spectronic Medical's MRI Planner software, which enables MR-only radiotherapy workflows without requiring additional CT scans. This integration approach appeals to facilities seeking unified imaging and treatment planning platforms from single vendors. GE's strength lies in established relationships with hospital radiology departments, providing cross-selling opportunities for radiation oncology solutions. However, the company lacks direct beam delivery equipment, limiting its addressable market to imaging and software segments rather than complete treatment systems that generate the majority of procedure revenue.
IBA Group: IBA Group dominates proton therapy systems with 56% market share of new installations in 2024 and 41% of total operational rooms globally, establishing clear leadership in particle accelerator technology. The Belgium-based company reported EUR 304.9 Million revenue in H1 2025, up 40% year-over-year, driven by backlog conversion from its EUR 1.3 Billion order book. IBA's Proteus ONE compact proton therapy system reduces facility footprint requirements by 50% compared to legacy installations, lowering capital barriers for mid-sized cancer centers.
Strategic initiatives emphasize clinical differentiation and market development. IBA launched the Proton Therapy Academy in June 2025, partnering with leading institutions to address workforce training gaps as less than 1% of radiation patients currently receive proton therapy versus 15% clinical appropriateness estimates. The company develops DynamicARC proton arc therapy at Corewell Health, targeting FDA submission by 2027 to deliver faster treatments with superior dose conformality. IBA secured four Proteus ONE orders in 2025 including contracts with Heidelberg University Hospital and Indian facilities, demonstrating traction in both established European and high-growth Asian markets. Post-H1 2025, IBA achieved positive REBIT in proton therapy after years of losses, signaling operational maturity. Competition intensifies from Varian-Siemens and Hitachi in proton systems, but IBA's early mover advantage and comprehensive service offerings maintain market leadership in this premium segment.
Market Key Players:
Shenzhen Genemdx Biotech
Elekta AB
Philips Healthcare
Varian Medical Systems
Mevion Medical Systems, Inc.
Intraop Medical
Sumitomo Heavy Industry Ltd
Accuray Incorporated
Nordion Inc.
Sensus Healthcare
Toshiba Medical Systems Corporation
Varian Medical Systems International Ag
IBA Group
GE Healthcare
Nucletron B.V.
Mitsubishi Electric
Koninklijke Philips N.V.
Other Key Players
Driver:
Rising Global Cancer Burden Expands Addressable Patient Pool
Global cancer incidence continues its upward trajectory in 2025, with the International Agency for Research on Cancer projecting 28.4 million new cases annually by 2030, up from 19.3 million in 2020. This 47% increase directly expands the addressable market for Cyberknife systems, particularly for lung, prostate, liver, pancreas, and spinal tumors that represent over 40% of diagnoses. Aging demographics compound this growth driver; populations aged 65 and older face cancer risk rates 10 times higher than younger cohorts, creating sustained demand for effective treatment options.
Non-invasive treatment capabilities position Cyberknife as a preferred alternative to open surgery. Patients experience outpatient procedures lasting 30-60 minutes versus multi-day hospitalizations, reducing facility costs by 40-50% compared to traditional surgical interventions. Recovery periods shrink from weeks to days, enabling faster return to normal activities and minimizing income disruption. Sub-millimeter targeting accuracy destroys tumors while preserving surrounding healthy tissue, translating to fewer complications and superior quality-of-life outcomes. These clinical and economic advantages drive adoption across both established and emerging healthcare markets.
Limited workforce availability constrains market expansion in 2025. Cyberknife operation requires specialized training in medical physics, radiation oncology, and robotic system management. The global shortage of qualified radiation oncologists, estimated at 12,000 practitioners below demand levels, creates bottlenecks for treatment capacity. Training programs typically require 12-18 months to develop competency, slowing facility ramp-up timelines after equipment installation.
High Capital and Maintenance Costs Constrain Installations
Capital intensity compounds adoption barriers. System costs ranging from USD 3-6 Million exceed budget capacity for mid-sized hospitals and most ambulatory centers, particularly in price-sensitive emerging markets. Annual maintenance contracts add USD 200,000-400,000 in ongoing expenses. These financial requirements limit installations to approximately 500 sites worldwide, concentrating access in affluent regions with favorable reimbursement structures. Competitive pressure from lower-cost linear accelerators offering similar stereotactic capabilities further challenges market penetration.
Opportunity:
Emerging Markets Create the Strongest Expansion Runway
Emerging market expansion offers the highest growth potential through 2030. Asia Pacific accounts for 49% of global cancer cases but maintains Cyberknife penetration below 15% of developed market levels. India and China collectively add 50-70 new cancer treatment facilities annually as healthcare budgets increase and medical tourism accelerates. Government initiatives in these regions prioritize advanced radiation therapy access, creating openings for strategic partnerships between device manufacturers and local healthcare networks.
Broadening Clinical Indications Unlock New Revenue Streams
Clinical indication expansion broadens revenue opportunities beyond traditional oncology applications. Treatment protocols now include benign tumors, trigeminal neuralgia, and vascular malformations, increasing addressable conditions by 25-30%. Manufacturers invest in software enhancements enabling new treatment algorithms and faster dose calculations. Reimbursement approvals for additional indications remove payment barriers and incentivize physician adoption. This diversification reduces dependence on cancer referrals alone and stabilizes facility utilization rates across seasonal variations.
Trend:
AI-Driven Treatment Planning Improves Throughput and Accuracy
Artificial intelligence integration transforms treatment planning workflows in 2025. Machine learning algorithms now automate contouring processes that previously required 2-3 hours of physicist time, reducing preparation to 20-30 minutes per patient. Predictive dose optimization improves treatment precision while minimizing radiation exposure to critical organs. Major equipment vendors embed AI capabilities as standard features, responding to facility demands for improved throughput and clinical outcomes.
Shift Toward Outpatient and Decentralized Care Models
Outpatient treatment models gain momentum as healthcare systems shift toward value-based care structures. Ambulatory surgical centers and specialty radiation clinics capture market share from traditional hospital departments by offering shorter wait times and lower facility fees. This decentralization expands patient access in suburban and rural markets previously underserved by academic medical centers. Hybrid ownership models, combining device manufacturer financing with local physician partnerships, accelerate installation rates by reducing upfront capital requirements and sharing procedure revenues.
Recent Developments
February 2025 – IBA Group: IBA secured a binding contract with Asian Institute of Gastroenterology in Hyderabad, India for a ProteusONE compact proton therapy system valued at approximately EUR 30-35 Million, including Quality Assurance packages and future DynamicARC beam delivery capabilities pending regulatory approval. This contract strengthens IBA's position in the rapidly growing Indian market where proton therapy adoption accelerates to serve large cancer patient populations.
March 2025 – IBA Group: Apollo Hospitals Enterprise signed a term sheet agreement to acquire one ProteusONE system with an option for an additional unit, with each system valued between EUR 35-45 Million including multi-year maintenance contracts. Apollo anticipates commencing patient treatments by 2028, reinforcing its leadership in advanced radiation therapy across Asia and demonstrating strong validation from an existing IBA customer since 2013.
May 2025 – GE HealthCare: The company unveiled its AI-enabled MR Contour DL solution at ESTRO 2025 Congress, alongside announcing plans to acquire Sweden-based Spectronic Medical's MRI Planner software to enable MR-only radiotherapy workflows without requiring additional CT scans. This strategic expansion positions GE HealthCare to capture upstream treatment planning market share by integrating imaging precision with workflow automation capabilities.
June 2025 – IBA Group: IBA launched the Proton Therapy Academy in partnership with leading global institutions to address critical workforce training gaps, as less than 1% of radiation patients currently receive proton therapy versus 15% clinical appropriateness estimates. This educational initiative accelerates market development by building qualified practitioner capacity across IBA's expanding global installation base.
July 2025 – Elekta AB: Elekta received FDA 510(k) clearance to expand Leksell Gamma Knife indications for treating refractory, drug-resistant mesial temporal lobe epilepsy in adults, diversifying beyond traditional oncology applications. This regulatory milestone opens new revenue streams in functional neurosurgery and reduces dependence on cancer referrals alone, with approximately 3.4 million adults in the U.S. affected by epilepsy.
September 2025 – GE HealthCare: GE HealthCare showcased updated Intelligent Radiation Therapy software at ASTRO 2025, featuring InstaPlan technology that reduces CT simulation to treatment plan completion from 7 days to 7 minutes for breast and prostate cancer cases based on early adopter data. The solution also introduced theranostics workflow capabilities, positioning GE to capture emerging radiopharmaceutical market segments projected to exceed USD 10 Billion by 2030.
October 2025 – Accuray Incorporated: 5D Clinics and Icon Group treated the first patients in Melbourne, Australia using the CyberKnife S7 System, marking the initial installation from their joint venture partnership focused on expanding access across Australia's East Coast. This geographic expansion addresses unmet demand in the Australian market where CyberKnife penetration previously remained limited, creating a multi-site growth platform for Accuray in the Asia Pacific region.

 Aerospace And Defence
 Agriculture
 Automotive And Transportation
 Banking And Finance
 Business
 Chemicals And Materials
 Consumer And Retail
 Electronics And Semiconductors
 Food And Beverages
 Machinery & Equipments
 Manufacturing And Construction
 Medical Devices
 Others
 Pharmaceuticals And Healthcare
 Power And Energy
 Sports
 Technology

, By Application (Vascular Malformation, Cancer, Tumor), By End-User (Radiotherapy Centers, Hospitals, Clinics, Ambulatory Surgical Center), Technology Advancements, Reimbursement Landscape, Key Players & Forecast 2025–2034")
, By Application (Vascular Malformation, Cancer, Tumor), By End-User (Radiotherapy Centers, Hospitals, Clinics, Ambulatory Surgical Center), Technology Advancements, Reimbursement Landscape, Key Players & Forecast 2025–2034")
, By Application (Vascular Malformation, Cancer, Tumor), By End-User (Radiotherapy Centers, Hospitals, Clinics, Ambulatory Surgical Center), Technology Advancements, Reimbursement Landscape, Key Players & Forecast 2025–2034")
, By Application (Vascular Malformation, Cancer, Tumor), By End-User (Radiotherapy Centers, Hospitals, Clinics, Ambulatory Surgical Center), Technology Advancements, Reimbursement Landscape, Key Players & Forecast 2025–2034")

