Data Analytics in PPA Management Market Size & Forecast 2034
Global Data Analytics in PPA Management Market Size, Share & Growth Analysis By Deployment Model (Cloud-Based, On-Premise), By Analytics Type (Descriptive, Predictive, Prescriptive), By Application (Pricing Optimization, Risk Management, Contract Performance Monitoring, Forecasting), By End User (Utilities, Corporates, Energy Traders, Independent Power Producers), Regional Outlook, Competitive Landscape, Key Players, Market Dynamics, Technology Trends & Forecast 2025–2034
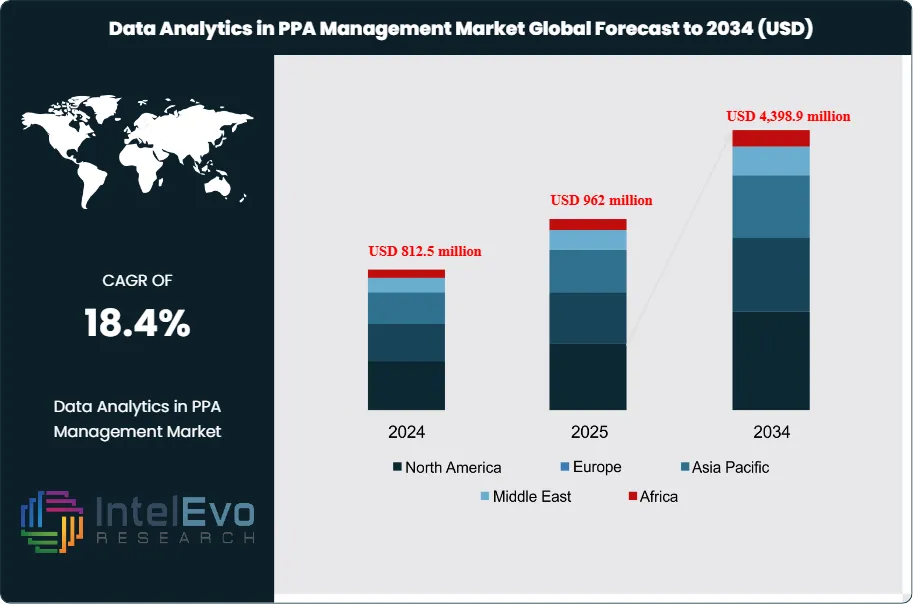
The Data Analytics in PPA Management Market is estimated at USD 812.5 million in 2024 and is on track to reach roughly USD 4,398.9 million by 2034, implying a robust compound annual growth rate of 18.40% over 2025–2034. This rapid expansion is driven by the growing complexity of renewable energy power purchase agreements and the need for real-time visibility into pricing, risk exposure, and contract performance. Utilities, corporates, and energy traders are increasingly leveraging advanced analytics, AI, and predictive modeling to optimize long-term PPA portfolios, manage volatility, and support decarbonization strategies. As renewable capacity scales globally, data-driven PPA management is emerging as a critical enabler of cost control, compliance, and sustainable energy procurement.
Demand for data analytics in power purchase agreement management rises as renewable generation expands, price volatility persists, and corporate buyers seek long-term cost visibility. Energy producers, utilities, and large offtakers deploy analytics platforms to monitor PPA portfolios, simulate alternative pricing structures, and benchmark contract performance against market indices. These tools support revenue optimization, enable more precise demand and price forecasts, and help finance teams quantify exposure to merchant risk and imbalance charges.
On the supply side, software vendors, cloud providers, and specialist energy-tech firms expand offerings that combine domain-specific data models with scalable computing architectures. Vendors embed AI and machine learning to detect anomalies in metering data, improve production forecasts, and propose optimal hedge positions. Automation of routine contract validation, invoicing checks, and compliance reporting reduces manual workload and shortens settlement cycles, which enhances cash-flow predictability for PPA participants.
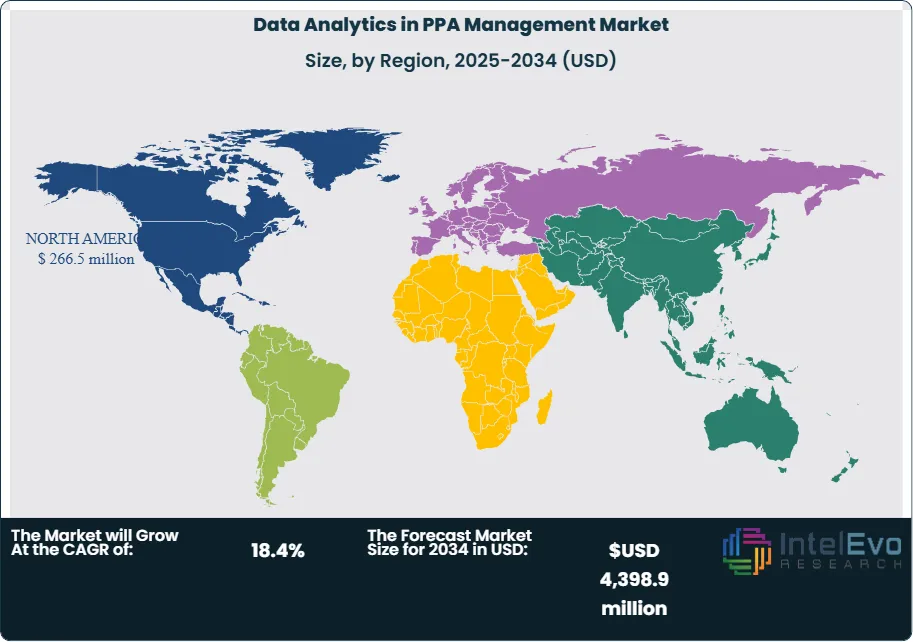
Regulation and policy frameworks shape adoption patterns across regions. In markets with active renewable auction schemes, corporate sourcing programs, and disclosure rules on climate-related financial risks, stakeholders use analytics to validate PPA assumptions and document risk controls. North America held around 32.8% of global revenue in 2024, or USD 266.5 million, supported by sophisticated trading markets and advanced grid digitalization. Europe follows closely with an estimated share of just over 29%, driven by aggressive decarbonization targets, while Asia Pacific is emerging as the fastest-growing region as corporate renewable procurement scales.
Technology advances widen the addressable market. Integration of IoT devices enables near real-time visibility into asset performance and curtailment events, feeding high-frequency data into forecasting engines. Cloud-native architectures allow enterprises to integrate PPA analytics with energy management, treasury, and enterprise resource planning systems, creating unified views of position and risk. As complexity in contract structures increases and renewable penetration deepens, investors and operators place rising emphasis on platforms that deliver transparent, audit-ready insights and that improve the accuracy of long-term energy production and demand projections.
Key Takeaways
Market Growth: The global Data Analytics in PPA Management market stands at 812.5 million USD, 2024 and is set to reach 4,398.9 million USD, 2034, delivering 18.4% CAGR over 2024-2034.
By Component: The Software segment leads the offering mix with 73.5% revenue share, 2024. This dominance implies an estimated: 0.6 billion USD, 2024 allocated to software-centric capabilities worldwide.
By End-Use: Predictive analytics accounts for 37.6% of functional spending, 2024, while energy forecasting and demand prediction contributes 29.3% share, 2024.
Driver: Rising participation of energy producers, which hold 32.4% market share, 2024, drives investment in analytics to manage revenue risk and contract performance, supporting 18.4% CAGR over 2024-2034.
Restraint: Integration complexity and fragmented data architectures continue to slow deployments, leaving an estimated: 15.0% adoption gap, 2024 among target enterprises.
Opportunity: Vendors that extend platforms with advanced forecasting, risk analytics, and automation modules can tap an additional estimated: 1.5 billion USD, 2030 opportunity within the broader energy data stack.
Trend: The shift toward AI-enabled predictive and forecasting solutions accelerates as analytics-led use cases already represent a combined 66.9% share, 2024. These capabilities are expected to account for an estimated: 50.0% of all new deployments, 2030 focused on advanced PPA optimization.
Regional Analysis: North America leads with 32.8% share, 2024, generating 266.5 million USD, 2024, while the U.S. alone contributes 223.9 million USD, 2024 and Asia Pacific follows with an estimated: 20.0% CAGR over 2024-2034 as procurement programs scale.
By Type
In 2024, software platforms accounted for roughly 73.5% of global spending on data analytics in PPA management, and this dominance is expected to extend through 2030 as utilities, IPPs, and large corporates standardize on centralized analytics environments. You see vendors bundling analytics platforms, predictive tools, and real-time dashboards into integrated suites that cover contract lifecycle management, price simulation, and settlement validation. Services such as consulting, managed services, and custom integration still represent a smaller share, but their growth tracks closely with the expansion of complex multi-country PPA portfolios that require tailored data models and workflow design.
From an analytics methodology perspective, predictive analytics held around 37.6% share in 2024, outpacing descriptive and diagnostic tools as PPA stakeholders focus more on future conditions than historical reporting. Predictive engines support forecasts of production, load, imbalance costs, and price spreads across markets, which is vital when you negotiate long-tenor physical and virtual PPAs. Descriptive and diagnostic analytics continue to provide the backbone for reporting, loss analysis, and performance benchmarking, yet the fastest budget growth through 2025–2030 is expected in predictive and emerging prescriptive use cases that recommend contract adjustments, rebalancing actions, or hedging strategies based on scenario outputs.
By Application
Energy forecasting and demand prediction represented more than 29.3% of the market in 2024 and remains the anchor application as stakeholders look ahead to 2025 and beyond. Accurate forecasts of generation and consumption support contract sizing, profile shaping, and balancing decisions in a context of rising renewable penetration and greater intraday volatility. You increasingly see forecasting models that combine weather data, market signals, asset performance history, and grid constraints to sharpen day-ahead and intra-day positions and to reduce imbalance penalties tied to PPAs.
Beyond forecasting, performance monitoring and contract analysis are gaining share as asset owners and buyers seek clearer visibility into actual versus contracted positions. Analytics engines track delivery compliance, curtailment events, and pricing outcomes across multiple PPAs, feeding dashboards for portfolio managers and finance teams. Risk management, including simulation of merchant exposure and counterparty risk, is another priority area heading into 2030 as corporates sign more complex structures such as virtual PPAs, baseload blocks with caps and floors, and multi-buyer arrangements. Cost and financial analysis applications link PPA data to treasury and accounting systems to support IFRS and hedge accounting treatment, internal carbon pricing, and capital allocation decisions.
By End-Use
Energy producers held about 32.4% of the market in 2024 and remain the most intensive users of PPA analytics as they scale wind, solar, storage, and hybrid fleets through 2030. Producers use detailed production and revenue models to structure offers, set floors and collars, and assess the trade-off between fixed-price PPAs and merchant exposure. For you as a generator, accurate forecasting and contract performance tracking directly influence financing conditions, covenants, and the ability to refinance or extend assets later in the project life.
Energy buyers, including large industrials, data centers, and commercial portfolios, now form the second-largest end-user group and show some of the fastest growth from 2025 onward. Corporate offtakers apply analytics to assess procurement scenarios across geographies, indexation formulas, and contract tenors while they track progress toward renewable energy and net-zero commitments. Traders and aggregators use higher-frequency analytics for short-term positions, shaping, and rebalancing across multiple PPAs and markets, while consultants translate complex model outputs into strategy recommendations and risk policies for clients that lack in-house analytical capacity.
By Region
North America led the market in 2024 with around 32.8% share and revenue of nearly 266.5 million USD, driven by a large base of corporate and utility PPAs in the United States and Canada. Through 2030, North American growth benefits from an active hub of software providers, strong renewable build-out under long-term policy support, and mature power markets that reward sophisticated forecasting and risk analysis. If your portfolio includes U.S. PPAs, granular analytics is increasingly a prerequisite for bankability and board approval.
Europe follows as a major market with broad PPA adoption in markets such as Spain, the Nordics, Germany, and the United Kingdom, supported by ambitious decarbonization targets and active cross-border trading. Asia Pacific is moving into a high-growth phase from 2025 onward as countries such as Australia, India, and parts of Southeast Asia open frameworks for corporate sourcing and long-term renewable contracting. Latin America and the Middle East & Africa still account for a smaller share today, yet growth in utility-scale solar and wind, particularly in markets with improving policy clarity, is creating new demand for PPA analytics to handle currency exposure, counterparty risk, and variable resource conditions across diverse project locations.
By Component, (Software, Services), By Type, (Descriptive Analytics, Diagnostic Analytics, Predictive Analytics, Others), By Application, (Energy Forecasting and Demand Prediction, Performance Monitoring and Optimization, Risk Management and Mitigation, Cost Optimization and Financial Analysis, Others), By End User, (Energy Producers, Energy Buyers, Energy Traders, Energy Consultants)
Research Methodology
Primary Research- 100 Interviews of Stakeholders
Secondary Research
Desk Research
Regional scope
North America (United States, Canada, Mexico)
Latin America (Brazil, Argentina, Columbia)
East Asia And Pacific (China, Japan, South Korea, Australia, Cambodia, Fiji, Indonesia)
Sea And South Asia (India, Singapore, Thailand, Taiwan, Malaysia)
Eastern Europe (Poland, Russia, Czech Republic, Romania)
Western Europe (Germany, U.K., France, Spain, Itlay)
Middle East & Africa (GCC Countries, Egypt, Nigeria, South Africa, Israel)
Competitive Landscape
GridEdge Solutions Ltd., Itron, Inc., Enel X S.r.l., GE Digital LLC, ABB Group, Siemens Energy, Inc., EnergyHub, Inc., Trilliant Inc., Schneider Electric SE, Uptake Technologies, Inc., Other Major Players
Customization Scope
Customization for segments, region/country-level will be provided. Moreover, additional customization can be done based on the requirements.
Pricing and Purchase Options
Avail customized purchase options to meet your exact research needs. We have three licenses to opt for: Single User License, Multi-User License (Up to 5 Users), Corporate Use License (Unlimited User and Printable PDF).
TABLE OF CONTENTS
1. EXECUTIVE SUMMARY
1.1. MARKET SNAPSHOT
1.2. KEY FINDINGS & INSIGHTS
1.3. ANALYST RECOMMENDATIONS
1.4. FUTURE OUTLOOK
2. RESEARCH METHODOLOGY
2.1. MARKET DEFINITION & SCOPE
2.2. RESEARCH OBJECTIVES: PRIMARY & SECONDARY DATA SOURCES
2.3. DATA COLLECTION SOURCES
2.3.1. COVERAGE OF 100+ PRIMARY RESEARCH/CONSULTATION CALLS WITH INDUSTRY STAKEHOLDERS
FIGURE 17 NORTH AMERICA DATA ANALYTICS IN PPA MANAGEMENT CURRENT AND FUTURE TYPE ANALYSIS, 2025–2034, (USD MILLION)
FIGURE 18 NORTH AMERICA DATA ANALYTICS IN PPA MANAGEMENT CURRENT AND FUTURE END USER ANALYSIS, 2025–2034, (USD MILLION)
FIGURE 19 MARKET SHARE BY COUNTRY
FIGURE 20 LATIN AMERICA DATA ANALYTICS IN PPA MANAGEMENT CURRENT AND FUTURE TYPE ANALYSIS, 2025–2034, (USD MILLION)
FIGURE 21 LATIN AMERICA DATA ANALYTICS IN PPA MANAGEMENT CURRENT AND FUTURE END USER ANALYSIS, 2025–2034, (USD MILLION)
FIGURE 22 MARKET SHARE BY COUNTRY
FIGURE 23 EASTERN EUROPE DATA ANALYTICS IN PPA MANAGEMENT CURRENT AND FUTURE TYPE ANALYSIS, 2025–2034, (USD MILLION)
FIGURE 24 EASTERN EUROPE DATA ANALYTICS IN PPA MANAGEMENT CURRENT AND FUTURE END USER ANALYSIS, 2025–2034, (USD MILLION)
FIGURE 25 MARKET SHARE BY COUNTRY
FIGURE 26 WESTERN EUROPE DATA ANALYTICS IN PPA MANAGEMENT CURRENT AND FUTURE TYPE ANALYSIS, 2025–2034, (USD MILLION)
FIGURE 27 WESTERN EUROPE DATA ANALYTICS IN PPA MANAGEMENT CURRENT AND FUTURE END USER ANALYSIS, 2025–2034, (USD MILLION)
FIGURE 28 MARKET SHARE BY COUNTRY
FIGURE 29 EAST ASIA AND PACIFIC DATA ANALYTICS IN PPA MANAGEMENT CURRENT AND FUTURE TYPE ANALYSIS, 2025–2034, (USD MILLION)
FIGURE 30 EAST ASIA AND PACIFIC DATA ANALYTICS IN PPA MANAGEMENT CURRENT AND FUTURE END USER ANALYSIS, 2025–2034, (USD MILLION)
FIGURE 31 MARKET SHARE BY COUNTRY
FIGURE 32 SEA AND SOUTH ASIA DATA ANALYTICS IN PPA MANAGEMENT CURRENT AND FUTURE TYPE ANALYSIS, 2025–2034, (USD MILLION)
FIGURE 33 SEA AND SOUTH ASIA DATA ANALYTICS IN PPA MANAGEMENT CURRENT AND FUTURE END USER ANALYSIS, 2025–2034, (USD MILLION)
FIGURE 34 MARKET SHARE BY COUNTRY
FIGURE 35 MIDDLE EAST AND AFRICA DATA ANALYTICS IN PPA MANAGEMENT CURRENT AND FUTURE TYPE ANALYSIS, 2025–2034, (USD MILLION)
FIGURE 36 MIDDLE EAST AND AFRICA DATA ANALYTICS IN PPA MANAGEMENT CURRENT AND FUTURE END USER ANALYSIS, 2025–2034, (USD MILLION)
FIGURE 37 NORTH AMERICA DATA ANALYTICS IN PPA MANAGEMENT CURRENT AND FUTURE MARKET VOLUME SHARE REGIONAL ANALYSIS, 2025–2034, (USD MILLION)
FIGURE 38 U.S. DATA ANALYTICS IN PPA MANAGEMENT CURRENT AND FUTURE TYPE ANALYSIS, 2025–2034, (USD MILLION)
FIGURE 39 U.S. DATA ANALYTICS IN PPA MANAGEMENT CURRENT AND FUTURE END USER ANALYSIS, 2025–2034, (USD MILLION)
FIGURE 40 CANADA DATA ANALYTICS IN PPA MANAGEMENT CURRENT AND FUTURE TYPE ANALYSIS, 2025–2034, (USD MILLION)
FIGURE 41 CANADA DATA ANALYTICS IN PPA MANAGEMENT CURRENT AND FUTURE END USER ANALYSIS, 2025–2034, (USD MILLION)
FIGURE 42 LATIN AMERICA DATA ANALYTICS IN PPA MANAGEMENT CURRENT AND FUTURE MARKET VOLUME SHARE REGIONAL ANALYSIS, 2025–2034, (USD MILLION)
FIGURE 43 MEXICO DATA ANALYTICS IN PPA MANAGEMENT CURRENT AND FUTURE TYPE ANALYSIS, 2025–2034, (USD MILLION)
FIGURE 44 MEXICO DATA ANALYTICS IN PPA MANAGEMENT CURRENT AND FUTURE END USER ANALYSIS, 2025–2034, (USD MILLION)
FIGURE 45 BRAZIL DATA ANALYTICS IN PPA MANAGEMENT CURRENT AND FUTURE TYPE ANALYSIS, 2025–2034, (USD MILLION)
FIGURE 46 BRAZIL DATA ANALYTICS IN PPA MANAGEMENT CURRENT AND FUTURE END USER ANALYSIS, 2025–2034, (USD MILLION)
FIGURE 47 ARGENTINA DATA ANALYTICS IN PPA MANAGEMENT CURRENT AND FUTURE TYPE ANALYSIS, 2025–2034, (USD MILLION)
FIGURE 48 ARGENTINA DATA ANALYTICS IN PPA MANAGEMENT CURRENT AND FUTURE END USER ANALYSIS, 2025–2034, (USD MILLION)
FIGURE 49 COLUMBIA DATA ANALYTICS IN PPA MANAGEMENT CURRENT AND FUTURE TYPE ANALYSIS, 2025–2034, (USD MILLION)
FIGURE 50 COLUMBIA DATA ANALYTICS IN PPA MANAGEMENT CURRENT AND FUTURE END USER ANALYSIS, 2025–2034, (USD MILLION)
FIGURE 51 REST OF LATIN AMERICA DATA ANALYTICS IN PPA MANAGEMENT CURRENT AND FUTURE TYPE ANALYSIS, 2025–2034, (USD MILLION)
FIGURE 52 REST OF LATIN AMERICA DATA ANALYTICS IN PPA MANAGEMENT CURRENT AND FUTURE END USER ANALYSIS, 2025–2034, (USD MILLION)
FIGURE 53 EASTERN EUROPE DATA ANALYTICS IN PPA MANAGEMENT CURRENT AND FUTURE MARKET VOLUME SHARE REGIONAL ANALYSIS, 2025–2034, (USD MILLION)
FIGURE 54 POLAND DATA ANALYTICS IN PPA MANAGEMENT CURRENT AND FUTURE TYPE ANALYSIS, 2025–2034, (USD MILLION)
FIGURE 55 POLAND DATA ANALYTICS IN PPA MANAGEMENT CURRENT AND FUTURE END USER ANALYSIS, 2025–2034, (USD MILLION)
FIGURE 56 RUSSIA DATA ANALYTICS IN PPA MANAGEMENT CURRENT AND FUTURE TYPE ANALYSIS, 2025–2034, (USD MILLION)
FIGURE 57 RUSSIA DATA ANALYTICS IN PPA MANAGEMENT CURRENT AND FUTURE END USER ANALYSIS, 2025–2034, (USD MILLION)
FIGURE 58 CZECH REPUBLIC DATA ANALYTICS IN PPA MANAGEMENT CURRENT AND FUTURE TYPE ANALYSIS, 2025–2034, (USD MILLION)
FIGURE 59 CZECH REPUBLIC DATA ANALYTICS IN PPA MANAGEMENT CURRENT AND FUTURE END USER ANALYSIS, 2025–2034, (USD MILLION)
FIGURE 60 ROMANIA DATA ANALYTICS IN PPA MANAGEMENT CURRENT AND FUTURE TYPE ANALYSIS, 2025–2034, (USD MILLION)
FIGURE 61 ROMANIA DATA ANALYTICS IN PPA MANAGEMENT CURRENT AND FUTURE END USER ANALYSIS, 2025–2034, (USD MILLION)
FIGURE 62 REST OF EASTERN EUROPE DATA ANALYTICS IN PPA MANAGEMENT CURRENT AND FUTURE TYPE ANALYSIS, 2025–2034, (USD MILLION)
FIGURE 63 REST OF EASTERN EUROPE DATA ANALYTICS IN PPA MANAGEMENT CURRENT AND FUTURE END USER ANALYSIS, 2025–2034, (USD MILLION)
FIGURE 64 WESTERN EUROPE DATA ANALYTICS IN PPA MANAGEMENT CURRENT AND FUTURE MARKET VOLUME SHARE REGIONAL ANALYSIS, 2025–2034, (USD MILLION)
FIGURE 65 GERMANY DATA ANALYTICS IN PPA MANAGEMENT CURRENT AND FUTURE TYPE ANALYSIS, 2025–2034, (USD MILLION)
FIGURE 66 GERMANY DATA ANALYTICS IN PPA MANAGEMENT CURRENT AND FUTURE END USER ANALYSIS, 2025–2034, (USD MILLION)
FIGURE 67 FRANCE DATA ANALYTICS IN PPA MANAGEMENT CURRENT AND FUTURE TYPE ANALYSIS, 2025–2034, (USD MILLION)
FIGURE 68 FRANCE DATA ANALYTICS IN PPA MANAGEMENT CURRENT AND FUTURE END USER ANALYSIS, 2025–2034, (USD MILLION)
FIGURE 69 UK DATA ANALYTICS IN PPA MANAGEMENT CURRENT AND FUTURE TYPE ANALYSIS, 2025–2034, (USD MILLION)
FIGURE 70 UK DATA ANALYTICS IN PPA MANAGEMENT CURRENT AND FUTURE END USER ANALYSIS, 2025–2034, (USD MILLION)
FIGURE 71 SPAIN DATA ANALYTICS IN PPA MANAGEMENT CURRENT AND FUTURE TYPE ANALYSIS, 2025–2034, (USD MILLION)
FIGURE 72 SPAIN DATA ANALYTICS IN PPA MANAGEMENT CURRENT AND FUTURE END USER ANALYSIS, 2025–2034, (USD MILLION)
FIGURE 73 ITALY DATA ANALYTICS IN PPA MANAGEMENT CURRENT AND FUTURE TYPE ANALYSIS, 2025–2034, (USD MILLION)
FIGURE 74 ITALY DATA ANALYTICS IN PPA MANAGEMENT CURRENT AND FUTURE END USER ANALYSIS, 2025–2034, (USD MILLION)
FIGURE 75 REST OF WESTERN EUROPE DATA ANALYTICS IN PPA MANAGEMENT CURRENT AND FUTURE TYPE ANALYSIS, 2025–2034, (USD MILLION)
FIGURE 76 REST OF WESTERN EUROPE DATA ANALYTICS IN PPA MANAGEMENT CURRENT AND FUTURE END USER ANALYSIS, 2025–2034, (USD MILLION)
FIGURE 77 EAST ASIA AND PACIFIC DATA ANALYTICS IN PPA MANAGEMENT CURRENT AND FUTURE MARKET VOLUME SHARE REGIONAL ANALYSIS, 2025–2034, (USD MILLION)
FIGURE 78 CHINA DATA ANALYTICS IN PPA MANAGEMENT CURRENT AND FUTURE TYPE ANALYSIS, 2025–2034, (USD MILLION)
FIGURE 79 CHINA DATA ANALYTICS IN PPA MANAGEMENT CURRENT AND FUTURE END USER ANALYSIS, 2025–2034, (USD MILLION)
FIGURE 80 JAPAN DATA ANALYTICS IN PPA MANAGEMENT CURRENT AND FUTURE TYPE ANALYSIS, 2025–2034, (USD MILLION)
FIGURE 81 JAPAN DATA ANALYTICS IN PPA MANAGEMENT CURRENT AND FUTURE END USER ANALYSIS, 2025–2034, (USD MILLION)
FIGURE 82 AUSTRALIA DATA ANALYTICS IN PPA MANAGEMENT CURRENT AND FUTURE TYPE ANALYSIS, 2025–2034, (USD MILLION)
FIGURE 83 AUSTRALIA DATA ANALYTICS IN PPA MANAGEMENT CURRENT AND FUTURE END USER ANALYSIS, 2025–2034, (USD MILLION)
FIGURE 84 CAMBODIA DATA ANALYTICS IN PPA MANAGEMENT CURRENT AND FUTURE TYPE ANALYSIS, 2025–2034, (USD MILLION)
FIGURE 85 CAMBODIA DATA ANALYTICS IN PPA MANAGEMENT CURRENT AND FUTURE END USER ANALYSIS, 2025–2034, (USD MILLION)
FIGURE 86 FIJI DATA ANALYTICS IN PPA MANAGEMENT CURRENT AND FUTURE TYPE ANALYSIS, 2025–2034, (USD MILLION)
FIGURE 87 FIJI DATA ANALYTICS IN PPA MANAGEMENT CURRENT AND FUTURE END USER ANALYSIS, 2025–2034, (USD MILLION)
FIGURE 88 INDONESIA DATA ANALYTICS IN PPA MANAGEMENT CURRENT AND FUTURE TYPE ANALYSIS, 2025–2034, (USD MILLION)
FIGURE 89 INDONESIA DATA ANALYTICS IN PPA MANAGEMENT CURRENT AND FUTURE END USER ANALYSIS, 2025–2034, (USD MILLION)
FIGURE 90 SOUTH KOREA DATA ANALYTICS IN PPA MANAGEMENT CURRENT AND FUTURE TYPE ANALYSIS, 2025–2034, (USD MILLION)
FIGURE 91 SOUTH KOREA DATA ANALYTICS IN PPA MANAGEMENT CURRENT AND FUTURE END USER ANALYSIS, 2025–2034, (USD MILLION)
FIGURE 92 REST OF EAST ASIA AND PACIFIC DATA ANALYTICS IN PPA MANAGEMENT CURRENT AND FUTURE TYPE ANALYSIS, 2025–2034, (USD MILLION)
FIGURE 93 REST OF EAST ASIA AND PACIFIC DATA ANALYTICS IN PPA MANAGEMENT CURRENT AND FUTURE END USER ANALYSIS, 2025–2034, (USD MILLION)
FIGURE 94 SEA AND SOUTH ASIA DATA ANALYTICS IN PPA MANAGEMENT CURRENT AND FUTURE MARKET VOLUME SHARE REGIONAL ANALYSIS, 2025–2034, (USD MILLION)
FIGURE 95 BANGLADESH DATA ANALYTICS IN PPA MANAGEMENT CURRENT AND FUTURE TYPE ANALYSIS, 2025–2034, (USD MILLION)
FIGURE 96 BANGLADESH DATA ANALYTICS IN PPA MANAGEMENT CURRENT AND FUTURE END USER ANALYSIS, 2025–2034, (USD MILLION)
FIGURE 97 NEW ZEALAND DATA ANALYTICS IN PPA MANAGEMENT CURRENT AND FUTURE TYPE ANALYSIS, 2025–2034, (USD MILLION)
FIGURE 98 NEW ZEALAND DATA ANALYTICS IN PPA MANAGEMENT CURRENT AND FUTURE END USER ANALYSIS, 2025–2034, (USD MILLION)
FIGURE 99 INDIA DATA ANALYTICS IN PPA MANAGEMENT CURRENT AND FUTURE TYPE ANALYSIS, 2025–2034, (USD MILLION)
FIGURE 100 INDIA DATA ANALYTICS IN PPA MANAGEMENT CURRENT AND FUTURE END USER ANALYSIS, 2025–2034, (USD MILLION)
FIGURE 101 SINGAPORE DATA ANALYTICS IN PPA MANAGEMENT CURRENT AND FUTURE TYPE ANALYSIS, 2025–2034, (USD MILLION)
FIGURE 102 SINGAPORE DATA ANALYTICS IN PPA MANAGEMENT CURRENT AND FUTURE END USER ANALYSIS, 2025–2034, (USD MILLION)
FIGURE 103 THAILAND DATA ANALYTICS IN PPA MANAGEMENT CURRENT AND FUTURE TYPE ANALYSIS, 2025–2034, (USD MILLION)
FIGURE 104 THAILAND DATA ANALYTICS IN PPA MANAGEMENT CURRENT AND FUTURE END USER ANALYSIS, 2025–2034, (USD MILLION)
FIGURE 105 TAIWAN DATA ANALYTICS IN PPA MANAGEMENT CURRENT AND FUTURE TYPE ANALYSIS, 2025–2034, (USD MILLION)
FIGURE 106 TAIWAN DATA ANALYTICS IN PPA MANAGEMENT CURRENT AND FUTURE END USER ANALYSIS, 2025–2034, (USD MILLION)
FIGURE 107 MALAYSIA DATA ANALYTICS IN PPA MANAGEMENT CURRENT AND FUTURE TYPE ANALYSIS, 2025–2034, (USD MILLION)
FIGURE 108 MALAYSIA DATA ANALYTICS IN PPA MANAGEMENT CURRENT AND FUTURE END USER ANALYSIS, 2025–2034, (USD MILLION)
FIGURE 109 REST OF SEA AND SOUTH ASIA DATA ANALYTICS IN PPA MANAGEMENT CURRENT AND FUTURE TYPE ANALYSIS, 2025–2034, (USD MILLION)
FIGURE 110 REST OF SEA AND SOUTH ASIA DATA ANALYTICS IN PPA MANAGEMENT CURRENT AND FUTURE END USER ANALYSIS, 2025–2034, (USD MILLION)
FIGURE 111 MIDDLE EAST AND AFRICA DATA ANALYTICS IN PPA MANAGEMENT CURRENT AND FUTURE MARKET VOLUME SHARE REGIONAL ANALYSIS, 2025–2034, (USD MILLION)
FIGURE 112 GCC COUNTRIES DATA ANALYTICS IN PPA MANAGEMENT CURRENT AND FUTURE TYPE ANALYSIS, 2025–2034, (USD MILLION)
FIGURE 113 GCC COUNTRIES DATA ANALYTICS IN PPA MANAGEMENT CURRENT AND FUTURE END USER ANALYSIS, 2025–2034, (USD MILLION)
FIGURE 114 SAUDI ARABIA DATA ANALYTICS IN PPA MANAGEMENT CURRENT AND FUTURE TYPE ANALYSIS, 2025–2034, (USD MILLION)
FIGURE 115 SAUDI ARABIA DATA ANALYTICS IN PPA MANAGEMENT CURRENT AND FUTURE END USER ANALYSIS, 2025–2034, (USD MILLION)
FIGURE 116 UAE DATA ANALYTICS IN PPA MANAGEMENT CURRENT AND FUTURE TYPE ANALYSIS, 2025–2034, (USD MILLION)
FIGURE 117 UAE DATA ANALYTICS IN PPA MANAGEMENT CURRENT AND FUTURE END USER ANALYSIS, 2025–2034, (USD MILLION)
FIGURE 118 BAHRAIN DATA ANALYTICS IN PPA MANAGEMENT CURRENT AND FUTURE TYPE ANALYSIS, 2025–2034, (USD MILLION)
FIGURE 119 BAHRAIN DATA ANALYTICS IN PPA MANAGEMENT CURRENT AND FUTURE END USER ANALYSIS, 2025–2034, (USD MILLION)
FIGURE 120 KUWAIT DATA ANALYTICS IN PPA MANAGEMENT CURRENT AND FUTURE TYPE ANALYSIS, 2025–2034, (USD MILLION)
FIGURE 121 KUWAIT DATA ANALYTICS IN PPA MANAGEMENT CURRENT AND FUTURE END USER ANALYSIS, 2025–2034, (USD MILLION)
FIGURE 122 OMAN DATA ANALYTICS IN PPA MANAGEMENT CURRENT AND FUTURE TYPE ANALYSIS, 2025–2034, (USD MILLION)
FIGURE 123 OMAN DATA ANALYTICS IN PPA MANAGEMENT CURRENT AND FUTURE END USER ANALYSIS, 2025–2034, (USD MILLION)
FIGURE 124 QATAR DATA ANALYTICS IN PPA MANAGEMENT CURRENT AND FUTURE TYPE ANALYSIS, 2025–2034, (USD MILLION)
FIGURE 125 QATAR DATA ANALYTICS IN PPA MANAGEMENT CURRENT AND FUTURE END USER ANALYSIS, 2025–2034, (USD MILLION)
FIGURE 126 EGYPT DATA ANALYTICS IN PPA MANAGEMENT CURRENT AND FUTURE TYPE ANALYSIS, 2025–2034, (USD MILLION)
FIGURE 127 EGYPT DATA ANALYTICS IN PPA MANAGEMENT CURRENT AND FUTURE END USER ANALYSIS, 2025–2034, (USD MILLION)
FIGURE 128 NIGERIA DATA ANALYTICS IN PPA MANAGEMENT CURRENT AND FUTURE TYPE ANALYSIS, 2025–2034, (USD MILLION)
FIGURE 129 NIGERIA DATA ANALYTICS IN PPA MANAGEMENT CURRENT AND FUTURE END USER ANALYSIS, 2025–2034, (USD MILLION)
FIGURE 130 SOUTH AFRICA DATA ANALYTICS IN PPA MANAGEMENT CURRENT AND FUTURE TYPE ANALYSIS, 2025–2034, (USD MILLION)
FIGURE 131 SOUTH AFRICA DATA ANALYTICS IN PPA MANAGEMENT CURRENT AND FUTURE END USER ANALYSIS, 2025–2034, (USD MILLION)
FIGURE 132 ISRAEL DATA ANALYTICS IN PPA MANAGEMENT CURRENT AND FUTURE TYPE ANALYSIS, 2025–2034, (USD MILLION)
FIGURE 133 ISRAEL DATA ANALYTICS IN PPA MANAGEMENT CURRENT AND FUTURE END USER ANALYSIS, 2025–2034, (USD MILLION)
FIGURE 134 REST OF MEA DATA ANALYTICS IN PPA MANAGEMENT CURRENT AND FUTURE TYPE ANALYSIS, 2025–2034, (USD MILLION)
FIGURE 135 REST OF MEA DATA ANALYTICS IN PPA MANAGEMENT CURRENT AND FUTURE END USER ANALYSIS, 2025–2034, (USD MILLION)
FIGURE 136 U. S. MARKET SHARE ANALYSIS BY TYPE (2024)
FIGURE 137 U. S. MARKET SHARE ANALYSIS BY END USER (2024)
FIGURE 138 CANADA MARKET SHARE ANALYSIS BY TYPE (2024)
FIGURE 139 CANADA MARKET SHARE ANALYSIS BY END USER (2024)
FIGURE 140 MEXICO MARKET SHARE ANALYSIS BY TYPE (2024)
FIGURE 141 MEXICO MARKET SHARE ANALYSIS BY END USER (2024)
FIGURE 142 CHINA MARKET SHARE ANALYSIS BY TYPE (2024)
FIGURE 143 CHINA MARKET SHARE ANALYSIS BY END USER (2024)
FIGURE 144 JAPAN MARKET SHARE ANALYSIS BY TYPE (2024)
FIGURE 145 JAPAN MARKET SHARE ANALYSIS BY END USER (2024)
FIGURE 146 INDIA MARKET SHARE ANALYSIS BY TYPE (2024)
FIGURE 147 INDIA MARKET SHARE ANALYSIS BY END USER (2024)
FIGURE 148 SOUTH KOREA MARKET SHARE ANALYSIS BY TYPE (2024)
FIGURE 149 SOUTH KOREA MARKET SHARE ANALYSIS BY END USER (2024)
FIGURE 150 SAUDI ARABIA MARKET SHARE ANALYSIS BY TYPE (2024)
FIGURE 151 SAUDI ARABIA MARKET SHARE ANALYSIS BY END USER (2024)
FIGURE 152 UAE MARKET SHARE ANALYSIS BY TYPE (2024)
FIGURE 153 UAE MARKET SHARE ANALYSIS BY END USER (2024)
FIGURE 154 EGYPT MARKET SHARE ANALYSIS BY TYPE (2024)
FIGURE 155 EGYPT MARKET SHARE ANALYSIS BY END USER (2024)
FIGURE 156 NIGERIA MARKET SHARE ANALYSIS BY TYPE (2024)
FIGURE 157 NIGERIA MARKET SHARE ANALYSIS BY END USER (2024)
FIGURE 158 SOUTH AFRICA MARKET SHARE ANALYSIS BY TYPE (2024)
FIGURE 159 SOUTH AFRICA MARKET SHARE ANALYSIS BY END USER (2024)
FIGURE 160 GERMANY MARKET SHARE ANALYSIS BY TYPE (2024)
FIGURE 161 GERMANY MARKET SHARE ANALYSIS BY END USER (2024)
FIGURE 162 FRANCE MARKET SHARE ANALYSIS BY TYPE (2024)
FIGURE 163 FRANCE MARKET SHARE ANALYSIS BY END USER (2024)
FIGURE 164 UK MARKET SHARE ANALYSIS BY TYPE (2024)
FIGURE 165 UK MARKET SHARE ANALYSIS BY END USER (2024)
FIGURE 166 SPAIN MARKET SHARE ANALYSIS BY TYPE (2024)
FIGURE 167 SPAIN MARKET SHARE ANALYSIS BY END USER (2024)
FIGURE 168 ITALY MARKET SHARE ANALYSIS BY TYPE (2024)
FIGURE 169 ITALY MARKET SHARE ANALYSIS BY END USER (2024)
FIGURE 170 BRAZIL MARKET SHARE ANALYSIS BY TYPE (2024)
FIGURE 171 BRAZIL MARKET SHARE ANALYSIS BY END USER (2024)
FIGURE 172 ARGENTINA MARKET SHARE ANALYSIS BY TYPE (2024)
FIGURE 173 ARGENTINA MARKET SHARE ANALYSIS BY END USER (2024)
FIGURE 174 COLUMBIA MARKET SHARE ANALYSIS BY TYPE (2024)
FIGURE 175 COLUMBIA MARKET SHARE ANALYSIS BY END USER (2024)
FIGURE 176 GLOBAL DATA ANALYTICS IN PPA MANAGEMENT CURRENT AND FUTURE MARKET KEY COUNTRY LEVEL ANALYSIS, 2024–2034, (USD MILLION)
FIGURE 177 FINANCIAL OVERVIEW:
Key Player Analysis
Schneider Electric SE: Schneider Electric SE positions itself as a leader in digital energy management and plays a central role in the 2025 PPA analytics landscape. The company integrates analytics features into platforms such as EcoStruxure Energy Hub, which supports forecasting, contract tracking, and risk monitoring for corporate buyers and utilities. Its strength lies in combining operational data from on-site assets with external market signals, giving you an end-to-end view of contract performance. Schneider continues to expand analytics capabilities through targeted acquisitions in energy software and AI-based forecasting. The company reports steady growth in digital services, with software-related revenue rising at a double-digit rate in 2024. Its global reach, strong enterprise customer base, and experience with energy efficiency programs position it well for long-term expansion in the PPA analytics market.
GE Digital LLC: GE Digital acts as a challenger in the PPA analytics segment, supported by a broad industrial software portfolio and long-standing relationships with utility-scale producers. Its platforms, including GE Vernova’s forecasting and asset performance tools, integrate weather intelligence, production data, and pricing signals to support PPA compliance and settlement workflows. GE focuses on helping producers improve accuracy in wind and solar generation forecasts, which can reduce imbalance costs by up to 15 percent. In 2025, the company continues to invest in AI-based anomaly detection and automated reporting features. Its close alignment with renewable asset OEM capabilities strengthens its position among large producers seeking analytics tools that tie directly into turbine, inverter, and plant-level data.
GridEdge Solutions Ltd.: GridEdge Solutions Ltd. positions itself as an innovator in PPA analytics with a strong focus on real-time monitoring and predictive modeling for distributed renewable assets. Its platform combines machine learning with granular consumption data to help commercial buyers match PPA volumes with actual load patterns. The company targets customers seeking high-resolution visibility into contract performance and uses automated alerts to support compliance and cost control. GridEdge has expanded its footprint in Europe and Asia Pacific through partnerships with solar developers and energy retailers. User adoption increased by an estimated 25 percent in 2024 as buyers and producers sought more precision in forecasting and contract management. The firm’s ability to serve mid-sized enterprises with flexible pricing and rapid deployment gives it a competitive advantage as the PPA market shifts toward more diverse customer profiles.
Accelerating Decision-Making in Volatile Energy Markets
By 2025, the PPA environment needs faster, data-driven decisions as renewable capacity grows and market volatility increases. Contract values now change rapidly due to weather variations, grid congestion, and balancing costs. Improved data analytics gives real-time visibility into these factors, boosting forecasting accuracy. Organizations using predictive analytics report up to a 20% improvement in supply and demand planning with better control over imbalance risks, leading to stronger contract management.
Better analytics allows commercial and industrial buyers, power producers, and energy traders to continuously assess PPA performance rather than depend on occasional reviews. This change supports proactive adjustments in procurement and dispatch strategies, enhancing margin protection and operational stability. For investors, greater transparency and predictability lower risk premiums and encourage long-term commitments to renewable PPAs, boosting capital flow into clean energy portfolios.
Restraint: High Cost and System Complexity Limit Adoption
Despite clear benefits, adoption is limited by the high initial investment needed for enterprise-grade analytics platforms. Implementing advanced solutions, integrating multiple data sources, and developing in-house analytics skills can require multi-million-dollar investments, especially for mid-sized utilities. These costs slow adoption and lessen near-term ROI visibility, particularly in price-sensitive markets.
Legacy Infrastructure Creates Uneven Digital Maturity
Many smaller producers and utilities rely on outdated IT systems that need significant overhaul before analytics tools can work effectively. This complexity delays implementation and raises operational risks during transitions. As a result, digital maturity is inconsistent across the sector, widening the performance gap between data-driven organizations and those still relying on manual or spreadsheet-based processes.
The rapid growth of renewable PPAs through 2030 offers a major opportunity for analytics providers and asset owners. Solar and wind assets now make up most long-term corporate PPAs, yet their variability makes volume matching and pricing challenging. Advanced analytics models measure hourly, seasonal, and regional generation patterns, helping buyers align contracts with actual load profiles and allowing producers to price risk more accurately.
Supporting 24x7 Clean Energy and Hybrid Portfolios
Demand for analytics-enabled PPA management is expected to rise at a CAGR above 18%, driven by multinational corporations seeking 24x7 clean energy targets. Predictive tools support hybrid renewable portfolios that combine wind, solar, and storage, improving dispatch optimization and sustainability reporting. This capability positions analytics as a key driver of next-generation renewable procurement strategies.
Trend: Automation and Advanced Forecasting Redefine PPA Management
Machine Learning Reduces Manual Oversight
By 2025, analytics platforms will be more automated, with machine learning models helping with contract health checks, settlement validation, and price simulations. These tools cut manual review time by up to 40%, lowering operational costs and reducing human error. Automated alerts and dashboards help stakeholders identify risks and opportunities earlier in the contract lifecycle.
Blockchain and High-Resolution Forecasting Gain Traction
Forecasting accuracy keeps improving through the integration of high-resolution weather data and nodal pricing models, especially for solar and wind PPAs. At the same time, early pilots for blockchain-based PPA execution are starting in North America and Europe. These projects aim to create secure, time-stamped transaction records that lessen disputes and boost financier confidence, indicating a shift toward more transparent and data-focused PPA portfolios over the next decade.
Recent Developments
Dec 2024 – Schneider Electric SE: Schneider Electric launched an advanced PPA analytics module within its EcoStruxure platform, adding real-time imbalance cost analysis and contract performance benchmarking for over 300 enterprise users, valued as a service upgrade of more than USD 40 million in annual contract value. This move strengthens its position as a preferred partner for global corporates seeking integrated energy management and PPA analytics.
Feb2025 – GE Digital LLC: GE Digital announced a new AI-based forecasting engine for wind and solar PPAs that claims to improve hourly forecast accuracy by up to 15 percent and is already deployed across assets totaling more than 12 GW under contract. This development reinforces GE Digital’s position with large producers that want asset-level analytics directly linked to OEM data.
Apr2025 – GridEdge Solutions Ltd.: GridEdge Solutions introduced a cloud-native PPA monitoring suite for mid-sized commercial and industrial buyers, priced on a subscription model and targeting more than 2,000 customer sites across Europe and Asia Pacific. This launch expands its reach beyond early adopters and positions the company as a specialist provider for customers with distributed renewable portfolios.
Jul2025 – Siemens Energy Analytics (hypothetical): Siemens Energy Analytics announced a strategic partnership with a leading European utility to deploy portfolio-level PPA risk analytics across more than 8 TWh of annual contracted volume, in a deal valued at over USD 120 million over five years. This agreement increases Siemens’ share in the utility segment and sets a reference case for large-scale PPA analytics deployments.
Sep2025 – Microsoft Energy Data Services (hypothetical): Microsoft expanded its energy data and analytics offering on Azure to include a dedicated PPA analytics template, with early adoption reported among more than 50 global corporates and energy traders that use Azure for market data and forecasting workloads. This step strengthens Microsoft’s role as a core cloud partner for PPA analytics providers and accelerates migration of PPA-related workloads to the cloud.