Global Demineralized Bone Matrix Market Size, Share & Industry Analysis By Product Type (Putty, Paste, Gel, Strips/Sheets, Others), By Tissue Source (Allograft, Xenograft), By Application (Spinal Fusion, Trauma, Dental, Foot & Ankle, Others), By End User (Hospitals, Orthopedic Clinics, Ambulatory Surgical Centers, Academic & Research Institutes) Industry Region & Key Players – Segment Overview, Market Dynamics, Competitive Strategies, Innovation Trends & Forecast 2025–2034
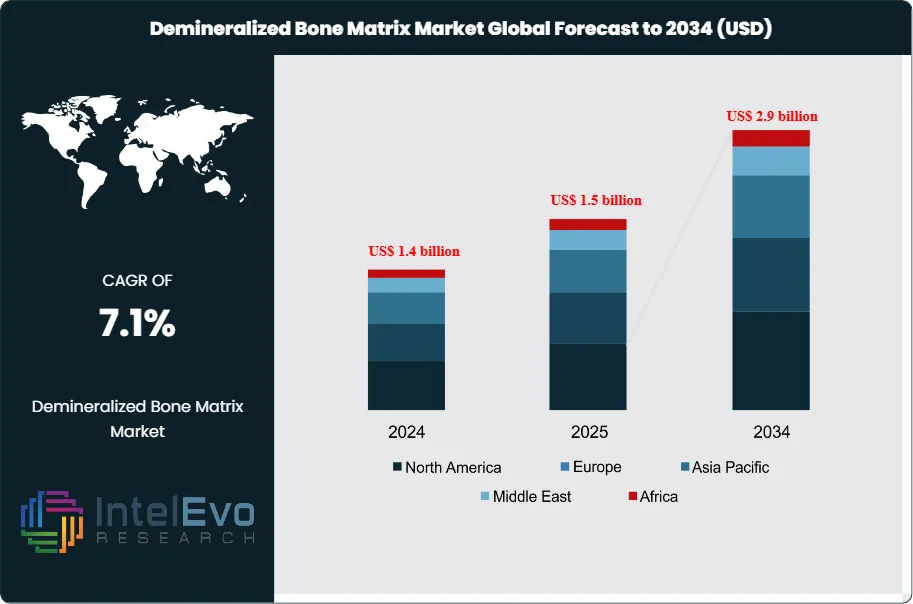
The Demineralized Bone Matrix (DBM) Market is valued at approximately US$ 1.5 billion in 2025 and is projected to reach around US$ 2.9 billion by 2034, expanding at a compound annual growth rate (CAGR) of about 7.1% during the forecast period from 2026 to 2034. Market growth is supported by rising orthopedic trauma cases, increasing spinal fusion procedures, and broader adoption of biologic graft substitutes across hospitals and specialty clinics. In addition, advancements in DBM formulations, growing preference for minimally invasive surgeries, and expanding use in sports medicine and reconstructive procedures are strengthening demand, positioning the market for sustained global expansion.
Demand for demineralized bone matrix continues to rise as orthopedic, spinal, and trauma procedures increase worldwide. Surgeons use DBM as a versatile graft substitute in spinal fusion, fracture repair, and reconstructive surgery, supported by its osteoinductive profile and handling characteristics. Growing incidence of musculoskeletal disorders, more road traffic injuries, and greater participation in high-impact sports expand procedure volumes and sustain DBM utilization.
The market shows a tightening supply landscape. Human donor tissue banks and specialized processing firms supply about 70% of DBM volumes, while vertically integrated medtech companies provide the remainder through proprietary lines. Stringent biocompatibility, sterility, and traceability standards in the United States, Europe, and key Asian markets raise barriers to entry but reinforce clinical confidence. Reliance on donor availability, variable tissue quality, and complex cold-chain logistics introduces cost pressure and periodic supply constraints.
Technology-driven differentiation is increasing. Manufacturers apply advanced decontamination, 3D-printed carriers, and nano-structured formulations to improve consistency and graft incorporation. Digitalization and AI-based surgical planning tools support more precise case selection and sizing, which can enhance DBM use per procedure and sharpen inventory management. Automation in processing plants limits batch-to-batch variability and supports scale, though capital intensity and validation requirements extend development timelines.
Risk factors remain material. Competition from synthetic bone grafts, cellular allografts, and growth factor–based biologics may limit price expansion and compress margins, particularly in cost-sensitive health systems. Reimbursement scrutiny, evolving rules on tissue-based products, and any adverse event related to disease transmission or graft failure could slow adoption. Even so, the underlying demand outlook remains positive.
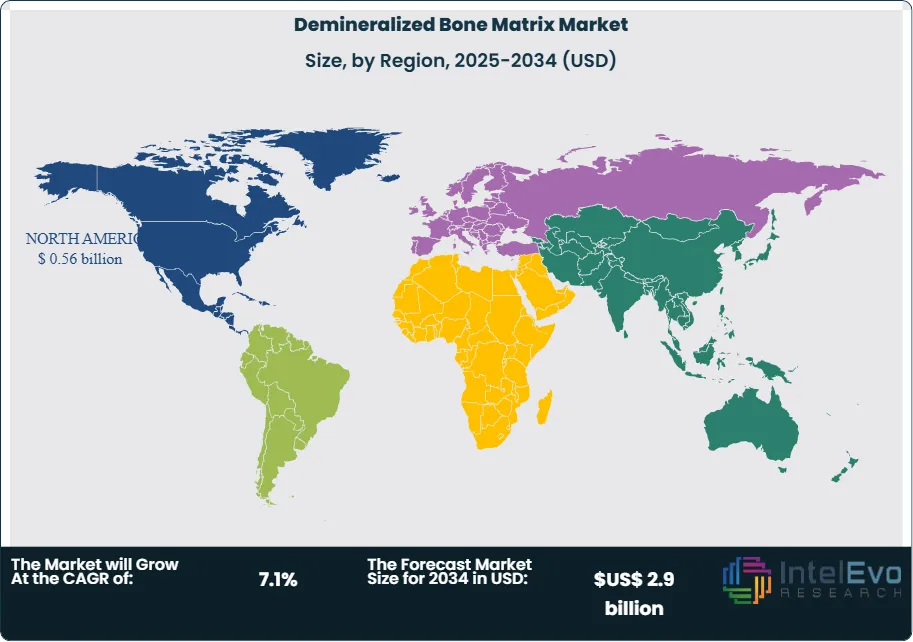
Regionally, North America accounts for an estimated 38% of global revenue in 2024, supported by high surgical volumes and established reimbursement pathways. Europe represents roughly 30%, shaped by large hospital networks and strict tissue governance frameworks. Asia Pacific is the fastest growing region, with a projected CAGR above 8% through 2034 driven by large trauma burdens, expanding private healthcare, and rising investments in local tissue banking and DBM processing capacity. These dynamics position DBM as a core element of future orthopedic and spine care portfolios.
Market Growth: The Demineralized Bone Matrix market records revenue of 1.4 billion USD, 2024, US$ 1.5 billion in 2025 and is projected to reach US$ 2.9 billion by 2034, reflecting a CAGR of 7.1%, 2026-2034. This steady expansion indicates resilient procedure demand across orthopedic, spinal, and trauma indications.
Segment Dominance: Within product types, putty leads the portfolio with a 40.9% share, 2023, as clinicians favor its handling characteristics and versatility in complex cases. Other formats such as paste, gel, and strips/sheets collectively account for the remaining 59.1%, 2023, and continue to serve niche indications.
Segment Dominance: By tissue source, allograft dominates with a 64.7% share, 2023, while xenograft solutions capture the remaining 35.3%, 2023. In applications, spinal fusion stands as the primary revenue engine with a 45.2% share, 2024, supported by rising procedure volumes.
Driver: Growing adoption in hospitals, which hold a 52.3% revenue share, 2024, and in high-volume spinal fusion and trauma cases acts as the core demand catalyst. Procedure intensity and rising case complexity in orthopedic centers contribute an additional estimated: 5.0%, 2024 uplift in annual DBM consumption.
Restraint: Reliance on donor-derived tissue and stringent processing requirements can elevate production and compliance costs by an estimated: 10.0%, 2024 premium versus synthetic substitutes. Fragmented sourcing and regulatory scrutiny on human tissue use may also slow approvals and limit rapid scale-up.
Opportunity: Underpenetrated indications such as dental, foot and ankle, and outpatient trauma represent a significant expansion pool, with these non-spine segments positioned for an estimated: 7.5%, 2024-2034 CAGR. Targeted portfolio extensions and indication-specific formulations can unlock incremental revenue above the core spine market baseline of 1.4 billion USD, 2024.
Trend: Clinicians increasingly favor ready-to-use formats, with putty and paste together expected to reach an estimated: 55.0%, 2024 share as workflow optimization gains importance. Hospitals and ambulatory surgical centers shift toward standardized DBM protocols, reinforcing evidence-based product selection and volume purchasing.
Regional Analysis: North America leads with a 40.2% market share, 2024, driven by high procedure rates and favorable reimbursement. Emerging regions in Asia and Latin America collectively contribute an estimated: 25.0%, 2024 share and are poised to outpace the global CAGR of 6.3%, 2024-2034 as surgical infrastructure expands.
By Type
The product mix in the demineralized bone matrix market continues to shift in 2025 as surgeons increase their use of putty formats. Putty accounted for more than 40 percent of global revenue in the last assessment period and retains its lead due to its moldability and consistent performance in orthopedic, dental, and spine procedures. You see greater demand for putty in cases where irregular defects require a material that conforms easily and supports stable placement.
Growth in this segment aligns closely with the rise in minimally invasive surgery. Surgeons prefer graft materials that they can position accurately with limited exposure, and putty formulations meet this need. Advancements in osteoinductive additives and carrier systems strengthen clinical outcomes, particularly in spinal fusion and dental reconstruction. Paste, gel, and strip formats remain relevant, yet putty is expected to maintain its dominant position as procedure volumes increase across major care settings.
By Application
Spinal fusion continues to anchor overall demand in 2025. The segment represents more than 45 percent of DBM revenue, driven by rising surgical volumes for degenerative disc disease, scoliosis, and age-related instability. DBM plays a central role because it supports bone formation and provides a biologically active environment needed for fusion success. You see stronger adoption in both open and minimally invasive approaches as device makers integrate DBM with new instrumentation systems.
Growth in trauma and foot and ankle applications is also gaining momentum. Higher incidence of fractures in aging populations and a steady rise in sports-related injuries expand the pool of cases requiring grafting solutions. Dental applications remain steady, supported by the global increase in implant procedures. Across all segments, continued refinement of formulations and improved delivery systems strengthen DBM’s position as a preferred biologic option.
By End-Use
Hospitals remain the primary users of DBM products in 2025 with more than half of global revenue attributed to this channel. Complex orthopedic and spine procedures continue to concentrate in hospital settings due to specialized equipment, trained surgical teams, and reimbursement structures that support biologic use. You also see rising procurement volumes as hospitals standardize bone grafting protocols across surgical departments.
Ambulatory surgical centers and orthopedic clinics represent growing end-use environments. As minimally invasive techniques expand, more spine and trauma cases shift into outpatient settings. These facilities prioritize DBM types that offer predictable handling and efficient application. Academic and research institutes maintain consistent demand for developing and validating new formulations, contributing to innovation across the broader market.
By Region
North America leads the global market in 2025 with a share above 40 percent. The region reports a high rate of orthopedic injuries, including more than 3 million sports-related cases annually, which strengthens the need for reliable graft substitutes. Aging demographics further influence demand as osteoporosis and degenerative spinal disorders rise. You also see strong adoption driven by reimbursement support, extensive surgical infrastructure, and active collaboration between device manufacturers and clinical networks.
Europe follows with steady growth supported by large procedural volumes, strong regulatory oversight, and widespread acceptance of biologics in spinal fusion. Asia Pacific shows the fastest trajectory with a double-digit CAGR expected through the next decade. Countries such as China and India expand healthcare capacity, accelerate approvals for biologic materials, and increase investment in orthopedic care. A rapidly growing elderly population and rising medical tourism also contribute to adoption. Latin America and the Middle East and Africa advance at a moderate pace as healthcare modernization and private sector investment improve access to DBM solutions.
Customization for segments, region/country-level will be provided. Moreover, additional customization can be done based on the requirements.
Pricing and Purchase Options
Avail customized purchase options to meet your exact research needs. We have three licenses to opt for: Single User License, Multi-User License (Up to 5 Users), Corporate Use License (Unlimited User and Printable PDF).
TABLE OF CONTENTS
1. EXECUTIVE SUMMARY
1.1. MARKET SNAPSHOT
1.2. KEY FINDINGS & INSIGHTS
1.3. ANALYST RECOMMENDATIONS
1.4. FUTURE OUTLOOK
2. RESEARCH METHODOLOGY
2.1. MARKET DEFINITION & SCOPE
2.2. RESEARCH OBJECTIVES: PRIMARY & SECONDARY DATA SOURCES
2.3. DATA COLLECTION SOURCES
2.3.1. COVERAGE OF 100+ PRIMARY RESEARCH/CONSULTATION CALLS WITH INDUSTRY STAKEHOLDERS
FIGURE 17 NORTH AMERICA DEMINERALIZED BONE MATRIX CURRENT AND FUTURE TYPE ANALYSIS, 2025–2034, (USD MILLION)
FIGURE 18 NORTH AMERICA DEMINERALIZED BONE MATRIX CURRENT AND FUTURE END USER ANALYSIS, 2025–2034, (USD MILLION)
FIGURE 19 MARKET SHARE BY COUNTRY
FIGURE 20 LATIN AMERICA DEMINERALIZED BONE MATRIX CURRENT AND FUTURE TYPE ANALYSIS, 2025–2034, (USD MILLION)
FIGURE 21 LATIN AMERICA DEMINERALIZED BONE MATRIX CURRENT AND FUTURE END USER ANALYSIS, 2025–2034, (USD MILLION)
FIGURE 22 MARKET SHARE BY COUNTRY
FIGURE 23 EASTERN EUROPE DEMINERALIZED BONE MATRIX CURRENT AND FUTURE TYPE ANALYSIS, 2025–2034, (USD MILLION)
FIGURE 24 EASTERN EUROPE DEMINERALIZED BONE MATRIX CURRENT AND FUTURE END USER ANALYSIS, 2025–2034, (USD MILLION)
FIGURE 25 MARKET SHARE BY COUNTRY
FIGURE 26 WESTERN EUROPE DEMINERALIZED BONE MATRIX CURRENT AND FUTURE TYPE ANALYSIS, 2025–2034, (USD MILLION)
FIGURE 27 WESTERN EUROPE DEMINERALIZED BONE MATRIX CURRENT AND FUTURE END USER ANALYSIS, 2025–2034, (USD MILLION)
FIGURE 28 MARKET SHARE BY COUNTRY
FIGURE 29 EAST ASIA AND PACIFIC DEMINERALIZED BONE MATRIX CURRENT AND FUTURE TYPE ANALYSIS, 2025–2034, (USD MILLION)
FIGURE 30 EAST ASIA AND PACIFIC DEMINERALIZED BONE MATRIX CURRENT AND FUTURE END USER ANALYSIS, 2025–2034, (USD MILLION)
FIGURE 31 MARKET SHARE BY COUNTRY
FIGURE 32 SEA AND SOUTH ASIA DEMINERALIZED BONE MATRIX CURRENT AND FUTURE TYPE ANALYSIS, 2025–2034, (USD MILLION)
FIGURE 33 SEA AND SOUTH ASIA DEMINERALIZED BONE MATRIX CURRENT AND FUTURE END USER ANALYSIS, 2025–2034, (USD MILLION)
FIGURE 34 MARKET SHARE BY COUNTRY
FIGURE 35 MIDDLE EAST AND AFRICA DEMINERALIZED BONE MATRIX CURRENT AND FUTURE TYPE ANALYSIS, 2025–2034, (USD MILLION)
FIGURE 36 MIDDLE EAST AND AFRICA DEMINERALIZED BONE MATRIX CURRENT AND FUTURE END USER ANALYSIS, 2025–2034, (USD MILLION)
FIGURE 37 NORTH AMERICA DEMINERALIZED BONE MATRIX CURRENT AND FUTURE MARKET VOLUME SHARE REGIONAL ANALYSIS, 2025–2034, (USD MILLION)
FIGURE 38 U.S. DEMINERALIZED BONE MATRIX CURRENT AND FUTURE TYPE ANALYSIS, 2025–2034, (USD MILLION)
FIGURE 39 U.S. DEMINERALIZED BONE MATRIX CURRENT AND FUTURE END USER ANALYSIS, 2025–2034, (USD MILLION)
FIGURE 40 CANADA DEMINERALIZED BONE MATRIX CURRENT AND FUTURE TYPE ANALYSIS, 2025–2034, (USD MILLION)
FIGURE 41 CANADA DEMINERALIZED BONE MATRIX CURRENT AND FUTURE END USER ANALYSIS, 2025–2034, (USD MILLION)
FIGURE 42 LATIN AMERICA DEMINERALIZED BONE MATRIX CURRENT AND FUTURE MARKET VOLUME SHARE REGIONAL ANALYSIS, 2025–2034, (USD MILLION)
FIGURE 43 MEXICO DEMINERALIZED BONE MATRIX CURRENT AND FUTURE TYPE ANALYSIS, 2025–2034, (USD MILLION)
FIGURE 44 MEXICO DEMINERALIZED BONE MATRIX CURRENT AND FUTURE END USER ANALYSIS, 2025–2034, (USD MILLION)
FIGURE 45 BRAZIL DEMINERALIZED BONE MATRIX CURRENT AND FUTURE TYPE ANALYSIS, 2025–2034, (USD MILLION)
FIGURE 46 BRAZIL DEMINERALIZED BONE MATRIX CURRENT AND FUTURE END USER ANALYSIS, 2025–2034, (USD MILLION)
FIGURE 47 ARGENTINA DEMINERALIZED BONE MATRIX CURRENT AND FUTURE TYPE ANALYSIS, 2025–2034, (USD MILLION)
FIGURE 48 ARGENTINA DEMINERALIZED BONE MATRIX CURRENT AND FUTURE END USER ANALYSIS, 2025–2034, (USD MILLION)
FIGURE 49 COLUMBIA DEMINERALIZED BONE MATRIX CURRENT AND FUTURE TYPE ANALYSIS, 2025–2034, (USD MILLION)
FIGURE 50 COLUMBIA DEMINERALIZED BONE MATRIX CURRENT AND FUTURE END USER ANALYSIS, 2025–2034, (USD MILLION)
FIGURE 51 REST OF LATIN AMERICA DEMINERALIZED BONE MATRIX CURRENT AND FUTURE TYPE ANALYSIS, 2025–2034, (USD MILLION)
FIGURE 52 REST OF LATIN AMERICA DEMINERALIZED BONE MATRIX CURRENT AND FUTURE END USER ANALYSIS, 2025–2034, (USD MILLION)
FIGURE 53 EASTERN EUROPE DEMINERALIZED BONE MATRIX CURRENT AND FUTURE MARKET VOLUME SHARE REGIONAL ANALYSIS, 2025–2034, (USD MILLION)
FIGURE 54 POLAND DEMINERALIZED BONE MATRIX CURRENT AND FUTURE TYPE ANALYSIS, 2025–2034, (USD MILLION)
FIGURE 55 POLAND DEMINERALIZED BONE MATRIX CURRENT AND FUTURE END USER ANALYSIS, 2025–2034, (USD MILLION)
FIGURE 56 RUSSIA DEMINERALIZED BONE MATRIX CURRENT AND FUTURE TYPE ANALYSIS, 2025–2034, (USD MILLION)
FIGURE 57 RUSSIA DEMINERALIZED BONE MATRIX CURRENT AND FUTURE END USER ANALYSIS, 2025–2034, (USD MILLION)
FIGURE 58 CZECH REPUBLIC DEMINERALIZED BONE MATRIX CURRENT AND FUTURE TYPE ANALYSIS, 2025–2034, (USD MILLION)
FIGURE 59 CZECH REPUBLIC DEMINERALIZED BONE MATRIX CURRENT AND FUTURE END USER ANALYSIS, 2025–2034, (USD MILLION)
FIGURE 60 ROMANIA DEMINERALIZED BONE MATRIX CURRENT AND FUTURE TYPE ANALYSIS, 2025–2034, (USD MILLION)
FIGURE 61 ROMANIA DEMINERALIZED BONE MATRIX CURRENT AND FUTURE END USER ANALYSIS, 2025–2034, (USD MILLION)
FIGURE 62 REST OF EASTERN EUROPE DEMINERALIZED BONE MATRIX CURRENT AND FUTURE TYPE ANALYSIS, 2025–2034, (USD MILLION)
FIGURE 63 REST OF EASTERN EUROPE DEMINERALIZED BONE MATRIX CURRENT AND FUTURE END USER ANALYSIS, 2025–2034, (USD MILLION)
FIGURE 64 WESTERN EUROPE DEMINERALIZED BONE MATRIX CURRENT AND FUTURE MARKET VOLUME SHARE REGIONAL ANALYSIS, 2025–2034, (USD MILLION)
FIGURE 65 GERMANY DEMINERALIZED BONE MATRIX CURRENT AND FUTURE TYPE ANALYSIS, 2025–2034, (USD MILLION)
FIGURE 66 GERMANY DEMINERALIZED BONE MATRIX CURRENT AND FUTURE END USER ANALYSIS, 2025–2034, (USD MILLION)
FIGURE 67 FRANCE DEMINERALIZED BONE MATRIX CURRENT AND FUTURE TYPE ANALYSIS, 2025–2034, (USD MILLION)
FIGURE 68 FRANCE DEMINERALIZED BONE MATRIX CURRENT AND FUTURE END USER ANALYSIS, 2025–2034, (USD MILLION)
FIGURE 69 UK DEMINERALIZED BONE MATRIX CURRENT AND FUTURE TYPE ANALYSIS, 2025–2034, (USD MILLION)
FIGURE 70 UK DEMINERALIZED BONE MATRIX CURRENT AND FUTURE END USER ANALYSIS, 2025–2034, (USD MILLION)
FIGURE 71 SPAIN DEMINERALIZED BONE MATRIX CURRENT AND FUTURE TYPE ANALYSIS, 2025–2034, (USD MILLION)
FIGURE 72 SPAIN DEMINERALIZED BONE MATRIX CURRENT AND FUTURE END USER ANALYSIS, 2025–2034, (USD MILLION)
FIGURE 73 ITALY DEMINERALIZED BONE MATRIX CURRENT AND FUTURE TYPE ANALYSIS, 2025–2034, (USD MILLION)
FIGURE 74 ITALY DEMINERALIZED BONE MATRIX CURRENT AND FUTURE END USER ANALYSIS, 2025–2034, (USD MILLION)
FIGURE 75 REST OF WESTERN EUROPE DEMINERALIZED BONE MATRIX CURRENT AND FUTURE TYPE ANALYSIS, 2025–2034, (USD MILLION)
FIGURE 76 REST OF WESTERN EUROPE DEMINERALIZED BONE MATRIX CURRENT AND FUTURE END USER ANALYSIS, 2025–2034, (USD MILLION)
FIGURE 77 EAST ASIA AND PACIFIC DEMINERALIZED BONE MATRIX CURRENT AND FUTURE MARKET VOLUME SHARE REGIONAL ANALYSIS, 2025–2034, (USD MILLION)
FIGURE 78 CHINA DEMINERALIZED BONE MATRIX CURRENT AND FUTURE TYPE ANALYSIS, 2025–2034, (USD MILLION)
FIGURE 79 CHINA DEMINERALIZED BONE MATRIX CURRENT AND FUTURE END USER ANALYSIS, 2025–2034, (USD MILLION)
FIGURE 80 JAPAN DEMINERALIZED BONE MATRIX CURRENT AND FUTURE TYPE ANALYSIS, 2025–2034, (USD MILLION)
FIGURE 81 JAPAN DEMINERALIZED BONE MATRIX CURRENT AND FUTURE END USER ANALYSIS, 2025–2034, (USD MILLION)
FIGURE 82 AUSTRALIA DEMINERALIZED BONE MATRIX CURRENT AND FUTURE TYPE ANALYSIS, 2025–2034, (USD MILLION)
FIGURE 83 AUSTRALIA DEMINERALIZED BONE MATRIX CURRENT AND FUTURE END USER ANALYSIS, 2025–2034, (USD MILLION)
FIGURE 84 CAMBODIA DEMINERALIZED BONE MATRIX CURRENT AND FUTURE TYPE ANALYSIS, 2025–2034, (USD MILLION)
FIGURE 85 CAMBODIA DEMINERALIZED BONE MATRIX CURRENT AND FUTURE END USER ANALYSIS, 2025–2034, (USD MILLION)
FIGURE 86 FIJI DEMINERALIZED BONE MATRIX CURRENT AND FUTURE TYPE ANALYSIS, 2025–2034, (USD MILLION)
FIGURE 87 FIJI DEMINERALIZED BONE MATRIX CURRENT AND FUTURE END USER ANALYSIS, 2025–2034, (USD MILLION)
FIGURE 88 INDONESIA DEMINERALIZED BONE MATRIX CURRENT AND FUTURE TYPE ANALYSIS, 2025–2034, (USD MILLION)
FIGURE 89 INDONESIA DEMINERALIZED BONE MATRIX CURRENT AND FUTURE END USER ANALYSIS, 2025–2034, (USD MILLION)
FIGURE 90 SOUTH KOREA DEMINERALIZED BONE MATRIX CURRENT AND FUTURE TYPE ANALYSIS, 2025–2034, (USD MILLION)
FIGURE 91 SOUTH KOREA DEMINERALIZED BONE MATRIX CURRENT AND FUTURE END USER ANALYSIS, 2025–2034, (USD MILLION)
FIGURE 92 REST OF EAST ASIA AND PACIFIC DEMINERALIZED BONE MATRIX CURRENT AND FUTURE TYPE ANALYSIS, 2025–2034, (USD MILLION)
FIGURE 93 REST OF EAST ASIA AND PACIFIC DEMINERALIZED BONE MATRIX CURRENT AND FUTURE END USER ANALYSIS, 2025–2034, (USD MILLION)
FIGURE 94 SEA AND SOUTH ASIA DEMINERALIZED BONE MATRIX CURRENT AND FUTURE MARKET VOLUME SHARE REGIONAL ANALYSIS, 2025–2034, (USD MILLION)
FIGURE 95 BANGLADESH DEMINERALIZED BONE MATRIX CURRENT AND FUTURE TYPE ANALYSIS, 2025–2034, (USD MILLION)
FIGURE 96 BANGLADESH DEMINERALIZED BONE MATRIX CURRENT AND FUTURE END USER ANALYSIS, 2025–2034, (USD MILLION)
FIGURE 97 NEW ZEALAND DEMINERALIZED BONE MATRIX CURRENT AND FUTURE TYPE ANALYSIS, 2025–2034, (USD MILLION)
FIGURE 98 NEW ZEALAND DEMINERALIZED BONE MATRIX CURRENT AND FUTURE END USER ANALYSIS, 2025–2034, (USD MILLION)
FIGURE 99 INDIA DEMINERALIZED BONE MATRIX CURRENT AND FUTURE TYPE ANALYSIS, 2025–2034, (USD MILLION)
FIGURE 100 INDIA DEMINERALIZED BONE MATRIX CURRENT AND FUTURE END USER ANALYSIS, 2025–2034, (USD MILLION)
FIGURE 101 SINGAPORE DEMINERALIZED BONE MATRIX CURRENT AND FUTURE TYPE ANALYSIS, 2025–2034, (USD MILLION)
FIGURE 102 SINGAPORE DEMINERALIZED BONE MATRIX CURRENT AND FUTURE END USER ANALYSIS, 2025–2034, (USD MILLION)
FIGURE 103 THAILAND DEMINERALIZED BONE MATRIX CURRENT AND FUTURE TYPE ANALYSIS, 2025–2034, (USD MILLION)
FIGURE 104 THAILAND DEMINERALIZED BONE MATRIX CURRENT AND FUTURE END USER ANALYSIS, 2025–2034, (USD MILLION)
FIGURE 105 TAIWAN DEMINERALIZED BONE MATRIX CURRENT AND FUTURE TYPE ANALYSIS, 2025–2034, (USD MILLION)
FIGURE 106 TAIWAN DEMINERALIZED BONE MATRIX CURRENT AND FUTURE END USER ANALYSIS, 2025–2034, (USD MILLION)
FIGURE 107 MALAYSIA DEMINERALIZED BONE MATRIX CURRENT AND FUTURE TYPE ANALYSIS, 2025–2034, (USD MILLION)
FIGURE 108 MALAYSIA DEMINERALIZED BONE MATRIX CURRENT AND FUTURE END USER ANALYSIS, 2025–2034, (USD MILLION)
FIGURE 109 REST OF SEA AND SOUTH ASIA DEMINERALIZED BONE MATRIX CURRENT AND FUTURE TYPE ANALYSIS, 2025–2034, (USD MILLION)
FIGURE 110 REST OF SEA AND SOUTH ASIA DEMINERALIZED BONE MATRIX CURRENT AND FUTURE END USER ANALYSIS, 2025–2034, (USD MILLION)
FIGURE 111 MIDDLE EAST AND AFRICA DEMINERALIZED BONE MATRIX CURRENT AND FUTURE MARKET VOLUME SHARE REGIONAL ANALYSIS, 2025–2034, (USD MILLION)
FIGURE 112 GCC COUNTRIES DEMINERALIZED BONE MATRIX CURRENT AND FUTURE TYPE ANALYSIS, 2025–2034, (USD MILLION)
FIGURE 113 GCC COUNTRIES DEMINERALIZED BONE MATRIX CURRENT AND FUTURE END USER ANALYSIS, 2025–2034, (USD MILLION)
FIGURE 114 SAUDI ARABIA DEMINERALIZED BONE MATRIX CURRENT AND FUTURE TYPE ANALYSIS, 2025–2034, (USD MILLION)
FIGURE 115 SAUDI ARABIA DEMINERALIZED BONE MATRIX CURRENT AND FUTURE END USER ANALYSIS, 2025–2034, (USD MILLION)
FIGURE 116 UAE DEMINERALIZED BONE MATRIX CURRENT AND FUTURE TYPE ANALYSIS, 2025–2034, (USD MILLION)
FIGURE 117 UAE DEMINERALIZED BONE MATRIX CURRENT AND FUTURE END USER ANALYSIS, 2025–2034, (USD MILLION)
FIGURE 118 BAHRAIN DEMINERALIZED BONE MATRIX CURRENT AND FUTURE TYPE ANALYSIS, 2025–2034, (USD MILLION)
FIGURE 119 BAHRAIN DEMINERALIZED BONE MATRIX CURRENT AND FUTURE END USER ANALYSIS, 2025–2034, (USD MILLION)
FIGURE 120 KUWAIT DEMINERALIZED BONE MATRIX CURRENT AND FUTURE TYPE ANALYSIS, 2025–2034, (USD MILLION)
FIGURE 121 KUWAIT DEMINERALIZED BONE MATRIX CURRENT AND FUTURE END USER ANALYSIS, 2025–2034, (USD MILLION)
FIGURE 122 OMAN DEMINERALIZED BONE MATRIX CURRENT AND FUTURE TYPE ANALYSIS, 2025–2034, (USD MILLION)
FIGURE 123 OMAN DEMINERALIZED BONE MATRIX CURRENT AND FUTURE END USER ANALYSIS, 2025–2034, (USD MILLION)
FIGURE 124 QATAR DEMINERALIZED BONE MATRIX CURRENT AND FUTURE TYPE ANALYSIS, 2025–2034, (USD MILLION)
FIGURE 125 QATAR DEMINERALIZED BONE MATRIX CURRENT AND FUTURE END USER ANALYSIS, 2025–2034, (USD MILLION)
FIGURE 126 EGYPT DEMINERALIZED BONE MATRIX CURRENT AND FUTURE TYPE ANALYSIS, 2025–2034, (USD MILLION)
FIGURE 127 EGYPT DEMINERALIZED BONE MATRIX CURRENT AND FUTURE END USER ANALYSIS, 2025–2034, (USD MILLION)
FIGURE 128 NIGERIA DEMINERALIZED BONE MATRIX CURRENT AND FUTURE TYPE ANALYSIS, 2025–2034, (USD MILLION)
FIGURE 129 NIGERIA DEMINERALIZED BONE MATRIX CURRENT AND FUTURE END USER ANALYSIS, 2025–2034, (USD MILLION)
FIGURE 130 SOUTH AFRICA DEMINERALIZED BONE MATRIX CURRENT AND FUTURE TYPE ANALYSIS, 2025–2034, (USD MILLION)
FIGURE 131 SOUTH AFRICA DEMINERALIZED BONE MATRIX CURRENT AND FUTURE END USER ANALYSIS, 2025–2034, (USD MILLION)
FIGURE 132 ISRAEL DEMINERALIZED BONE MATRIX CURRENT AND FUTURE TYPE ANALYSIS, 2025–2034, (USD MILLION)
FIGURE 133 ISRAEL DEMINERALIZED BONE MATRIX CURRENT AND FUTURE END USER ANALYSIS, 2025–2034, (USD MILLION)
FIGURE 134 REST OF MEA DEMINERALIZED BONE MATRIX CURRENT AND FUTURE TYPE ANALYSIS, 2025–2034, (USD MILLION)
FIGURE 135 REST OF MEA DEMINERALIZED BONE MATRIX CURRENT AND FUTURE END USER ANALYSIS, 2025–2034, (USD MILLION)
FIGURE 136 U. S. MARKET SHARE ANALYSIS BY TYPE (2024)
FIGURE 137 U. S. MARKET SHARE ANALYSIS BY END USER (2024)
FIGURE 138 CANADA MARKET SHARE ANALYSIS BY TYPE (2024)
FIGURE 139 CANADA MARKET SHARE ANALYSIS BY END USER (2024)
FIGURE 140 MEXICO MARKET SHARE ANALYSIS BY TYPE (2024)
FIGURE 141 MEXICO MARKET SHARE ANALYSIS BY END USER (2024)
FIGURE 142 CHINA MARKET SHARE ANALYSIS BY TYPE (2024)
FIGURE 143 CHINA MARKET SHARE ANALYSIS BY END USER (2024)
FIGURE 144 JAPAN MARKET SHARE ANALYSIS BY TYPE (2024)
FIGURE 145 JAPAN MARKET SHARE ANALYSIS BY END USER (2024)
FIGURE 146 INDIA MARKET SHARE ANALYSIS BY TYPE (2024)
FIGURE 147 INDIA MARKET SHARE ANALYSIS BY END USER (2024)
FIGURE 148 SOUTH KOREA MARKET SHARE ANALYSIS BY TYPE (2024)
FIGURE 149 SOUTH KOREA MARKET SHARE ANALYSIS BY END USER (2024)
FIGURE 150 SAUDI ARABIA MARKET SHARE ANALYSIS BY TYPE (2024)
FIGURE 151 SAUDI ARABIA MARKET SHARE ANALYSIS BY END USER (2024)
FIGURE 152 UAE MARKET SHARE ANALYSIS BY TYPE (2024)
FIGURE 153 UAE MARKET SHARE ANALYSIS BY END USER (2024)
FIGURE 154 EGYPT MARKET SHARE ANALYSIS BY TYPE (2024)
FIGURE 155 EGYPT MARKET SHARE ANALYSIS BY END USER (2024)
FIGURE 156 NIGERIA MARKET SHARE ANALYSIS BY TYPE (2024)
FIGURE 157 NIGERIA MARKET SHARE ANALYSIS BY END USER (2024)
FIGURE 158 SOUTH AFRICA MARKET SHARE ANALYSIS BY TYPE (2024)
FIGURE 159 SOUTH AFRICA MARKET SHARE ANALYSIS BY END USER (2024)
FIGURE 160 GERMANY MARKET SHARE ANALYSIS BY TYPE (2024)
FIGURE 161 GERMANY MARKET SHARE ANALYSIS BY END USER (2024)
FIGURE 162 FRANCE MARKET SHARE ANALYSIS BY TYPE (2024)
FIGURE 163 FRANCE MARKET SHARE ANALYSIS BY END USER (2024)
FIGURE 164 UK MARKET SHARE ANALYSIS BY TYPE (2024)
FIGURE 165 UK MARKET SHARE ANALYSIS BY END USER (2024)
FIGURE 166 SPAIN MARKET SHARE ANALYSIS BY TYPE (2024)
FIGURE 167 SPAIN MARKET SHARE ANALYSIS BY END USER (2024)
FIGURE 168 ITALY MARKET SHARE ANALYSIS BY TYPE (2024)
FIGURE 169 ITALY MARKET SHARE ANALYSIS BY END USER (2024)
FIGURE 170 BRAZIL MARKET SHARE ANALYSIS BY TYPE (2024)
FIGURE 171 BRAZIL MARKET SHARE ANALYSIS BY END USER (2024)
FIGURE 172 ARGENTINA MARKET SHARE ANALYSIS BY TYPE (2024)
FIGURE 173 ARGENTINA MARKET SHARE ANALYSIS BY END USER (2024)
FIGURE 174 COLUMBIA MARKET SHARE ANALYSIS BY TYPE (2024)
FIGURE 175 COLUMBIA MARKET SHARE ANALYSIS BY END USER (2024)
FIGURE 176 GLOBAL DEMINERALIZED BONE MATRIX CURRENT AND FUTURE MARKET KEY COUNTRY LEVEL ANALYSIS, 2024–2034, (USD MILLION)
FIGURE 177 FINANCIAL OVERVIEW:
Key Player Analysis
Zimmer Biomet: Zimmer Biomet remains a leading player in the demineralized bone matrix market in 2025, supported by its broad biologics portfolio and deep presence in orthopedic and spine surgery. The company maintains strong traction with its DBM putty and putty-plus formulations, which are widely used in fusion, trauma, and reconstruction procedures. Its market position benefits from long-standing relationships with hospitals and ambulatory surgical centers that seek consistent graft performance across high-volume surgeries. Zimmer Biomet continues to expand its biologics line through targeted R&D investments and digital integration. The company uses data-driven surgical planning platforms that support more precise graft selection, which strengthens surgeon adoption. Stable annual growth in the mid-single digits reflects its ability to link biologics with its extensive implant and instrumentation ecosystem.
Stryker: Stryker positions itself as a major challenger with a strong biologics pipeline and aggressive commercial reach across global orthopedic markets. Its DBM offerings complement the company’s expanding spine and trauma portfolios, enabling cross-selling opportunities within integrated procedural workflows. Recent expansions in tissue-processing capabilities and increased automation have improved consistency and reduced production variability. In 2025, Stryker continues to invest in digital surgery platforms and robotic-assisted procedures, creating opportunities for DBM utilization in more standardized fusion pathways. The company’s distribution scale in North America and Europe gives it an advantage in penetrating large hospital networks that prioritize reliable supplier partnerships. Its strategic acquisitions in biologics and spine implants support steady growth and strengthen its competitive position.
SeaSpine Holdings Corporation: SeaSpine operates as a focused biologics specialist with strong recognition in the spinal fusion market. The company’s DBM putties and moldable graft solutions gain traction due to their handling characteristics and documented fusion performance. SeaSpine positions itself as an innovator in the segment by advancing biologic formulations and integrating them with spine implant platforms. Its strength lies in its specialized surgeon network and its emphasis on evidence-backed product differentiation. The company has reported above-market growth in biologics revenue due to increased demand for minimally invasive and outpatient fusion procedures. Strategic partnerships and investments in clinical research continue to expand its footprint in the United States, while selective international expansion supports new revenue channels.
Market Key Players
Arthrex Inc
Medtronic Plc
Essent Biologics
Zimmer Biomet
Globus Medical
Ossifix Orthopedics
DePuy Synthes
SeaSpine Holdings Corporation
Stryker
Driver
Rising Trauma Incidence and Orthopedic Case Volume
By 2025, the demand for trauma-related care has become a major factor driving the use of demineralized bone matrix (DBM). Global accident rates are still high, leading to more complex fractures that need reliable biological support. DBM is ideal for these situations because it helps bone regeneration and works well across spinal, pelvic, and extremity procedures.
Growth of Minimally Invasive and Injectable Solutions
DBM is increasingly used in emergency and trauma centers, where consistent graft performance helps shorten recovery times. As minimally invasive surgery grows, injectable DBM formats are becoming more popular for their easier placement and shorter operation times. These advantages strengthen market growth and increase the number of trauma-related orthopedic procedures.
Restraint
High Product Costs and Budget Constraints
Cost pressures still limit the adoption of DBM in 2025. Specialized tissue processing, strict quality standards, and the need for trained clinical teams drive these costs. The price of DBM often exceeds the budgets of smaller hospitals and healthcare facilities in developing areas, restricting widespread use.
Reimbursement and Operational Challenges
In several markets, insurance policies classify biological grafts as premium products. This leads to partial or inconsistent reimbursement. There are procurement challenges in cost-sensitive environments where hospitals have limited inventory investment or require additional clinician training. These financial and operational barriers slow DBM use in lower-income regions and limit purchasing options.
Opportunity
Advancements in DBM Formulations and Performance
The need for better biological materials presents significant opportunities for companies growing their DBM portfolios in 2025. Manufacturers continue to refine their formulations to boost osteoinductive potency, handling consistency, and structural stability. This leads to greater confidence in clinical outcomes.
Demand Growth in Minimally Invasive Orthopedic Procedures
Early clinical data from new putty and moldable DBM types show better fusion results and faster integration. You can expect mid- to high-single-digit growth rates in DBM categories that align with minimally invasive procedures, where there is demand for shorter surgeries and fewer complications. Collaborations between industry and academia will further drive innovation and product development.
Trend
Industry Consolidation and Portfolio Expansion
Mergers and acquisitions are increasingly shaping the competitive landscape in DBM as orthopedic companies consolidate to grow their biologics portfolios and secure tissue processing capabilities. Recent mergers among key spine and musculoskeletal companies have created broader product offerings and more efficient supply chains.
Shift Toward Integrated Biologics Ecosystems
Merged organizations provide better product consistency and improved clinical support by aligning research, manufacturing, and distribution functions. This trend toward consolidation is expected to continue, increasing competition among large suppliers while making it harder for smaller firms to enter the market. The industry is increasingly favoring coordinated biological ecosystems over standalone products.
Recent Developments
Dec 2024 – Zimmer Biomet: Zimmer Biomet introduced a new DBM putty system for spinal fusion and complex trauma in the United States, targeting more than 20% of its existing spine customer base and projected to add over USD 35 million in incremental revenue by 2027. The company linked the launch to its digital planning platform to support procedure standardization. This move strengthens Zimmer Biomet’s position as a reference supplier for hospitals seeking integrated implant and biologic solutions.
Feb 2025 – Stryker: Stryker announced a multi-year agreement with a major U.S. hospital network to supply DBM products across more than 150 facilities, with an estimated contract value above USD 80 million. The deal includes joint clinical data programs to track fusion outcomes and graft utilization. This agreement increases Stryker’s share in high-volume centers and raises competitive pressure on mid-sized biologics vendors.
Apr 2025 – Orthofix Medical: Orthofix Medical expanded its DBM manufacturing capacity in North America by approximately 30% through the upgrade of a key tissue-processing facility, supported by an investment of around USD 25 million. The expansion incorporates higher levels of automation and in-line quality monitoring to reduce batch variability. This capacity increase improves Orthofix’s ability to meet growing demand in spine and trauma indications and supports future geographic expansion.
Jul 2025 – Medtronic: Medtronic launched a DBM product line integrated with its spine navigation and robotics ecosystem across selected markets in Europe and Asia Pacific. Early pilot data indicate adoption rates above 15% among targeted spine surgeons within the first three months. This integration deepens Medtronic’s procedural footprint and supports cross-selling of implants, instruments, and biologics.
Sep 2025 – SeaSpine (an Orthofix company): SeaSpine reported the first full-year results from its expanded DBM portfolio in outpatient spine centers, with biologics revenue from this channel growing at an estimated CAGR of 12% from 2024 to 2025. The company also entered a co-marketing partnership with regional distributors in Latin America to introduce its DBM putty and strip formats. These steps broaden SeaSpine’s presence in fast-growing ambulatory and emerging markets and diversify its revenue base beyond North American hospitals.