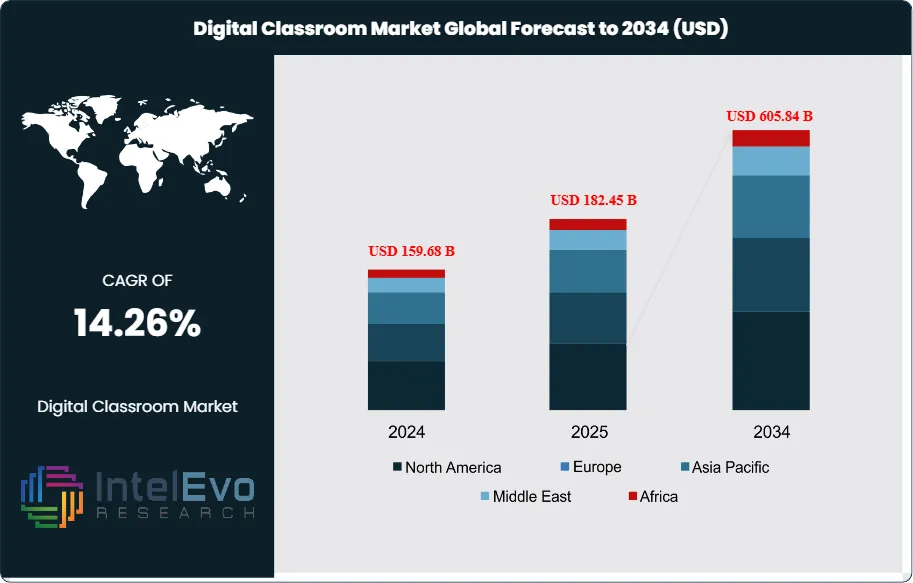
The Digital Classroom Market size is expected to be worth around USD 605.84 Billion by 2034, from USD 159.68 Billion in 2024, growing at a CAGR of 14.26% during the forecast period from 2024 to 2034. The digital classroom market encompasses comprehensive educational technology solutions that leverage digital devices, software platforms, and interactive tools to transform traditional learning environments into technology-enhanced educational spaces.
This market includes hardware components such as interactive whiteboards, projectors, tablets, laptops, and VR/AR devices, alongside software solutions including learning management systems (LMS), collaboration tools, assessment platforms, and digital content creation applications. The ecosystem serves diverse educational segments ranging from K-12 schools and higher education institutions to corporate training environments and government educational programs, enabling personalized learning experiences, remote education capabilities, and data-driven instruction methodologies.
The digital classroom market is experiencing exponential growth driven by accelerating adoption of e-learning platforms, virtual classrooms, and government-backed digital education initiatives worldwide. Key growth catalysts include the widespread integration of artificial intelligence, augmented reality, and virtual reality technologies that create immersive and personalized learning experiences. The market benefits from increasing demand for hybrid learning models that combine traditional classroom instruction with digital tools, enabling flexible education delivery and enhanced student engagement. Additionally, rising investment in educational technology infrastructure, particularly in developing regions, is driving market expansion through improved internet connectivity, mobile device proliferation, and cloud-based educational platform adoption.
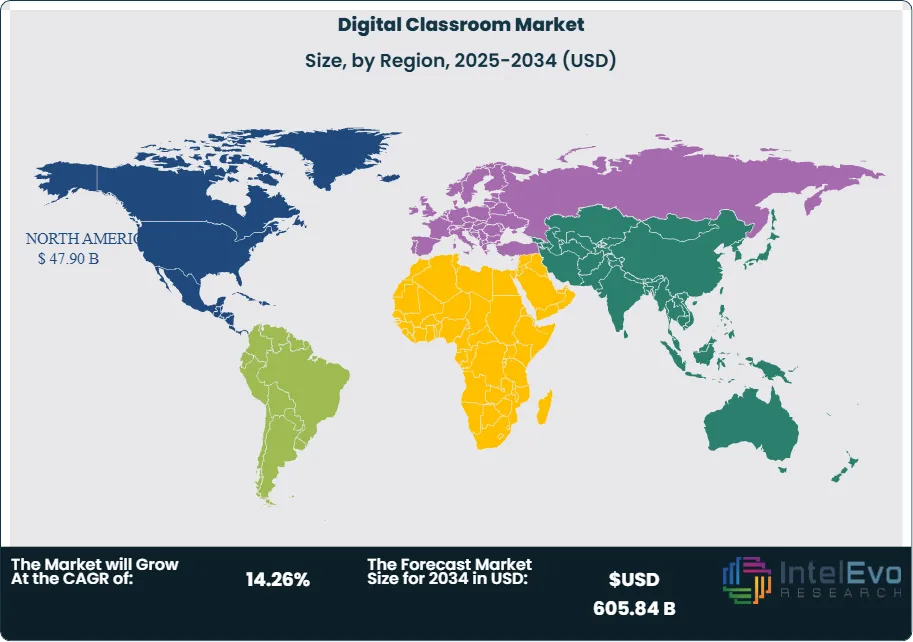
North America dominates the global digital classroom market with over 33.7% market share in 2024, generating significant revenues driven by advanced technological infrastructure and extensive digital tool integration in educational institutions. The United States leads this dominance with 68.36% share in North America, supported by substantial government and private sector investments in educational technology infrastructure. The region's leadership stems from early adoption of Industry 4.0 technologies, robust internet penetration, and comprehensive federal support for high-speed internet and device accessibility in schools. Asia-Pacific represents the fastest-growing regional market, propelled by rapid digitization initiatives, government-led digital literacy programs, and increasing smartphone and internet penetration across developing economies.
The COVID-19 pandemic fundamentally accelerated digital transformation in education, creating unprecedented demand for digital classroom solutions as institutions worldwide shifted to remote and hybrid learning models. The crisis highlighted the critical importance of technology-enabled education continuity, driving massive investments in cloud-based learning platforms, collaboration tools, and digital content delivery systems. While initial supply chain disruptions temporarily affected hardware availability, the long-term impact has been overwhelmingly positive, with educational institutions recognizing the permanent value of digital tools for enhancing learning outcomes, enabling distributed education, and building resilience against future disruptions.
Rising geopolitical tensions and trade restrictions have influenced digital classroom technology adoption patterns, with educational institutions seeking to diversify supplier relationships and reduce dependency on single-source technology providers. International sanctions and export controls on advanced technologies have created opportunities for domestic EdTech solution providers while challenging global supply chains. Additionally, increasing emphasis on data sovereignty and student privacy protection has driven demand for locally-hosted educational platforms and enhanced cybersecurity solutions that comply with regional data protection regulations.
Key Takeaways
Market Growth: The Digital Classroom Market is expected to reach USD 605.84 Billion by 2034, fueled by the accelerated adoption of e-learning platforms, virtual classrooms, and government-supported digital education initiatives across the globe.
ComponentTypeDominance: Software dominates the segment, driven by learning management systems and collaboration platform adoption.
DeploymentModeDominance: Cloud deployment leads the market share, primarily due to scalability, cost-effectiveness, and maintenance advantages.
ApplicationTypeDominance: Higher Education holds the largest share, owing to advanced technology adoption and flexible learning model demands.
Driver: Key drivers accelerating growth include widespread e-learning adoption and government digital education initiatives, which boost market expansion through infrastructure investment and policy support.
Restraint: Growth is hindered by high initial investment costs and cybersecurity concerns, which create challenges such as implementation barriers and data privacy risks.
Opportunity: The market is poised for expansion due to opportunities like AI integration in educational tools and emerging market penetration, which enable personalized learning and geographic diversification.
Trend: Emerging trends including VR/AR technology integration and 5G connectivity adoption are reshaping the market by enabling immersive learning experiences and low-latency communications.
RegionalAnalysis: North America leads owing to advanced infrastructure and early technology adoption. Asia-Pacific shows high promise due to rapid digitization and government-led educational modernization initiatives.
Component Type Analysis:
Software components hold a dominant position in the educational technology market, highlighting their essential function in content delivery, learning process management, and facilitating communication between learners and instructors. This category encompasses various learning management platforms including Canvas and Blackboard, collaborative solutions like Microsoft Teams for Education and Google Classroom, and specialized educational software applications. The software segment's market leadership stems from the widespread adoption of cloud-based solutions that provide enhanced scalability, seamless automatic updates, and improved accessibility across devices and locations. Additionally, the growing incorporation of artificial intelligence and machine learning capabilities has revolutionized the sector by enabling customized learning pathways and smart content distribution systems that adapt to individual student needs and preferences.
Deployment Mode Analysis:
Cloud deployment maintains a commanding presence in the educational technology market, demonstrating a significant transformation from conventional on-premise systems to flexible, accessible platforms that lower overall operational costs and remove infrastructure management responsibilities. This cloud-based dominance reflects educational institutions' growing preference for solutions that provide seamless automatic updates, robust security measures, and comprehensive support for distance learning without requiring substantial information technology infrastructure investments.
Application Type Analysis:
Higher Education Leads With more than 50% Market Share In Digital Classroom Market. Higher education maintains a leading position within the application segment of the educational technology market, reflecting universities' and colleges' superior technology adoption capabilities and substantial capacity for infrastructure investment. This sector's prominent standing is strengthened by higher education institutions' requirements for advanced research tools, adaptable learning delivery mechanisms, and comprehensive student administration systems. The sector's dominance receives additional support from the growing demand for blended learning approaches, digital degree programs, and international student accessibility that necessitates powerful digital platforms capable of accommodating varied educational approaches and worldwide reach requirements. Universities and colleges demonstrate particular readiness to embrace innovative technologies due to their research-oriented environments and available financial resources for technological advancement.
Region Analysis:
North America Leads With over 30% Market Share In Digital Classroom Market. North America holds a commanding position in the global educational technology market, demonstrating technological leadership through sophisticated infrastructure, extensive federal and state educational funding programs, and early-stage adoption of digital learning solutions throughout K-12 and higher education systems. This regional dominance reflects the United States' substantial influence within the North American market, where advanced technological capabilities and comprehensive investment strategies have established the foundation for continued market leadership.
Asia-Pacific emerges as the most rapidly expanding regional market for educational technology, propelled by accelerated economic development, government-driven digitization programs, and increased investment in educational infrastructure across major economies including China, India, and Southeast Asian nations. The region's remarkable growth trajectory is supported by expanding internet connectivity, rising smartphone adoption rates, and growing middle-class populations actively seeking enhanced educational opportunities.
Europe maintains a substantial presence in the educational technology market through well-established educational systems, increasing government funding for digital learning initiatives, and comprehensive regulatory frameworks that promote educational technology adoption while ensuring data privacy and security compliance. The European market demonstrates consistent growth driven by digital infrastructure investments and policy support for educational innovation.
Component Type (Hardware, Software, Services) Deployment Mode (On-Premise, Cloud, Hybrid) Application Type (K-12 Education, Higher Education, Corporate Training)
Research Methodology
Primary Research- 100 Interviews of Stakeholders
Secondary Research
Desk Research
Regional scope
North America (United States, Canada, Mexico)
Latin America (Brazil, Argentina, Columbia)
East Asia And Pacific (China, Japan, South Korea, Australia, Cambodia, Fiji, Indonesia)
Sea And South Asia (India, Singapore, Thailand, Taiwan, Malaysia)
Eastern Europe (Poland, Russia, Czech Republic, Romania)
Western Europe (Germany, U.K., France, Spain, Itlay)
Middle East & Africa (GCC Countries, Egypt, Nigeria, South Africa, Israel)
Competitive Landscape
Google LLC, Microsoft Corporation, Apple Inc., Instructure Inc. (Canvas), Blackboard Inc., MagicSchool, Echo360, Smart Technologies, Promethean Limited, Dell Technologies, Moodle, PowerSchool
Customization Scope
Customization for segments, region/country-level will be provided. Moreover, additional customization can be done based on the requirements.
Pricing and Purchase Options
Avail customized purchase options to meet your exact research needs. We have three licenses to opt for: Single User License, Multi-User License (Up to 5 Users), Corporate Use License (Unlimited User and Printable PDF).
TABLE OF CONTENTS
1. EXECUTIVE SUMMARY
1.1. MARKET SNAPSHOT
1.2. KEY FINDINGS & INSIGHTS
1.3. ANALYST RECOMMENDATIONS
1.4. FUTURE OUTLOOK
2. RESEARCH METHODOLOGY
2.1. MARKET DEFINITION & SCOPE
2.2. RESEARCH OBJECTIVES: PRIMARY & SECONDARY DATA SOURCES
2.3. DATA COLLECTION SOURCES
2.3.1. COVERAGE OF 100+ PRIMARY RESEARCH/CONSULTATION CALLS WITH INDUSTRY STAKEHOLDERS
FIGURE 17 NORTH AMERICA DIGITAL CLASSROOM CURRENT AND FUTURE TYPE ANALYSIS, 2025–2034, (USD MILLION)
FIGURE 18 NORTH AMERICA DIGITAL CLASSROOM CURRENT AND FUTURE END USER ANALYSIS, 2025–2034, (USD MILLION)
FIGURE 19 MARKET SHARE BY COUNTRY
FIGURE 20 LATIN AMERICA DIGITAL CLASSROOM CURRENT AND FUTURE TYPE ANALYSIS, 2025–2034, (USD MILLION)
FIGURE 21 LATIN AMERICA DIGITAL CLASSROOM CURRENT AND FUTURE END USER ANALYSIS, 2025–2034, (USD MILLION)
FIGURE 22 MARKET SHARE BY COUNTRY
FIGURE 23 EASTERN EUROPE DIGITAL CLASSROOM CURRENT AND FUTURE TYPE ANALYSIS, 2025–2034, (USD MILLION)
FIGURE 24 EASTERN EUROPE DIGITAL CLASSROOM CURRENT AND FUTURE END USER ANALYSIS, 2025–2034, (USD MILLION)
FIGURE 25 MARKET SHARE BY COUNTRY
FIGURE 26 WESTERN EUROPE DIGITAL CLASSROOM CURRENT AND FUTURE TYPE ANALYSIS, 2025–2034, (USD MILLION)
FIGURE 27 WESTERN EUROPE DIGITAL CLASSROOM CURRENT AND FUTURE END USER ANALYSIS, 2025–2034, (USD MILLION)
FIGURE 28 MARKET SHARE BY COUNTRY
FIGURE 29 EAST ASIA AND PACIFIC DIGITAL CLASSROOM CURRENT AND FUTURE TYPE ANALYSIS, 2025–2034, (USD MILLION)
FIGURE 30 EAST ASIA AND PACIFIC DIGITAL CLASSROOM CURRENT AND FUTURE END USER ANALYSIS, 2025–2034, (USD MILLION)
FIGURE 31 MARKET SHARE BY COUNTRY
FIGURE 32 SEA AND SOUTH ASIA DIGITAL CLASSROOM CURRENT AND FUTURE TYPE ANALYSIS, 2025–2034, (USD MILLION)
FIGURE 33 SEA AND SOUTH ASIA DIGITAL CLASSROOM CURRENT AND FUTURE END USER ANALYSIS, 2025–2034, (USD MILLION)
FIGURE 34 MARKET SHARE BY COUNTRY
FIGURE 35 MIDDLE EAST AND AFRICA DIGITAL CLASSROOM CURRENT AND FUTURE TYPE ANALYSIS, 2025–2034, (USD MILLION)
FIGURE 36 MIDDLE EAST AND AFRICA DIGITAL CLASSROOM CURRENT AND FUTURE END USER ANALYSIS, 2025–2034, (USD MILLION)
FIGURE 37 NORTH AMERICA DIGITAL CLASSROOM CURRENT AND FUTURE MARKET VOLUME SHARE REGIONAL ANALYSIS, 2025–2034, (USD MILLION)
FIGURE 38 U.S. DIGITAL CLASSROOM CURRENT AND FUTURE TYPE ANALYSIS, 2025–2034, (USD MILLION)
FIGURE 39 U.S. DIGITAL CLASSROOM CURRENT AND FUTURE END USER ANALYSIS, 2025–2034, (USD MILLION)
FIGURE 40 CANADA DIGITAL CLASSROOM CURRENT AND FUTURE TYPE ANALYSIS, 2025–2034, (USD MILLION)
FIGURE 41 CANADA DIGITAL CLASSROOM CURRENT AND FUTURE END USER ANALYSIS, 2025–2034, (USD MILLION)
FIGURE 42 LATIN AMERICA DIGITAL CLASSROOM CURRENT AND FUTURE MARKET VOLUME SHARE REGIONAL ANALYSIS, 2025–2034, (USD MILLION)
FIGURE 43 MEXICO DIGITAL CLASSROOM CURRENT AND FUTURE TYPE ANALYSIS, 2025–2034, (USD MILLION)
FIGURE 44 MEXICO DIGITAL CLASSROOM CURRENT AND FUTURE END USER ANALYSIS, 2025–2034, (USD MILLION)
FIGURE 45 BRAZIL DIGITAL CLASSROOM CURRENT AND FUTURE TYPE ANALYSIS, 2025–2034, (USD MILLION)
FIGURE 46 BRAZIL DIGITAL CLASSROOM CURRENT AND FUTURE END USER ANALYSIS, 2025–2034, (USD MILLION)
FIGURE 47 ARGENTINA DIGITAL CLASSROOM CURRENT AND FUTURE TYPE ANALYSIS, 2025–2034, (USD MILLION)
FIGURE 48 ARGENTINA DIGITAL CLASSROOM CURRENT AND FUTURE END USER ANALYSIS, 2025–2034, (USD MILLION)
FIGURE 49 COLUMBIA DIGITAL CLASSROOM CURRENT AND FUTURE TYPE ANALYSIS, 2025–2034, (USD MILLION)
FIGURE 50 COLUMBIA DIGITAL CLASSROOM CURRENT AND FUTURE END USER ANALYSIS, 2025–2034, (USD MILLION)
FIGURE 51 REST OF LATIN AMERICA DIGITAL CLASSROOM CURRENT AND FUTURE TYPE ANALYSIS, 2025–2034, (USD MILLION)
FIGURE 52 REST OF LATIN AMERICA DIGITAL CLASSROOM CURRENT AND FUTURE END USER ANALYSIS, 2025–2034, (USD MILLION)
FIGURE 53 EASTERN EUROPE DIGITAL CLASSROOM CURRENT AND FUTURE MARKET VOLUME SHARE REGIONAL ANALYSIS, 2025–2034, (USD MILLION)
FIGURE 54 POLAND DIGITAL CLASSROOM CURRENT AND FUTURE TYPE ANALYSIS, 2025–2034, (USD MILLION)
FIGURE 55 POLAND DIGITAL CLASSROOM CURRENT AND FUTURE END USER ANALYSIS, 2025–2034, (USD MILLION)
FIGURE 56 RUSSIA DIGITAL CLASSROOM CURRENT AND FUTURE TYPE ANALYSIS, 2025–2034, (USD MILLION)
FIGURE 57 RUSSIA DIGITAL CLASSROOM CURRENT AND FUTURE END USER ANALYSIS, 2025–2034, (USD MILLION)
FIGURE 58 CZECH REPUBLIC DIGITAL CLASSROOM CURRENT AND FUTURE TYPE ANALYSIS, 2025–2034, (USD MILLION)
FIGURE 59 CZECH REPUBLIC DIGITAL CLASSROOM CURRENT AND FUTURE END USER ANALYSIS, 2025–2034, (USD MILLION)
FIGURE 60 ROMANIA DIGITAL CLASSROOM CURRENT AND FUTURE TYPE ANALYSIS, 2025–2034, (USD MILLION)
FIGURE 61 ROMANIA DIGITAL CLASSROOM CURRENT AND FUTURE END USER ANALYSIS, 2025–2034, (USD MILLION)
FIGURE 62 REST OF EASTERN EUROPE DIGITAL CLASSROOM CURRENT AND FUTURE TYPE ANALYSIS, 2025–2034, (USD MILLION)
FIGURE 63 REST OF EASTERN EUROPE DIGITAL CLASSROOM CURRENT AND FUTURE END USER ANALYSIS, 2025–2034, (USD MILLION)
FIGURE 64 WESTERN EUROPE DIGITAL CLASSROOM CURRENT AND FUTURE MARKET VOLUME SHARE REGIONAL ANALYSIS, 2025–2034, (USD MILLION)
FIGURE 65 GERMANY DIGITAL CLASSROOM CURRENT AND FUTURE TYPE ANALYSIS, 2025–2034, (USD MILLION)
FIGURE 66 GERMANY DIGITAL CLASSROOM CURRENT AND FUTURE END USER ANALYSIS, 2025–2034, (USD MILLION)
FIGURE 67 FRANCE DIGITAL CLASSROOM CURRENT AND FUTURE TYPE ANALYSIS, 2025–2034, (USD MILLION)
FIGURE 68 FRANCE DIGITAL CLASSROOM CURRENT AND FUTURE END USER ANALYSIS, 2025–2034, (USD MILLION)
FIGURE 69 UK DIGITAL CLASSROOM CURRENT AND FUTURE TYPE ANALYSIS, 2025–2034, (USD MILLION)
FIGURE 70 UK DIGITAL CLASSROOM CURRENT AND FUTURE END USER ANALYSIS, 2025–2034, (USD MILLION)
FIGURE 71 SPAIN DIGITAL CLASSROOM CURRENT AND FUTURE TYPE ANALYSIS, 2025–2034, (USD MILLION)
FIGURE 72 SPAIN DIGITAL CLASSROOM CURRENT AND FUTURE END USER ANALYSIS, 2025–2034, (USD MILLION)
FIGURE 73 ITALY DIGITAL CLASSROOM CURRENT AND FUTURE TYPE ANALYSIS, 2025–2034, (USD MILLION)
FIGURE 74 ITALY DIGITAL CLASSROOM CURRENT AND FUTURE END USER ANALYSIS, 2025–2034, (USD MILLION)
FIGURE 75 REST OF WESTERN EUROPE DIGITAL CLASSROOM CURRENT AND FUTURE TYPE ANALYSIS, 2025–2034, (USD MILLION)
FIGURE 76 REST OF WESTERN EUROPE DIGITAL CLASSROOM CURRENT AND FUTURE END USER ANALYSIS, 2025–2034, (USD MILLION)
FIGURE 77 EAST ASIA AND PACIFIC DIGITAL CLASSROOM CURRENT AND FUTURE MARKET VOLUME SHARE REGIONAL ANALYSIS, 2025–2034, (USD MILLION)
FIGURE 78 CHINA DIGITAL CLASSROOM CURRENT AND FUTURE TYPE ANALYSIS, 2025–2034, (USD MILLION)
FIGURE 79 CHINA DIGITAL CLASSROOM CURRENT AND FUTURE END USER ANALYSIS, 2025–2034, (USD MILLION)
FIGURE 80 JAPAN DIGITAL CLASSROOM CURRENT AND FUTURE TYPE ANALYSIS, 2025–2034, (USD MILLION)
FIGURE 81 JAPAN DIGITAL CLASSROOM CURRENT AND FUTURE END USER ANALYSIS, 2025–2034, (USD MILLION)
FIGURE 82 AUSTRALIA DIGITAL CLASSROOM CURRENT AND FUTURE TYPE ANALYSIS, 2025–2034, (USD MILLION)
FIGURE 83 AUSTRALIA DIGITAL CLASSROOM CURRENT AND FUTURE END USER ANALYSIS, 2025–2034, (USD MILLION)
FIGURE 84 CAMBODIA DIGITAL CLASSROOM CURRENT AND FUTURE TYPE ANALYSIS, 2025–2034, (USD MILLION)
FIGURE 85 CAMBODIA DIGITAL CLASSROOM CURRENT AND FUTURE END USER ANALYSIS, 2025–2034, (USD MILLION)
FIGURE 86 FIJI DIGITAL CLASSROOM CURRENT AND FUTURE TYPE ANALYSIS, 2025–2034, (USD MILLION)
FIGURE 87 FIJI DIGITAL CLASSROOM CURRENT AND FUTURE END USER ANALYSIS, 2025–2034, (USD MILLION)
FIGURE 88 INDONESIA DIGITAL CLASSROOM CURRENT AND FUTURE TYPE ANALYSIS, 2025–2034, (USD MILLION)
FIGURE 89 INDONESIA DIGITAL CLASSROOM CURRENT AND FUTURE END USER ANALYSIS, 2025–2034, (USD MILLION)
FIGURE 90 SOUTH KOREA DIGITAL CLASSROOM CURRENT AND FUTURE TYPE ANALYSIS, 2025–2034, (USD MILLION)
FIGURE 91 SOUTH KOREA DIGITAL CLASSROOM CURRENT AND FUTURE END USER ANALYSIS, 2025–2034, (USD MILLION)
FIGURE 92 REST OF EAST ASIA AND PACIFIC DIGITAL CLASSROOM CURRENT AND FUTURE TYPE ANALYSIS, 2025–2034, (USD MILLION)
FIGURE 93 REST OF EAST ASIA AND PACIFIC DIGITAL CLASSROOM CURRENT AND FUTURE END USER ANALYSIS, 2025–2034, (USD MILLION)
FIGURE 94 SEA AND SOUTH ASIA DIGITAL CLASSROOM CURRENT AND FUTURE MARKET VOLUME SHARE REGIONAL ANALYSIS, 2025–2034, (USD MILLION)
FIGURE 95 BANGLADESH DIGITAL CLASSROOM CURRENT AND FUTURE TYPE ANALYSIS, 2025–2034, (USD MILLION)
FIGURE 96 BANGLADESH DIGITAL CLASSROOM CURRENT AND FUTURE END USER ANALYSIS, 2025–2034, (USD MILLION)
FIGURE 97 NEW ZEALAND DIGITAL CLASSROOM CURRENT AND FUTURE TYPE ANALYSIS, 2025–2034, (USD MILLION)
FIGURE 98 NEW ZEALAND DIGITAL CLASSROOM CURRENT AND FUTURE END USER ANALYSIS, 2025–2034, (USD MILLION)
FIGURE 99 INDIA DIGITAL CLASSROOM CURRENT AND FUTURE TYPE ANALYSIS, 2025–2034, (USD MILLION)
FIGURE 100 INDIA DIGITAL CLASSROOM CURRENT AND FUTURE END USER ANALYSIS, 2025–2034, (USD MILLION)
FIGURE 101 SINGAPORE DIGITAL CLASSROOM CURRENT AND FUTURE TYPE ANALYSIS, 2025–2034, (USD MILLION)
FIGURE 102 SINGAPORE DIGITAL CLASSROOM CURRENT AND FUTURE END USER ANALYSIS, 2025–2034, (USD MILLION)
FIGURE 103 THAILAND DIGITAL CLASSROOM CURRENT AND FUTURE TYPE ANALYSIS, 2025–2034, (USD MILLION)
FIGURE 104 THAILAND DIGITAL CLASSROOM CURRENT AND FUTURE END USER ANALYSIS, 2025–2034, (USD MILLION)
FIGURE 105 TAIWAN DIGITAL CLASSROOM CURRENT AND FUTURE TYPE ANALYSIS, 2025–2034, (USD MILLION)
FIGURE 106 TAIWAN DIGITAL CLASSROOM CURRENT AND FUTURE END USER ANALYSIS, 2025–2034, (USD MILLION)
FIGURE 107 MALAYSIA DIGITAL CLASSROOM CURRENT AND FUTURE TYPE ANALYSIS, 2025–2034, (USD MILLION)
FIGURE 108 MALAYSIA DIGITAL CLASSROOM CURRENT AND FUTURE END USER ANALYSIS, 2025–2034, (USD MILLION)
FIGURE 109 REST OF SEA AND SOUTH ASIA DIGITAL CLASSROOM CURRENT AND FUTURE TYPE ANALYSIS, 2025–2034, (USD MILLION)
FIGURE 110 REST OF SEA AND SOUTH ASIA DIGITAL CLASSROOM CURRENT AND FUTURE END USER ANALYSIS, 2025–2034, (USD MILLION)
FIGURE 111 MIDDLE EAST AND AFRICA DIGITAL CLASSROOM CURRENT AND FUTURE MARKET VOLUME SHARE REGIONAL ANALYSIS, 2025–2034, (USD MILLION)
FIGURE 112 GCC COUNTRIES DIGITAL CLASSROOM CURRENT AND FUTURE TYPE ANALYSIS, 2025–2034, (USD MILLION)
FIGURE 113 GCC COUNTRIES DIGITAL CLASSROOM CURRENT AND FUTURE END USER ANALYSIS, 2025–2034, (USD MILLION)
FIGURE 114 SAUDI ARABIA DIGITAL CLASSROOM CURRENT AND FUTURE TYPE ANALYSIS, 2025–2034, (USD MILLION)
FIGURE 115 SAUDI ARABIA DIGITAL CLASSROOM CURRENT AND FUTURE END USER ANALYSIS, 2025–2034, (USD MILLION)
FIGURE 116 UAE DIGITAL CLASSROOM CURRENT AND FUTURE TYPE ANALYSIS, 2025–2034, (USD MILLION)
FIGURE 117 UAE DIGITAL CLASSROOM CURRENT AND FUTURE END USER ANALYSIS, 2025–2034, (USD MILLION)
FIGURE 118 BAHRAIN DIGITAL CLASSROOM CURRENT AND FUTURE TYPE ANALYSIS, 2025–2034, (USD MILLION)
FIGURE 119 BAHRAIN DIGITAL CLASSROOM CURRENT AND FUTURE END USER ANALYSIS, 2025–2034, (USD MILLION)
FIGURE 120 KUWAIT DIGITAL CLASSROOM CURRENT AND FUTURE TYPE ANALYSIS, 2025–2034, (USD MILLION)
FIGURE 121 KUWAIT DIGITAL CLASSROOM CURRENT AND FUTURE END USER ANALYSIS, 2025–2034, (USD MILLION)
FIGURE 122 OMAN DIGITAL CLASSROOM CURRENT AND FUTURE TYPE ANALYSIS, 2025–2034, (USD MILLION)
FIGURE 123 OMAN DIGITAL CLASSROOM CURRENT AND FUTURE END USER ANALYSIS, 2025–2034, (USD MILLION)
FIGURE 124 QATAR DIGITAL CLASSROOM CURRENT AND FUTURE TYPE ANALYSIS, 2025–2034, (USD MILLION)
FIGURE 125 QATAR DIGITAL CLASSROOM CURRENT AND FUTURE END USER ANALYSIS, 2025–2034, (USD MILLION)
FIGURE 126 EGYPT DIGITAL CLASSROOM CURRENT AND FUTURE TYPE ANALYSIS, 2025–2034, (USD MILLION)
FIGURE 127 EGYPT DIGITAL CLASSROOM CURRENT AND FUTURE END USER ANALYSIS, 2025–2034, (USD MILLION)
FIGURE 128 NIGERIA DIGITAL CLASSROOM CURRENT AND FUTURE TYPE ANALYSIS, 2025–2034, (USD MILLION)
FIGURE 129 NIGERIA DIGITAL CLASSROOM CURRENT AND FUTURE END USER ANALYSIS, 2025–2034, (USD MILLION)
FIGURE 130 SOUTH AFRICA DIGITAL CLASSROOM CURRENT AND FUTURE TYPE ANALYSIS, 2025–2034, (USD MILLION)
FIGURE 131 SOUTH AFRICA DIGITAL CLASSROOM CURRENT AND FUTURE END USER ANALYSIS, 2025–2034, (USD MILLION)
FIGURE 132 ISRAEL DIGITAL CLASSROOM CURRENT AND FUTURE TYPE ANALYSIS, 2025–2034, (USD MILLION)
FIGURE 133 ISRAEL DIGITAL CLASSROOM CURRENT AND FUTURE END USER ANALYSIS, 2025–2034, (USD MILLION)
FIGURE 134 REST OF MEA DIGITAL CLASSROOM CURRENT AND FUTURE TYPE ANALYSIS, 2025–2034, (USD MILLION)
FIGURE 135 REST OF MEA DIGITAL CLASSROOM CURRENT AND FUTURE END USER ANALYSIS, 2025–2034, (USD MILLION)
FIGURE 136 U. S. MARKET SHARE ANALYSIS BY TYPE (2024)
FIGURE 137 U. S. MARKET SHARE ANALYSIS BY END USER (2024)
FIGURE 138 CANADA MARKET SHARE ANALYSIS BY TYPE (2024)
FIGURE 139 CANADA MARKET SHARE ANALYSIS BY END USER (2024)
FIGURE 140 MEXICO MARKET SHARE ANALYSIS BY TYPE (2024)
FIGURE 141 MEXICO MARKET SHARE ANALYSIS BY END USER (2024)
FIGURE 142 CHINA MARKET SHARE ANALYSIS BY TYPE (2024)
FIGURE 143 CHINA MARKET SHARE ANALYSIS BY END USER (2024)
FIGURE 144 JAPAN MARKET SHARE ANALYSIS BY TYPE (2024)
FIGURE 145 JAPAN MARKET SHARE ANALYSIS BY END USER (2024)
FIGURE 146 INDIA MARKET SHARE ANALYSIS BY TYPE (2024)
FIGURE 147 INDIA MARKET SHARE ANALYSIS BY END USER (2024)
FIGURE 148 SOUTH KOREA MARKET SHARE ANALYSIS BY TYPE (2024)
FIGURE 149 SOUTH KOREA MARKET SHARE ANALYSIS BY END USER (2024)
FIGURE 150 SAUDI ARABIA MARKET SHARE ANALYSIS BY TYPE (2024)
FIGURE 151 SAUDI ARABIA MARKET SHARE ANALYSIS BY END USER (2024)
FIGURE 152 UAE MARKET SHARE ANALYSIS BY TYPE (2024)
FIGURE 153 UAE MARKET SHARE ANALYSIS BY END USER (2024)
FIGURE 154 EGYPT MARKET SHARE ANALYSIS BY TYPE (2024)
FIGURE 155 EGYPT MARKET SHARE ANALYSIS BY END USER (2024)
FIGURE 156 NIGERIA MARKET SHARE ANALYSIS BY TYPE (2024)
FIGURE 157 NIGERIA MARKET SHARE ANALYSIS BY END USER (2024)
FIGURE 158 SOUTH AFRICA MARKET SHARE ANALYSIS BY TYPE (2024)
FIGURE 159 SOUTH AFRICA MARKET SHARE ANALYSIS BY END USER (2024)
FIGURE 160 GERMANY MARKET SHARE ANALYSIS BY TYPE (2024)
FIGURE 161 GERMANY MARKET SHARE ANALYSIS BY END USER (2024)
FIGURE 162 FRANCE MARKET SHARE ANALYSIS BY TYPE (2024)
FIGURE 163 FRANCE MARKET SHARE ANALYSIS BY END USER (2024)
FIGURE 164 UK MARKET SHARE ANALYSIS BY TYPE (2024)
FIGURE 165 UK MARKET SHARE ANALYSIS BY END USER (2024)
FIGURE 166 SPAIN MARKET SHARE ANALYSIS BY TYPE (2024)
FIGURE 167 SPAIN MARKET SHARE ANALYSIS BY END USER (2024)
FIGURE 168 ITALY MARKET SHARE ANALYSIS BY TYPE (2024)
FIGURE 169 ITALY MARKET SHARE ANALYSIS BY END USER (2024)
FIGURE 170 BRAZIL MARKET SHARE ANALYSIS BY TYPE (2024)
FIGURE 171 BRAZIL MARKET SHARE ANALYSIS BY END USER (2024)
FIGURE 172 ARGENTINA MARKET SHARE ANALYSIS BY TYPE (2024)
FIGURE 173 ARGENTINA MARKET SHARE ANALYSIS BY END USER (2024)
FIGURE 174 COLUMBIA MARKET SHARE ANALYSIS BY TYPE (2024)
FIGURE 175 COLUMBIA MARKET SHARE ANALYSIS BY END USER (2024)
FIGURE 176 GLOBAL DIGITAL CLASSROOM CURRENT AND FUTURE MARKET KEY COUNTRY LEVEL ANALYSIS, 2024–2034, (USD MILLION)
FIGURE 177 FINANCIAL OVERVIEW:
Key Players Analysis:
Google LLC: Google maintains a dominant market position through its comprehensive Google Workspace for Education ecosystem that integrates Gmail, Google Drive, Google Classroom, and Chrome devices into a unified educational platform. The company's competitive advantage lies in its cloud-first approach, seamless integration across devices and applications, and substantial investment in AI-powered educational tools that provide personalized learning experiences. Google's strength comes from its global scale, proven reliability, and continuous innovation in educational technology, including recent investments of $25 million in teacher AI training grants and development of advanced collaboration features that support hybrid learning environments.
Microsoft Corporation: Microsoft dominates the enterprise-focused educational technology segment through Teams for Education, Azure cloud services, and comprehensive device management solutions that integrate seamlessly with existing institutional IT infrastructure. The company's competitive differentiation stems from its deep understanding of enterprise requirements, robust security frameworks, and ability to provide complete ecosystem solutions spanning productivity applications, cloud infrastructure, and device management. Microsoft's market strength is reinforced by strategic partnerships such as its credentialing agreement with Pearson that expands Azure adoption and recent AI-skilling initiatives that embed personalized learning paths into its platform offerings.
Instructure Inc. (Canvas): Instructure maintains market leadership in the learning management system segment with Canvas holding approximately 41% enrollment-weighted market share, serving millions of students and educators worldwide. The company's competitive advantage comes from its user-friendly interface, robust API ecosystem that supports third-party integrations, and continuous innovation in mobile learning capabilities. Instructure's strength lies in its focus on user experience, comprehensive analytics capabilities, and strategic acquisitions like the $835 million purchase of Parchment that enhance credential management and student lifecycle support, creating a more comprehensive educational technology platform.
Apple Inc.: Apple maintains a strong position in the creative education segment through its iPad and MacBook educational programs, comprehensive teacher training initiatives, and focus on creative learning applications including video production, music creation, and digital art. The company's competitive differentiation stems from its premium hardware design, integrated software ecosystem, and emphasis on creative and collaborative learning experiences. Apple's market strength comes from its brand recognition, loyal educator community, and ability to provide intuitive, aesthetically appealing solutions that enhance student engagement while supporting diverse learning modalities and creative expression capabilities.
Market Key Players
Google LLC
Microsoft Corporation
Apple Inc.
Instructure Inc. (Canvas)
Blackboard Inc.
MagicSchool
Echo360
Smart Technologies
Promethean Limited
Dell Technologies
Moodle
PowerSchool
Driver:
Widespread E-Learning Platform Adoption and Digital Transformation:
The accelerating adoption of e-learning platforms and comprehensive digital transformation initiatives across educational institutions represents the primary growth driver for the digital classroom market. Educational organizations worldwide are recognizing the transformative potential of technology-enhanced learning, leading to substantial investments in digital infrastructure, cloud-based learning platforms, and interactive educational tools. This driver is reinforced by demonstrated improvements in student engagement, learning outcomes, and educational accessibility that digital tools provide. The integration of artificial intelligence, machine learning, and adaptive learning technologies enables personalized educational experiences that adapt to individual student needs, learning styles, and progress rates, creating compelling value propositions for educational institutions seeking to improve academic performance and competitive positioning.
Government Digital Education Initiatives and Policy Support:
Government-led initiatives promoting digital education transformation and substantial public sector investment in educational technology infrastructure serve as crucial market growth catalysts. Governments worldwide are implementing comprehensive digital education strategies, providing funding for device procurement, internet connectivity improvements, and teacher training programs that accelerate digital classroom adoption. Examples include the U.S. federal support for high-speed internet access, India's Digital India initiative promoting educational technology in rural areas, and European Union programs supporting digital skills development. These initiatives create sustained demand for digital classroom solutions while establishing regulatory frameworks that encourage innovation, ensure data privacy, and promote equitable access to educational technology across diverse socioeconomic populations.
Restrain:
High Initial Investment Costs and Implementation Complexity:
The substantial upfront investment required for comprehensive digital classroom implementation creates significant barriers to adoption, particularly for smaller educational institutions and districts with limited budgetary resources. These costs encompass hardware procurement, software licensing, network infrastructure upgrades, teacher training programs, and ongoing technical support services that can strain institutional finances. The complexity of integrating diverse technology solutions, ensuring interoperability between systems, and maintaining data security across multiple platforms presents additional implementation challenges. Many institutions struggle with the total cost of ownership calculations that include not only initial technology investments but also ongoing maintenance, software updates, technical support, and periodic hardware refresh cycles that can significantly impact long-term budgetary planning and resource allocation decisions.
Cybersecurity Concerns and Data Privacy Risks:
Increasing cybersecurity threats and growing concerns about student data privacy create substantial barriers to digital classroom adoption, particularly among institutions handling sensitive personal and academic information. The networked nature of digital learning platforms creates multiple potential entry points for cyber attacks, putting student records, intellectual property, and critical educational infrastructure at risk. Educational institutions face complex regulatory compliance requirements including FERPA, COPPA, and regional data protection laws that mandate specific security measures and data handling procedures. The industry's high-profile nature as a target for ransomware attacks and data breaches has heightened institutional awareness of cybersecurity risks, leading to increased scrutiny of vendor security practices and sometimes resulting in delayed or cancelled technology implementations due to security concerns.
Opportunities:
Artificial Intelligence Integration and Personalized Learning Solutions:
The convergence of artificial intelligence with digital classroom technologies creates substantial opportunities for next-generation educational solutions that provide personalized learning experiences, intelligent tutoring systems, and automated administrative processes. AI-powered platforms can analyze student learning patterns, identify knowledge gaps, and recommend customized content delivery strategies that optimize individual learning outcomes. This integration enables development of adaptive learning systems that adjust difficulty levels in real-time, provide instant feedback, and support diverse learning styles through multimodal content delivery. The opportunity extends to creating AI-driven analytics platforms that provide educators with actionable insights about student performance, engagement levels, and learning progress, enabling data-driven instructional decisions and early intervention strategies for at-risk students.
Emerging Market Penetration and Global Educational Access:
Developing regions across Asia-Pacific, Latin America, Africa, and other emerging markets present significant growth opportunities driven by rapid economic development, increasing internet penetration, and government initiatives promoting educational modernization. These markets offer substantial untapped potential due to growing populations of school-age children, expanding middle-class demographics seeking quality education, and increasing recognition of education's role in economic development. Market penetration opportunities include developing cost-effective, locally-adapted solutions that address specific regional requirements such as multilingual content, offline capabilities for areas with limited connectivity, and mobile-first approaches that leverage smartphone proliferation. The expansion potential is enhanced by international development programs, public-private partnerships, and increasing foreign investment in educational infrastructure that create sustainable market opportunities.
Trends:
Immersive Technology Integration and VR/AR Learning Experiences:
The digital classroom market is experiencing accelerated adoption of virtual reality and augmented reality technologies that create immersive, interactive learning experiences across diverse educational disciplines. VR/AR integration enables students to explore historical sites, conduct virtual science experiments, practice medical procedures, and engage with complex three-dimensional concepts that traditional teaching methods cannot effectively convey. This trend is exemplified by increasing deployment of VR headsets in classrooms, with growth rates reaching 19.56% CAGR to 2030. Educational institutions are piloting immersive science laboratories, language learning simulations, and occupational safety training programs that provide hands-on experience without physical risks or resource constraints. The technology adoption creates opportunities for content developers, hardware manufacturers, and platform providers to create specialized educational applications that enhance learning outcomes through experiential education.
Cloud-First Deployment and 5G Connectivity Enhancement:
The educational technology landscape is undergoing fundamental transformation toward cloud-first deployment strategies and 5G network integration that enable ultra-low latency communications, massive device connectivity, and real-time collaborative learning experiences. Cloud deployment dominance at 66.52% market share reflects institutional preferences for scalable, maintainable solutions that reduce IT infrastructure burdens while providing enhanced accessibility and automatic updates. 5G connectivity supports advanced applications including real-time video collaboration, augmented reality educational content, and IoT-enabled classroom environments that require high-bandwidth, low-latency communications. This trend enables new educational use cases such as remote laboratory access, virtual field trips, and global classroom connections that transcend geographic boundaries while supporting synchronous and asynchronous learning modalities.
Recent Development
In July 2025: ViewSonic Corporation, a prominent international provider of visual and educational technology solutions, has introduced ViewLessons AI Studio to the Indian market, demonstrating its dedication to revolutionizing educational environments through cutting-edge, artificial intelligence-enhanced learning platforms. Given India's substantial student population of over 300 million learners in the K-12 education sector, the country represents an enormous market potential that ViewSonic is addressing through its AI-driven platform featuring more than 900 customizable, standards-aligned educational lessons specifically designed to meet CBSE and ICSE curriculum requirements.
In April 2025: Motzoid India has officially unveiled LearningRO, an innovative artificial intelligence-enhanced educational platform engineered to transform the learning and study experience for learners beginning at age 5, with unlimited upper age boundaries. Established by Dhumik Pravin, an ambitious young entrepreneur and digital innovation specialist, LearningRO integrates advanced artificial intelligence capabilities with United Kingdom-based educational content to deliver enhanced, accelerated, and superior learning experiences.