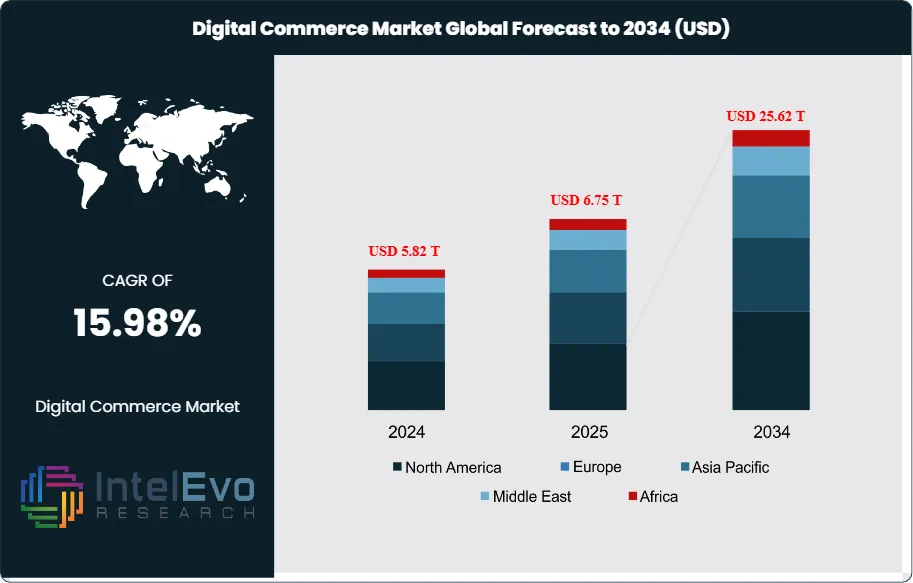
The Digital Commerce Market size is expected to be worth around USD 25.62 trillion by 2034, rising from USD 5.82 trillion in 2024, and expanding at a CAGR of 15.98% during the forecast period from 2024 to 2034. This rapid expansion is driven by the acceleration of mobile commerce, social commerce, and omnichannel retail strategies across both developed and emerging economies. Advances in AI-powered personalization, embedded payments, and cross-border e-commerce platforms are further transforming consumer buying behavior, positioning digital commerce as a core engine of global retail and service sector growth.
The digital commerce market encompasses all online transactions involving the buying and selling of goods and services through digital platforms, including business-to-consumer (B2C), business-to-business (B2B), consumer-to-consumer (C2C), and business-to-government (B2G) models. This comprehensive market includes e-commerce platforms, digital payment systems, mobile commerce applications, social commerce, and emerging technologies that facilitate online transactions.
The digital commerce ecosystem is experiencing unprecedented growth driven by technological advancement, changing consumer behaviors, and global digitalization trends. Key growth accelerators include artificial intelligence integration for personalized shopping experiences, improved digital payment infrastructure, enhanced mobile commerce capabilities, and the proliferation of social commerce platforms. The integration of emerging technologies such as augmented reality, voice commerce, and blockchain security is reshaping how consumers interact with digital commerce platforms.
The Asia-Pacific region dominates digital commerce due to advanced technology, favorable demographics, and strong government support. China leads globally with platforms like Alibaba and Pinduoduo, backed by robust logistics and payment systems. High mobile broadband penetration and next-gen networks fuel mobile commerce, especially in Indonesia and Thailand. Meanwhile, North America excels in enterprise e-commerce and cross-border trade, while Europe emphasizes sustainable practices and strict data privacy standards.
The COVID-19 pandemic served as a significant catalyst for digital commerce adoption, accelerating trends that were already in motion. Lockdowns and social distancing measures forced consumers to shift from traditional retail to online platforms, resulting in permanent behavioral changes. Many businesses rapidly adopted digital commerce solutions to maintain operations, leading to increased market penetration and the emergence of new business models focused on contactless transactions and remote commerce.
Ongoing geopolitical tensions and trade disputes have influenced digital commerce market dynamics, particularly affecting cross-border e-commerce operations. Supply chain disruptions have accelerated the adoption of digital commerce solutions as businesses seek alternative distribution channels. Trade restrictions have led to the emergence of regional digital commerce champions, while data privacy regulations across different jurisdictions continue to shape how digital commerce platforms operate globally.
Key Takeaways
Market Growth: The 3D bioprinting for organ regeneration market is expected to reach USD 25.62 Trillion by 2034, fueled by technological advancement, evolving consumer behaviors, and accelerating global digitalization initiatives across all market segments.
Payment Dominance: Digital wallets lead the payment segment due to their enhanced security features and seamless integration capabilities that enable rapid transaction processing for B2B commerce.
Component Dominance: The solution component dominates because it provides comprehensive, integrated platforms that address multiple business needs simultaneously, offering greater value than standalone services.
Browsing Medium Dominance: Mobile and tablet browsing leads due to increasing demand for on-the-go procurement capabilities and flexible access requirements for modern business users.
Business Type Dominance: B2B transactions naturally dominate in the B2B e-commerce market context, representing the core focus of enterprise procurement activities and complex supply chain relationships.
Industry Vertical Dominance: The automotive industry leads due to its complex supply chain requirements and high-value component procurement needs that drive digital transformation adoption.
Drivers: Key drivers accelerating growth include internet penetration expansion and mobile commerce adoption, which boost market expansion through improved accessibility and user experience.
Restraints: Growth is hindered by cybersecurity concerns and digital divide challenges, which create barriers such as consumer trust issues and limited access in developing regions.
Opportunities: The market is poised for expansion due to opportunities like AI-driven personalization and social commerce integration, which enable enhanced customer experiences and new revenue streams.
Trends: Emerging trends including voice commerce and augmented reality shopping are reshaping the market by creating immersive and convenient shopping experiences.
RegionalAnalysis: Asia-Pacific leads the global digital commerce market through unparalleled digital transformation initiatives, extensive smartphone penetration, and comprehensive government support for financial inclusion and e-commerce development.
Payment Analysis:
The payment landscape in B2B e-commerce reflects evolving financial technology adoption patterns and security considerations. Digital wallets have emerged as the preferred method due to their ability to streamline payment processes while maintaining robust security protocols. Their dominance stems from features like automated recurring payments, multi-currency support, and advanced fraud protection mechanisms that address enterprise-level requirements. Traditional payment methods like card payments and bank transfers remain significant but face challenges in meeting the speed and flexibility demands of modern B2B transactions. The emergence of cryptocurrency payments represents future potential, though current adoption remains limited due to regulatory uncertainty and volatility concerns that make businesses cautious about cryptocurrency integration.
Component Analysis:
The component segmentation reveals a clear preference for comprehensive solution-based approaches over fragmented service offerings. Solutions lead because they provide end-to-end capabilities including procurement management, supplier integration, analytics, and workflow automation through unified platforms. This integrated approach eliminates the complexity of managing multiple vendor relationships and ensures seamless data flow across business processes. Services, while important for specialized requirements and customization needs, represent a smaller market share as businesses increasingly seek platforms that can handle their entire e-commerce ecosystem. The solution-centric trend reflects enterprises' desire to reduce operational complexity while maximizing functionality and return on investment through comprehensive digital transformation initiatives.
Browsing Medium Analysis:
Mobile and Tablets Leads With more than 60% Market Share In Digital Commerce Market: The browsing medium landscape demonstrates the fundamental shift toward mobile-first business operations and flexible work environments. Mobile and tablet dominance reflects modern procurement professionals' need for on-the-go access to supplier catalogs, order management systems, and approval workflows. This trend has been accelerated by remote work adoption and the demand for real-time decision-making capabilities regardless of location. Desktop and laptop usage remains important for complex procurement tasks requiring detailed analysis, bulk ordering, and comprehensive reporting functions. However, the mobile-first approach has driven platform developers to create responsive interfaces that maintain full functionality across devices, ensuring that critical business operations can be conducted efficiently through any medium while preserving user experience quality.
Business Type Analysis:
The business type segmentation naturally favors B2B transactions within the B2B e-commerce market context, representing the core ecosystem of enterprise procurement, supply chain management, and inter-business relationships. B2B dominance stems from higher transaction values, complex approval workflows, and specialized requirements that characterize business purchasing behavior. These transactions involve bulk ordering, customized pricing structures, extended payment terms, and sophisticated integration needs that distinguish them from consumer commerce.
Industry Vertical Analysis:
The automotive industry's leadership in B2B e-commerce adoption reflects its sophisticated supply chain requirements and early digital transformation initiatives. Automotive manufacturers and suppliers operate complex networks requiring precise component sourcing, quality certifications, just-in-time inventory management, and global supplier coordination that make e-commerce platforms essential for operational efficiency. The industry's emphasis on cost optimization, regulatory compliance, and production scheduling drives demand for advanced platform capabilities including real-time inventory tracking, automated ordering systems, and integrated quality management.
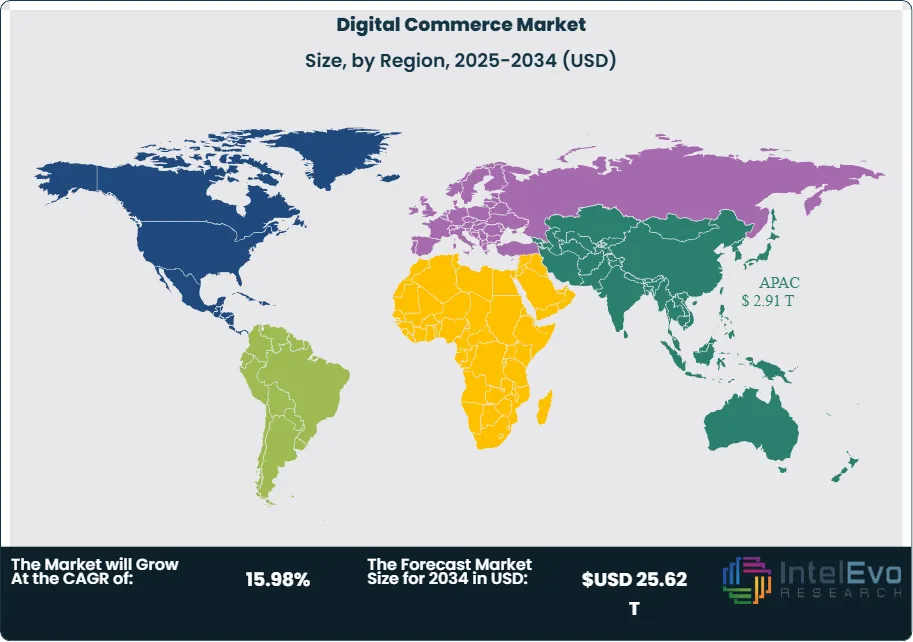
Regional Analysis
Asia-Pacific Leads With over 50% Market Share In Digital Commerce Market: The Asia-Pacific region's digital commerce supremacy stems from a convergence of technological advancement, demographic advantages, and strategic governmental initiatives that have created an exceptionally fertile environment for e-commerce expansion. China serves as the undisputed regional leader, generating the largest share of global e-commerce sales through homegrown technology giants like Alibaba and Pinduoduo, which have developed sophisticated logistics ecosystems and payment platforms specifically tailored to regional consumer preferences and behaviors. The region benefits from superior technological infrastructure, with widespread mobile broadband access significantly exceeding global averages and extensive deployment of next-generation networks that enable seamless mobile commerce experiences. Mobile devices dominate web traffic generation across the region, with countries like Indonesia and Thailand achieving exceptionally high mobile usage rates that have fundamentally transformed consumer engagement with digital platforms.
North America maintains significant market presence through established technology infrastructure and high consumer spending power, with the United States leading in enterprise e-commerce solutions and cross-border trade capabilities. Europe demonstrates strong growth in sustainable e-commerce practices and regulatory compliance, with countries like Germany and the United Kingdom driving innovation in green logistics and data privacy standards.
Latin America represents an emerging market with rapid mobile adoption and increasing internet penetration. Middle East and Africa exhibit significant potential for digital commerce expansion, driven by young populations and increasing smartphone adoption rates, though infrastructure development and regulatory frameworks remain key factors for realizing this potential.
Payment (Cash Payments, Card Payments, Crypto Currency, Digital Wallets, Bank Transfers), Component (Services, Solution), Browsing Medium (Mobile and Tablets, Desktop/laptop), Business Type (Business to Consumer (B2C), Business to Business (B2B)), Industry Vertical (BFSI, Media & entertainment, Manufacturing, Healthcare and pharmaceuticals, Automotive, Retail Household goods, Others)
Research Methodology
Primary Research- 100 Interviews of Stakeholders
Secondary Research
Desk Research
Regional scope
North America (United States, Canada, Mexico)
Latin America (Brazil, Argentina, Columbia)
East Asia And Pacific (China, Japan, South Korea, Australia, Cambodia, Fiji, Indonesia)
Sea And South Asia (India, Singapore, Thailand, Taiwan, Malaysia)
Eastern Europe (Poland, Russia, Czech Republic, Romania)
Western Europe (Germany, U.K., France, Spain, Itlay)
Middle East & Africa (GCC Countries, Egypt, Nigeria, South Africa, Israel)
Competitive Landscape
Alibaba Group Holding Limited, Walmart, Inc., Amazon.com, Inc., Best Buy, The Home Depot, eBay, Inc., Shopify, Inc., JD.com, Inc., Otto GmbH & Co, Rakuten, Inc.
Customization Scope
Customization for segments, region/country-level will be provided. Moreover, additional customization can be done based on the requirements.
Pricing and Purchase Options
Avail customized purchase options to meet your exact research needs. We have three licenses to opt for: Single User License, Multi-User License (Up to 5 Users), Corporate Use License (Unlimited User and Printable PDF).
TABLE OF CONTENTS
1. EXECUTIVE SUMMARY
1.1. MARKET SNAPSHOT
1.2. KEY FINDINGS & INSIGHTS
1.3. ANALYST RECOMMENDATIONS
1.4. FUTURE OUTLOOK
2. RESEARCH METHODOLOGY
2.1. MARKET DEFINITION & SCOPE
2.2. RESEARCH OBJECTIVES: PRIMARY & SECONDARY DATA SOURCES
2.3. DATA COLLECTION SOURCES
2.3.1. COVERAGE OF 100+ PRIMARY RESEARCH/CONSULTATION CALLS WITH INDUSTRY STAKEHOLDERS
FIGURE 17 NORTH AMERICA DIGITAL COMMERCE CURRENT AND FUTURE TYPE ANALYSIS, 2025–2034, (USD MILLION)
FIGURE 18 NORTH AMERICA DIGITAL COMMERCE CURRENT AND FUTURE END USER ANALYSIS, 2025–2034, (USD MILLION)
FIGURE 19 MARKET SHARE BY COUNTRY
FIGURE 20 LATIN AMERICA DIGITAL COMMERCE CURRENT AND FUTURE TYPE ANALYSIS, 2025–2034, (USD MILLION)
FIGURE 21 LATIN AMERICA DIGITAL COMMERCE CURRENT AND FUTURE END USER ANALYSIS, 2025–2034, (USD MILLION)
FIGURE 22 MARKET SHARE BY COUNTRY
FIGURE 23 EASTERN EUROPE DIGITAL COMMERCE CURRENT AND FUTURE TYPE ANALYSIS, 2025–2034, (USD MILLION)
FIGURE 24 EASTERN EUROPE DIGITAL COMMERCE CURRENT AND FUTURE END USER ANALYSIS, 2025–2034, (USD MILLION)
FIGURE 25 MARKET SHARE BY COUNTRY
FIGURE 26 WESTERN EUROPE DIGITAL COMMERCE CURRENT AND FUTURE TYPE ANALYSIS, 2025–2034, (USD MILLION)
FIGURE 27 WESTERN EUROPE DIGITAL COMMERCE CURRENT AND FUTURE END USER ANALYSIS, 2025–2034, (USD MILLION)
FIGURE 28 MARKET SHARE BY COUNTRY
FIGURE 29 EAST ASIA AND PACIFIC DIGITAL COMMERCE CURRENT AND FUTURE TYPE ANALYSIS, 2025–2034, (USD MILLION)
FIGURE 30 EAST ASIA AND PACIFIC DIGITAL COMMERCE CURRENT AND FUTURE END USER ANALYSIS, 2025–2034, (USD MILLION)
FIGURE 31 MARKET SHARE BY COUNTRY
FIGURE 32 SEA AND SOUTH ASIA DIGITAL COMMERCE CURRENT AND FUTURE TYPE ANALYSIS, 2025–2034, (USD MILLION)
FIGURE 33 SEA AND SOUTH ASIA DIGITAL COMMERCE CURRENT AND FUTURE END USER ANALYSIS, 2025–2034, (USD MILLION)
FIGURE 34 MARKET SHARE BY COUNTRY
FIGURE 35 MIDDLE EAST AND AFRICA DIGITAL COMMERCE CURRENT AND FUTURE TYPE ANALYSIS, 2025–2034, (USD MILLION)
FIGURE 36 MIDDLE EAST AND AFRICA DIGITAL COMMERCE CURRENT AND FUTURE END USER ANALYSIS, 2025–2034, (USD MILLION)
FIGURE 37 NORTH AMERICA DIGITAL COMMERCE CURRENT AND FUTURE MARKET VOLUME SHARE REGIONAL ANALYSIS, 2025–2034, (USD MILLION)
FIGURE 38 U.S. DIGITAL COMMERCE CURRENT AND FUTURE TYPE ANALYSIS, 2025–2034, (USD MILLION)
FIGURE 39 U.S. DIGITAL COMMERCE CURRENT AND FUTURE END USER ANALYSIS, 2025–2034, (USD MILLION)
FIGURE 40 CANADA DIGITAL COMMERCE CURRENT AND FUTURE TYPE ANALYSIS, 2025–2034, (USD MILLION)
FIGURE 41 CANADA DIGITAL COMMERCE CURRENT AND FUTURE END USER ANALYSIS, 2025–2034, (USD MILLION)
FIGURE 42 LATIN AMERICA DIGITAL COMMERCE CURRENT AND FUTURE MARKET VOLUME SHARE REGIONAL ANALYSIS, 2025–2034, (USD MILLION)
FIGURE 43 MEXICO DIGITAL COMMERCE CURRENT AND FUTURE TYPE ANALYSIS, 2025–2034, (USD MILLION)
FIGURE 44 MEXICO DIGITAL COMMERCE CURRENT AND FUTURE END USER ANALYSIS, 2025–2034, (USD MILLION)
FIGURE 45 BRAZIL DIGITAL COMMERCE CURRENT AND FUTURE TYPE ANALYSIS, 2025–2034, (USD MILLION)
FIGURE 46 BRAZIL DIGITAL COMMERCE CURRENT AND FUTURE END USER ANALYSIS, 2025–2034, (USD MILLION)
FIGURE 47 ARGENTINA DIGITAL COMMERCE CURRENT AND FUTURE TYPE ANALYSIS, 2025–2034, (USD MILLION)
FIGURE 48 ARGENTINA DIGITAL COMMERCE CURRENT AND FUTURE END USER ANALYSIS, 2025–2034, (USD MILLION)
FIGURE 49 COLUMBIA DIGITAL COMMERCE CURRENT AND FUTURE TYPE ANALYSIS, 2025–2034, (USD MILLION)
FIGURE 50 COLUMBIA DIGITAL COMMERCE CURRENT AND FUTURE END USER ANALYSIS, 2025–2034, (USD MILLION)
FIGURE 51 REST OF LATIN AMERICA DIGITAL COMMERCE CURRENT AND FUTURE TYPE ANALYSIS, 2025–2034, (USD MILLION)
FIGURE 52 REST OF LATIN AMERICA DIGITAL COMMERCE CURRENT AND FUTURE END USER ANALYSIS, 2025–2034, (USD MILLION)
FIGURE 53 EASTERN EUROPE DIGITAL COMMERCE CURRENT AND FUTURE MARKET VOLUME SHARE REGIONAL ANALYSIS, 2025–2034, (USD MILLION)
FIGURE 54 POLAND DIGITAL COMMERCE CURRENT AND FUTURE TYPE ANALYSIS, 2025–2034, (USD MILLION)
FIGURE 55 POLAND DIGITAL COMMERCE CURRENT AND FUTURE END USER ANALYSIS, 2025–2034, (USD MILLION)
FIGURE 56 RUSSIA DIGITAL COMMERCE CURRENT AND FUTURE TYPE ANALYSIS, 2025–2034, (USD MILLION)
FIGURE 57 RUSSIA DIGITAL COMMERCE CURRENT AND FUTURE END USER ANALYSIS, 2025–2034, (USD MILLION)
FIGURE 58 CZECH REPUBLIC DIGITAL COMMERCE CURRENT AND FUTURE TYPE ANALYSIS, 2025–2034, (USD MILLION)
FIGURE 59 CZECH REPUBLIC DIGITAL COMMERCE CURRENT AND FUTURE END USER ANALYSIS, 2025–2034, (USD MILLION)
FIGURE 60 ROMANIA DIGITAL COMMERCE CURRENT AND FUTURE TYPE ANALYSIS, 2025–2034, (USD MILLION)
FIGURE 61 ROMANIA DIGITAL COMMERCE CURRENT AND FUTURE END USER ANALYSIS, 2025–2034, (USD MILLION)
FIGURE 62 REST OF EASTERN EUROPE DIGITAL COMMERCE CURRENT AND FUTURE TYPE ANALYSIS, 2025–2034, (USD MILLION)
FIGURE 63 REST OF EASTERN EUROPE DIGITAL COMMERCE CURRENT AND FUTURE END USER ANALYSIS, 2025–2034, (USD MILLION)
FIGURE 64 WESTERN EUROPE DIGITAL COMMERCE CURRENT AND FUTURE MARKET VOLUME SHARE REGIONAL ANALYSIS, 2025–2034, (USD MILLION)
FIGURE 65 GERMANY DIGITAL COMMERCE CURRENT AND FUTURE TYPE ANALYSIS, 2025–2034, (USD MILLION)
FIGURE 66 GERMANY DIGITAL COMMERCE CURRENT AND FUTURE END USER ANALYSIS, 2025–2034, (USD MILLION)
FIGURE 67 FRANCE DIGITAL COMMERCE CURRENT AND FUTURE TYPE ANALYSIS, 2025–2034, (USD MILLION)
FIGURE 68 FRANCE DIGITAL COMMERCE CURRENT AND FUTURE END USER ANALYSIS, 2025–2034, (USD MILLION)
FIGURE 69 UK DIGITAL COMMERCE CURRENT AND FUTURE TYPE ANALYSIS, 2025–2034, (USD MILLION)
FIGURE 70 UK DIGITAL COMMERCE CURRENT AND FUTURE END USER ANALYSIS, 2025–2034, (USD MILLION)
FIGURE 71 SPAIN DIGITAL COMMERCE CURRENT AND FUTURE TYPE ANALYSIS, 2025–2034, (USD MILLION)
FIGURE 72 SPAIN DIGITAL COMMERCE CURRENT AND FUTURE END USER ANALYSIS, 2025–2034, (USD MILLION)
FIGURE 73 ITALY DIGITAL COMMERCE CURRENT AND FUTURE TYPE ANALYSIS, 2025–2034, (USD MILLION)
FIGURE 74 ITALY DIGITAL COMMERCE CURRENT AND FUTURE END USER ANALYSIS, 2025–2034, (USD MILLION)
FIGURE 75 REST OF WESTERN EUROPE DIGITAL COMMERCE CURRENT AND FUTURE TYPE ANALYSIS, 2025–2034, (USD MILLION)
FIGURE 76 REST OF WESTERN EUROPE DIGITAL COMMERCE CURRENT AND FUTURE END USER ANALYSIS, 2025–2034, (USD MILLION)
FIGURE 77 EAST ASIA AND PACIFIC DIGITAL COMMERCE CURRENT AND FUTURE MARKET VOLUME SHARE REGIONAL ANALYSIS, 2025–2034, (USD MILLION)
FIGURE 78 CHINA DIGITAL COMMERCE CURRENT AND FUTURE TYPE ANALYSIS, 2025–2034, (USD MILLION)
FIGURE 79 CHINA DIGITAL COMMERCE CURRENT AND FUTURE END USER ANALYSIS, 2025–2034, (USD MILLION)
FIGURE 80 JAPAN DIGITAL COMMERCE CURRENT AND FUTURE TYPE ANALYSIS, 2025–2034, (USD MILLION)
FIGURE 81 JAPAN DIGITAL COMMERCE CURRENT AND FUTURE END USER ANALYSIS, 2025–2034, (USD MILLION)
FIGURE 82 AUSTRALIA DIGITAL COMMERCE CURRENT AND FUTURE TYPE ANALYSIS, 2025–2034, (USD MILLION)
FIGURE 83 AUSTRALIA DIGITAL COMMERCE CURRENT AND FUTURE END USER ANALYSIS, 2025–2034, (USD MILLION)
FIGURE 84 CAMBODIA DIGITAL COMMERCE CURRENT AND FUTURE TYPE ANALYSIS, 2025–2034, (USD MILLION)
FIGURE 85 CAMBODIA DIGITAL COMMERCE CURRENT AND FUTURE END USER ANALYSIS, 2025–2034, (USD MILLION)
FIGURE 86 FIJI DIGITAL COMMERCE CURRENT AND FUTURE TYPE ANALYSIS, 2025–2034, (USD MILLION)
FIGURE 87 FIJI DIGITAL COMMERCE CURRENT AND FUTURE END USER ANALYSIS, 2025–2034, (USD MILLION)
FIGURE 88 INDONESIA DIGITAL COMMERCE CURRENT AND FUTURE TYPE ANALYSIS, 2025–2034, (USD MILLION)
FIGURE 89 INDONESIA DIGITAL COMMERCE CURRENT AND FUTURE END USER ANALYSIS, 2025–2034, (USD MILLION)
FIGURE 90 SOUTH KOREA DIGITAL COMMERCE CURRENT AND FUTURE TYPE ANALYSIS, 2025–2034, (USD MILLION)
FIGURE 91 SOUTH KOREA DIGITAL COMMERCE CURRENT AND FUTURE END USER ANALYSIS, 2025–2034, (USD MILLION)
FIGURE 92 REST OF EAST ASIA AND PACIFIC DIGITAL COMMERCE CURRENT AND FUTURE TYPE ANALYSIS, 2025–2034, (USD MILLION)
FIGURE 93 REST OF EAST ASIA AND PACIFIC DIGITAL COMMERCE CURRENT AND FUTURE END USER ANALYSIS, 2025–2034, (USD MILLION)
FIGURE 94 SEA AND SOUTH ASIA DIGITAL COMMERCE CURRENT AND FUTURE MARKET VOLUME SHARE REGIONAL ANALYSIS, 2025–2034, (USD MILLION)
FIGURE 95 BANGLADESH DIGITAL COMMERCE CURRENT AND FUTURE TYPE ANALYSIS, 2025–2034, (USD MILLION)
FIGURE 96 BANGLADESH DIGITAL COMMERCE CURRENT AND FUTURE END USER ANALYSIS, 2025–2034, (USD MILLION)
FIGURE 97 NEW ZEALAND DIGITAL COMMERCE CURRENT AND FUTURE TYPE ANALYSIS, 2025–2034, (USD MILLION)
FIGURE 98 NEW ZEALAND DIGITAL COMMERCE CURRENT AND FUTURE END USER ANALYSIS, 2025–2034, (USD MILLION)
FIGURE 99 INDIA DIGITAL COMMERCE CURRENT AND FUTURE TYPE ANALYSIS, 2025–2034, (USD MILLION)
FIGURE 100 INDIA DIGITAL COMMERCE CURRENT AND FUTURE END USER ANALYSIS, 2025–2034, (USD MILLION)
FIGURE 101 SINGAPORE DIGITAL COMMERCE CURRENT AND FUTURE TYPE ANALYSIS, 2025–2034, (USD MILLION)
FIGURE 102 SINGAPORE DIGITAL COMMERCE CURRENT AND FUTURE END USER ANALYSIS, 2025–2034, (USD MILLION)
FIGURE 103 THAILAND DIGITAL COMMERCE CURRENT AND FUTURE TYPE ANALYSIS, 2025–2034, (USD MILLION)
FIGURE 104 THAILAND DIGITAL COMMERCE CURRENT AND FUTURE END USER ANALYSIS, 2025–2034, (USD MILLION)
FIGURE 105 TAIWAN DIGITAL COMMERCE CURRENT AND FUTURE TYPE ANALYSIS, 2025–2034, (USD MILLION)
FIGURE 106 TAIWAN DIGITAL COMMERCE CURRENT AND FUTURE END USER ANALYSIS, 2025–2034, (USD MILLION)
FIGURE 107 MALAYSIA DIGITAL COMMERCE CURRENT AND FUTURE TYPE ANALYSIS, 2025–2034, (USD MILLION)
FIGURE 108 MALAYSIA DIGITAL COMMERCE CURRENT AND FUTURE END USER ANALYSIS, 2025–2034, (USD MILLION)
FIGURE 109 REST OF SEA AND SOUTH ASIA DIGITAL COMMERCE CURRENT AND FUTURE TYPE ANALYSIS, 2025–2034, (USD MILLION)
FIGURE 110 REST OF SEA AND SOUTH ASIA DIGITAL COMMERCE CURRENT AND FUTURE END USER ANALYSIS, 2025–2034, (USD MILLION)
FIGURE 111 MIDDLE EAST AND AFRICA DIGITAL COMMERCE CURRENT AND FUTURE MARKET VOLUME SHARE REGIONAL ANALYSIS, 2025–2034, (USD MILLION)
FIGURE 112 GCC COUNTRIES DIGITAL COMMERCE CURRENT AND FUTURE TYPE ANALYSIS, 2025–2034, (USD MILLION)
FIGURE 113 GCC COUNTRIES DIGITAL COMMERCE CURRENT AND FUTURE END USER ANALYSIS, 2025–2034, (USD MILLION)
FIGURE 114 SAUDI ARABIA DIGITAL COMMERCE CURRENT AND FUTURE TYPE ANALYSIS, 2025–2034, (USD MILLION)
FIGURE 115 SAUDI ARABIA DIGITAL COMMERCE CURRENT AND FUTURE END USER ANALYSIS, 2025–2034, (USD MILLION)
FIGURE 116 UAE DIGITAL COMMERCE CURRENT AND FUTURE TYPE ANALYSIS, 2025–2034, (USD MILLION)
FIGURE 117 UAE DIGITAL COMMERCE CURRENT AND FUTURE END USER ANALYSIS, 2025–2034, (USD MILLION)
FIGURE 118 BAHRAIN DIGITAL COMMERCE CURRENT AND FUTURE TYPE ANALYSIS, 2025–2034, (USD MILLION)
FIGURE 119 BAHRAIN DIGITAL COMMERCE CURRENT AND FUTURE END USER ANALYSIS, 2025–2034, (USD MILLION)
FIGURE 120 KUWAIT DIGITAL COMMERCE CURRENT AND FUTURE TYPE ANALYSIS, 2025–2034, (USD MILLION)
FIGURE 121 KUWAIT DIGITAL COMMERCE CURRENT AND FUTURE END USER ANALYSIS, 2025–2034, (USD MILLION)
FIGURE 122 OMAN DIGITAL COMMERCE CURRENT AND FUTURE TYPE ANALYSIS, 2025–2034, (USD MILLION)
FIGURE 123 OMAN DIGITAL COMMERCE CURRENT AND FUTURE END USER ANALYSIS, 2025–2034, (USD MILLION)
FIGURE 124 QATAR DIGITAL COMMERCE CURRENT AND FUTURE TYPE ANALYSIS, 2025–2034, (USD MILLION)
FIGURE 125 QATAR DIGITAL COMMERCE CURRENT AND FUTURE END USER ANALYSIS, 2025–2034, (USD MILLION)
FIGURE 126 EGYPT DIGITAL COMMERCE CURRENT AND FUTURE TYPE ANALYSIS, 2025–2034, (USD MILLION)
FIGURE 127 EGYPT DIGITAL COMMERCE CURRENT AND FUTURE END USER ANALYSIS, 2025–2034, (USD MILLION)
FIGURE 128 NIGERIA DIGITAL COMMERCE CURRENT AND FUTURE TYPE ANALYSIS, 2025–2034, (USD MILLION)
FIGURE 129 NIGERIA DIGITAL COMMERCE CURRENT AND FUTURE END USER ANALYSIS, 2025–2034, (USD MILLION)
FIGURE 130 SOUTH AFRICA DIGITAL COMMERCE CURRENT AND FUTURE TYPE ANALYSIS, 2025–2034, (USD MILLION)
FIGURE 131 SOUTH AFRICA DIGITAL COMMERCE CURRENT AND FUTURE END USER ANALYSIS, 2025–2034, (USD MILLION)
FIGURE 132 ISRAEL DIGITAL COMMERCE CURRENT AND FUTURE TYPE ANALYSIS, 2025–2034, (USD MILLION)
FIGURE 133 ISRAEL DIGITAL COMMERCE CURRENT AND FUTURE END USER ANALYSIS, 2025–2034, (USD MILLION)
FIGURE 134 REST OF MEA DIGITAL COMMERCE CURRENT AND FUTURE TYPE ANALYSIS, 2025–2034, (USD MILLION)
FIGURE 135 REST OF MEA DIGITAL COMMERCE CURRENT AND FUTURE END USER ANALYSIS, 2025–2034, (USD MILLION)
FIGURE 136 U. S. MARKET SHARE ANALYSIS BY TYPE (2024)
FIGURE 137 U. S. MARKET SHARE ANALYSIS BY END USER (2024)
FIGURE 138 CANADA MARKET SHARE ANALYSIS BY TYPE (2024)
FIGURE 139 CANADA MARKET SHARE ANALYSIS BY END USER (2024)
FIGURE 140 MEXICO MARKET SHARE ANALYSIS BY TYPE (2024)
FIGURE 141 MEXICO MARKET SHARE ANALYSIS BY END USER (2024)
FIGURE 142 CHINA MARKET SHARE ANALYSIS BY TYPE (2024)
FIGURE 143 CHINA MARKET SHARE ANALYSIS BY END USER (2024)
FIGURE 144 JAPAN MARKET SHARE ANALYSIS BY TYPE (2024)
FIGURE 145 JAPAN MARKET SHARE ANALYSIS BY END USER (2024)
FIGURE 146 INDIA MARKET SHARE ANALYSIS BY TYPE (2024)
FIGURE 147 INDIA MARKET SHARE ANALYSIS BY END USER (2024)
FIGURE 148 SOUTH KOREA MARKET SHARE ANALYSIS BY TYPE (2024)
FIGURE 149 SOUTH KOREA MARKET SHARE ANALYSIS BY END USER (2024)
FIGURE 150 SAUDI ARABIA MARKET SHARE ANALYSIS BY TYPE (2024)
FIGURE 151 SAUDI ARABIA MARKET SHARE ANALYSIS BY END USER (2024)
FIGURE 152 UAE MARKET SHARE ANALYSIS BY TYPE (2024)
FIGURE 153 UAE MARKET SHARE ANALYSIS BY END USER (2024)
FIGURE 154 EGYPT MARKET SHARE ANALYSIS BY TYPE (2024)
FIGURE 155 EGYPT MARKET SHARE ANALYSIS BY END USER (2024)
FIGURE 156 NIGERIA MARKET SHARE ANALYSIS BY TYPE (2024)
FIGURE 157 NIGERIA MARKET SHARE ANALYSIS BY END USER (2024)
FIGURE 158 SOUTH AFRICA MARKET SHARE ANALYSIS BY TYPE (2024)
FIGURE 159 SOUTH AFRICA MARKET SHARE ANALYSIS BY END USER (2024)
FIGURE 160 GERMANY MARKET SHARE ANALYSIS BY TYPE (2024)
FIGURE 161 GERMANY MARKET SHARE ANALYSIS BY END USER (2024)
FIGURE 162 FRANCE MARKET SHARE ANALYSIS BY TYPE (2024)
FIGURE 163 FRANCE MARKET SHARE ANALYSIS BY END USER (2024)
FIGURE 164 UK MARKET SHARE ANALYSIS BY TYPE (2024)
FIGURE 165 UK MARKET SHARE ANALYSIS BY END USER (2024)
FIGURE 166 SPAIN MARKET SHARE ANALYSIS BY TYPE (2024)
FIGURE 167 SPAIN MARKET SHARE ANALYSIS BY END USER (2024)
FIGURE 168 ITALY MARKET SHARE ANALYSIS BY TYPE (2024)
FIGURE 169 ITALY MARKET SHARE ANALYSIS BY END USER (2024)
FIGURE 170 BRAZIL MARKET SHARE ANALYSIS BY TYPE (2024)
FIGURE 171 BRAZIL MARKET SHARE ANALYSIS BY END USER (2024)
FIGURE 172 ARGENTINA MARKET SHARE ANALYSIS BY TYPE (2024)
FIGURE 173 ARGENTINA MARKET SHARE ANALYSIS BY END USER (2024)
FIGURE 174 COLUMBIA MARKET SHARE ANALYSIS BY TYPE (2024)
FIGURE 175 COLUMBIA MARKET SHARE ANALYSIS BY END USER (2024)
FIGURE 176 GLOBAL DIGITAL COMMERCE CURRENT AND FUTURE MARKET KEY COUNTRY LEVEL ANALYSIS, 2024–2034, (USD MILLION)
FIGURE 177 FINANCIAL OVERVIEW:
Key Players Analysis
Amazon.com Inc.: Amazon maintains its position as the global digital commerce leader with over 10% traffic share among global B2C marketplaces, leveraging comprehensive logistics infrastructure, advanced recommendation algorithms, and diverse product offerings. The company's competitive advantages include Prime membership ecosystem, cloud computing services integration, and continuous innovation in delivery technologies including drone delivery and same-day shipping. Amazon's marketplace model enables third-party sellers while maintaining quality control and customer service standards. Strategic expansion into emerging markets and development of private label products strengthen market position. Investment in artificial intelligence, machine learning, and voice commerce through Alexa creates additional competitive moats and customer engagement opportunities.
Alibaba Group: Alibaba dominates the Asian digital commerce market through integrated ecosystems combining e-commerce, digital payments, cloud computing, and logistics services. The company's strength lies in connecting manufacturers directly with global buyers through B2B platforms while serving consumers through B2C marketplaces. Advanced mobile payment systems and financial services integration create seamless shopping experiences and customer loyalty. Strategic partnerships with local companies facilitate international expansion while maintaining cultural relevance. Investment in emerging technologies including artificial intelligence, blockchain, and Internet of Things creates competitive advantages and new revenue streams. The company's Super App strategy integrates multiple services within single platforms, increasing user engagement and lifetime value.
Shopify Inc.: Shopify serves as the leading platform enabling small and medium-sized businesses to create and manage digital commerce operations without significant technical expertise. The company's competitive advantage lies in user-friendly interfaces, comprehensive feature sets, and scalable pricing models that grow with business needs. Integration capabilities with multiple payment processors, shipping providers, and marketing tools create complete business solutions. Strong developer ecosystem and app marketplace extend platform functionality while creating additional revenue streams. Focus on international expansion and support for multiple currencies and languages addresses global market opportunities. Investment in AI-powered features and automation tools helps merchants optimize operations and improve customer experiences.
Walmart Inc.: Walmart leverages extensive physical retail infrastructure to create omnichannel digital commerce experiences combining online ordering with in-store pickup and delivery services. The company's competitive strength includes established supplier relationships, logistics expertise, and brand recognition that translates effectively to digital channels. Strategic acquisitions of specialized e-commerce companies expand category expertise and technological capabilities. Investment in automation technologies and fulfillment center optimization improves efficiency and delivery speed to compete with pure-play digital commerce platforms. Focus on grocery e-commerce and everyday essentials creates competitive differentiation and customer retention advantages. Integration of digital and physical shopping experiences provides unique value propositions unavailable to online-only competitors.
Market Key Players
Alibaba Group Holding Limited
Walmart, Inc.
Amazon.com, Inc.
Best Buy
The Home Depot
eBay, Inc.
Shopify, Inc.
JD.com, Inc.
Otto GmbH & Co
Rakuten, Inc.
Drivers
Internet Penetration and Mobile Commerce Expansion:
Internet penetration continues expanding globally, creating new market opportunities for digital commerce platforms to reach previously unserved populations. Mobile commerce specifically drives growth through smartphone proliferation, improved mobile internet infrastructure, and user-friendly mobile applications that simplify online shopping experiences. The shift toward mobile-first commerce strategies enables businesses to capture consumer attention during micro-moments throughout the day, increasing transaction frequency and customer engagement. Enhanced mobile payment systems, including digital wallets and one-click purchasing, reduce friction in the buying process and improve conversion rates. 5G network deployment further accelerates mobile commerce adoption by enabling faster loading times, high-quality product visualizations, and seamless streaming of product demonstrations. This driver creates opportunities for businesses to develop innovative mobile commerce solutions and reach global audiences with minimal physical infrastructure investment.
Artificial Intelligence and Personalization Technologies:
Artificial intelligence integration transforms digital commerce through personalized shopping experiences, predictive analytics, and automated customer service solutions. Machine learning algorithms analyze consumer behavior patterns to provide targeted product recommendations, optimize pricing strategies, and predict demand fluctuations. AI-powered chatbots and virtual assistants improve customer support efficiency while reducing operational costs for businesses. Personalization technologies increase customer satisfaction and loyalty by delivering relevant product suggestions, customized marketing messages, and tailored user interfaces. Computer vision and natural language processing enable advanced search capabilities, visual product discovery, and voice-activated shopping experiences. These technologies create competitive advantages for early adopters while establishing new standards for customer experience expectations across the industry.
Restraints
Cybersecurity Concerns and Data Privacy Issues:
Cybersecurity threats pose significant challenges to digital commerce growth, as high-profile data breaches erode consumer confidence in online transactions. Sophisticated cyberattacks targeting payment systems, customer databases, and platform infrastructure create financial losses and reputation damage for businesses. Compliance with evolving data privacy regulations across different jurisdictions requires substantial investment in security infrastructure and legal expertise. Small and medium-sized enterprises face particular challenges in implementing comprehensive cybersecurity measures due to limited resources and technical expertise. Consumer concerns about personal information misuse, identity theft, and financial fraud create barriers to adoption, particularly among older demographics and in regions with limited digital literacy. The cost of implementing robust security measures can be prohibitive for emerging businesses, while the consequences of security failures can be catastrophic for established companies.
Digital Divide and Infrastructure Limitations:
The digital divide between developed and developing regions creates unequal access to digital commerce opportunities, limiting market expansion potential. Inadequate internet infrastructure, unreliable electricity supply, and limited access to banking services prevent large populations from participating in digital commerce ecosystems. Rural areas and low-income communities face particular challenges in accessing high-speed internet connections necessary for seamless online shopping experiences. Language barriers and cultural differences in digital adoption rates create additional obstacles for global digital commerce platforms. Educational gaps in digital literacy prevent some consumers from fully utilizing available digital commerce tools and services. Infrastructure limitations also affect logistics and delivery capabilities, particularly in remote areas where last-mile delivery remains challenging and expensive.
Opportunities
Emerging Market Expansion and Financial Inclusion:
Emerging markets present substantial growth opportunities for digital commerce platforms through expanding middle-class populations, increasing smartphone adoption, and government initiatives supporting digital transformation. Financial inclusion programs introducing digital payment systems to unbanked populations create new customer bases for digital commerce platforms. Microfinance integration and buy-now-pay-later services make products accessible to price-sensitive consumers, expanding market reach. Local partnership strategies help international companies navigate regulatory requirements and cultural preferences while building consumer trust. Educational initiatives promoting digital literacy accelerate market adoption and create long-term growth potential. The opportunity extends beyond traditional retail to include digital services, educational content, and healthcare solutions delivered through digital commerce platforms.
Social Commerce and Influencer Marketing Integration:
Social commerce represents a rapidly growing opportunity as social media platforms integrate shopping functionalities directly into user experiences. Influencer marketing collaboration creates authentic product endorsements and drives consumer purchasing decisions through trusted recommendations. Live streaming commerce, particularly popular in Asian markets, combines entertainment with shopping experiences to increase engagement and conversion rates. User-generated content and peer reviews build social proof and community-driven shopping experiences. Brand partnerships with social media platforms create new advertising opportunities and customer acquisition channels. The integration of social features into traditional e-commerce platforms helps build customer communities and increase lifetime value through enhanced engagement and loyalty programs.
Trends
Voice Commerce and Conversational Shopping:
Voice commerce emerges as a transformative trend, enabling consumers to make purchases through voice-activated devices and smart speakers. Natural language processing improvements make voice-based product searches more accurate and intuitive, reducing friction in the shopping process. Integration with smart home devices creates opportunities for automated reordering of household essentials and consumables. Voice-activated customer service provides instant support and order tracking capabilities, improving overall customer experience. The trend extends to voice-enabled mobile applications and automotive commerce systems, creating new touchpoints for consumer engagement. Businesses invest in voice optimization strategies and conversational AI technologies to capture this growing market segment and differentiate their offerings from traditional text-based interfaces.
Augmented Reality and Virtual Shopping Experiences:
Augmented reality technology revolutionizes online shopping by enabling virtual product trials, reducing return rates, and improving customer satisfaction. Virtual showrooms and 3D product visualization help consumers make informed purchasing decisions without physical interaction with products. AR-powered try-on experiences for fashion, cosmetics, and home furnishing items bridge the gap between online and in-store shopping experiences. Virtual reality integration creates immersive brand experiences and entertainment-driven shopping environments. The technology particularly benefits categories where fit, appearance, and spatial relationships are important purchase considerations. Investment in AR/VR capabilities becomes a competitive necessity as consumer expectations evolve and technology costs decrease, making implementation more accessible for smaller businesses.
Recent Development
In July 2025: Amazon has introduced a groundbreaking artificial intelligence feature called "Interests" that fundamentally transforms how customers discover products on the world's largest e-commerce platform. This innovative tool represents a significant leap from traditional search-based shopping experiences, offering a proactive, personalized approach to product discovery that works continuously on behalf of users.
In December 2025: Wix has introduced an innovative artificial intelligence solution called AI Site-Chat, a sophisticated virtual assistant designed to transform how businesses interact with website visitors through automated, intelligent customer service capabilities. This cutting-edge technology enables companies to maintain seamless communication with potential customers regardless of time zones or business hours, creating an always-available support system that operates independently of human intervention.
Frequently Asked Questions
How big is the Digital Commerce Market?
Explore the booming Digital Commerce Market, projected to grow from USD 5.82 Trillion in 2024 to USD 25.62 Trillion by 2034, at a CAGR of 15.98%. Key trends & insights inside.
Who are the major players in the Digital Commerce Market?
Alibaba Group Holding Limited, Walmart, Inc., Amazon.com, Inc., Best Buy, The Home Depot, eBay, Inc., Shopify, Inc., JD.com, Inc., Otto GmbH & Co, Rakuten, Inc.
Which segments covered the Digital Commerce Market?
Payment (Cash Payments, Card Payments, Crypto Currency, Digital Wallets, Bank Transfers), Component (Services, Solution), Browsing Medium (Mobile and Tablets, Desktop/laptop), Business Type (Business to Consumer (B2C), Business to Business (B2B)), Industry Vertical (BFSI, Media & entertainment, Manufacturing, Healthcare and pharmaceuticals, Automotive, Retail Household goods, Others)
How can this market research report help my business make strategic decisions?
Our market research reports provide actionable intelligence, including verified market size data, CAGR projections, competitive benchmarking, and segment-level opportunity analysis. These insights support strategic planning, investment decisions, product development, and market entry strategies for enterprises and startups alike.
How frequently is the data updated?
We continuously monitor industry developments and update our reports to reflect regulatory changes, technological advancements, and macroeconomic shifts. Updated editions ensure you receive the latest market intelligence.