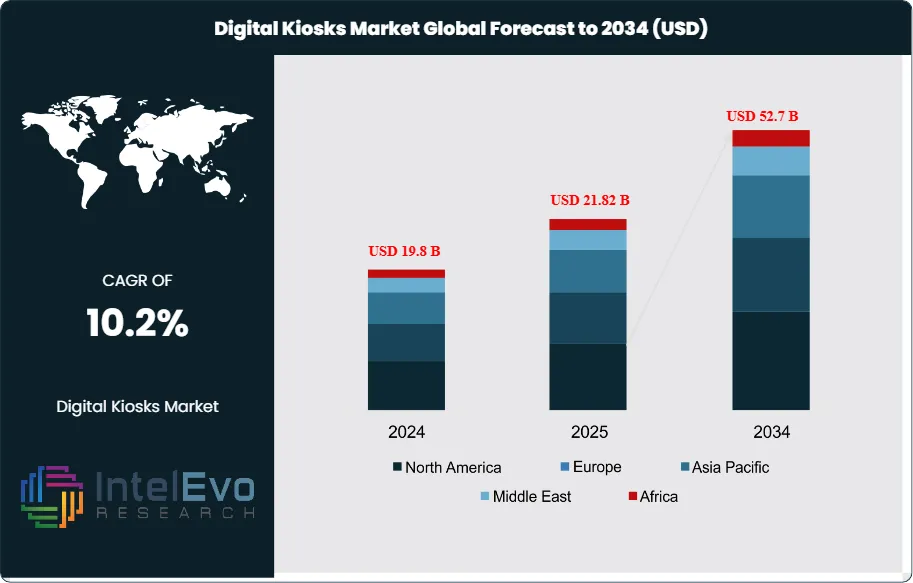
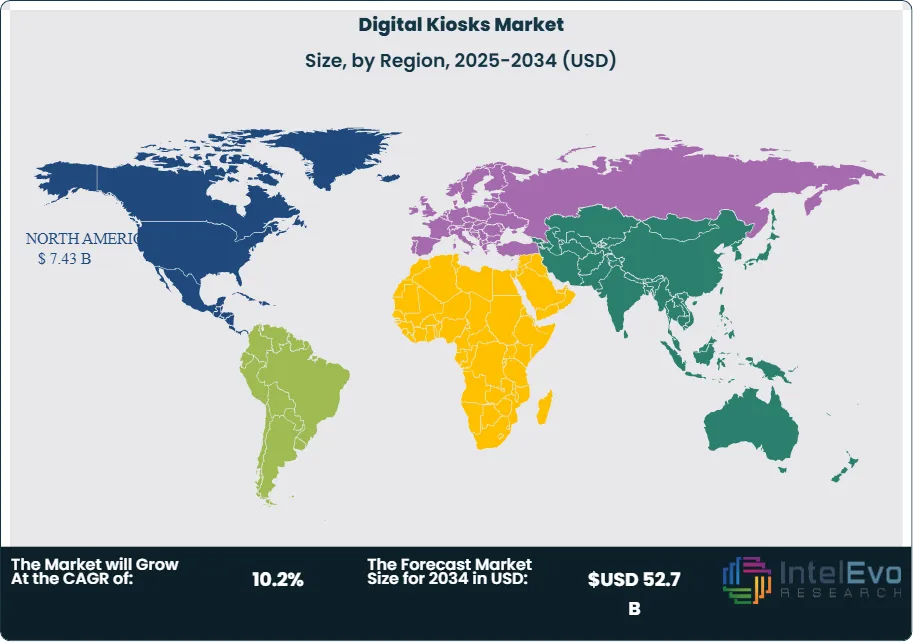
The Digital Kiosks Market is projected to be worth around USD 52.7 Billion by 2034, up from USD 19.8 Billion in 2024, growing at a CAGR of 10.2% during the forecast period from 2024 to 2034. The digital kiosks market encompasses a wide range of interactive, self-service terminals equipped with digital displays, touchscreens, and integrated software that enable users to access information, conduct transactions, and engage with services autonomously.
These kiosks are deployed across retail, banking, healthcare, transportation, hospitality, government, and education sectors, serving as self-checkout stations, ticketing machines, information points, wayfinding systems, and more. The market represents a transformative shift in customer engagement and operational efficiency, allowing organizations to deliver 24/7 service, reduce labor costs, and enhance user experience through automation and digital interaction.
The digital kiosks market is experiencing robust growth driven by the rapid adoption of digital transformation strategies, the proliferation of contactless and cashless transactions, and the increasing demand for personalized, on-demand services. Key growth catalysts include advances in touchscreen technology, integration with cloud and IoT platforms, and the expansion of omnichannel retail and smart city initiatives. The market benefits from ongoing innovation in kiosk hardware, software, and analytics, enabling organizations to deploy scalable, secure, and data-driven solutions that improve service delivery and operational insights.
North America and Europe dominate the global digital kiosks market, with leadership stemming from high digital adoption, advanced infrastructure, and a strong presence of leading technology vendors and enterprises. Asia-Pacific represents the fastest-growing regional market, driven by rapid urbanization, rising disposable incomes, and increasing investments in smart infrastructure and digital services.
The COVID-19 pandemic fundamentally accelerated the adoption of digital kiosks as organizations sought to minimize physical contact, manage surges in service demand, and support remote or unmanned operations. The crisis highlighted the scalability, flexibility, and resilience of digital kiosks, spurring investment in contactless payment, health screening, and self-service solutions. Rising concerns about data privacy, device security, and accessibility have significantly influenced the market, creating opportunities for vendors to differentiate through secure, compliant, and user-friendly kiosk solutions. The market is also witnessing increased demand for industry-specific kiosks, modular designs, and integration with mobile and cloud platforms.
Key Takeaways
Market Growth: The Digital Kiosks Market is expected to reach USD 52.7 Billion by 2034, fueled by digital transformation, advances in kiosk technology, and the demand for automated, contactless service.
Deployment Dominance: Interactive self-service kiosks lead market share due to their versatility, scalability, and rapid deployment capabilities.
End-Use Dominance: Retail and transportation applications account for the majority of kiosk deployments, but healthcare, banking, and government use cases are growing rapidly.
Industry Vertical Dominance: Retail, transportation, and healthcare are the leading sectors, driven by high user interaction volumes and the need for efficient, personalized service.
Driver: Key drivers accelerating growth include advances in touchscreen and IoT integration, the proliferation of contactless transactions, and the need for 24/7, unmanned service delivery.
Restraint: Growth is hindered by device security concerns, integration complexity, and challenges in accessibility and user adoption.
Opportunity: The market is poised for expansion due to opportunities like industry-specific solutions, modular kiosk platforms, and integration with mobile and cloud services.
Trend: Emerging trends including AI-powered kiosks, biometric authentication, and data-driven personalization are reshaping the market by enabling smarter, more secure, and context-aware interactions.
Regional Analysis: North America and Europe lead owing to advanced infrastructure and enterprise adoption. Asia-Pacific shows high promise due to rapid urbanization and digitalization.
Deployment Analysis:
Interactive Self-Service Kiosks Lead With Over 60% Market Share in the Digital Kiosks Market: Interactive self-service kiosks remain the cornerstone of the digital kiosks market. These solutions offer organizations scalability, flexibility, and rapid deployment, enabling them to serve global audiences and handle fluctuating service volumes. Self-service deployment allows for continuous updates, integration with third-party APIs, and access to advanced analytics without the need for significant on-premises infrastructure. On-premises kiosks are preferred in highly regulated industries such as banking and healthcare, where data privacy, security, and compliance are paramount. Hybrid deployments are also gaining traction, allowing organizations to balance control and scalability. The dominance of interactive kiosks is reinforced by the proliferation of SaaS platforms, the rise of modular hardware, and the increasing demand for omnichannel engagement across physical and digital touchpoints.
End-Use Analysis:
Retail and Transportation Dominate, But Healthcare and Government Use Are Rising : Retail and transportation remain the largest end-use segments for digital kiosks, accounting for a significant share of global deployments. Organizations leverage kiosks for self-checkout, ticketing, wayfinding, and information dissemination, reducing wait times, lowering operational costs, and enhancing customer satisfaction. Healthcare applications are experiencing rapid growth, with kiosks used for patient check-in, appointment scheduling, health screening, and information delivery. Digital kiosks improve efficiency, reduce administrative burden, and support contactless service in clinics and hospitals. Banking and government use cases—including ATM services, bill payment, license renewal, and public information—are expanding as organizations seek to improve accessibility, streamline workflows, and support digital inclusion.
Industry Vertical Analysis:
Retail, Transportation, and Healthcare Lead Adoption: The retail sector leads the digital kiosks market, driven by the need for efficient, personalized, and contactless customer engagement. Kiosks are used for product discovery, self-checkout, loyalty programs, and order pickup, enhancing both customer experience and operational efficiency. Transportation is a major adopter, leveraging kiosks for ticketing, check-in, boarding, and real-time information. The ability to provide instant, contextual support across airports, train stations, and bus terminals is critical for passenger satisfaction and operational flow. Healthcare is a rapidly growing segment, with kiosks used for patient registration, health information, and telemedicine access. The integration of kiosks with electronic health records (EHR) and telehealth platforms is improving access, efficiency, and patient outcomes. Other key sectors include banking, hospitality, education, and government, each adopting kiosks to automate routine interactions, deliver information, and support digital transformation initiatives.
Region Analysis:
North America and Europe Lead, Asia-Pacific Is Fastest-Growing: North America and Europe dominate the global digital kiosks market, accounting for a combined market share of over 60% in 2024. These regions benefit from advanced infrastructure, high digital adoption, and a strong presence of leading technology vendors and enterprises. The United States, Canada, the United Kingdom, Germany, and France are key markets, with organizations investing in digital kiosks to enhance customer engagement and operational efficiency.
Asia-Pacific is the fastest-growing region, propelled by rapid urbanization, rising disposable incomes, and increasing investments in smart infrastructure. Countries such as China, India, Japan, South Korea, and Australia are witnessing significant market expansion, driven by the growth of local platforms, government initiatives, and a large, youthful user base.
Latin America and the Middle East & Africa are emerging markets, with growing demand for digital engagement, local language support, and affordable kiosk solutions. Investments in digital infrastructure, cloud adoption, and smart city projects are unlocking new opportunities for market growth.
Customization for segments, region/country-level will be provided. Moreover, additional customization can be done based on the requirements.
Pricing and Purchase Options
Avail customized purchase options to meet your exact research needs. We have three licenses to opt for: Single User License, Multi-User License (Up to 5 Users), Corporate Use License (Unlimited User and Printable PDF).
TABLE OF CONTENTS
1. EXECUTIVE SUMMARY
1.1. MARKET SNAPSHOT
1.2. KEY FINDINGS & INSIGHTS
1.3. ANALYST RECOMMENDATIONS
1.4. FUTURE OUTLOOK
2. RESEARCH METHODOLOGY
2.1. MARKET DEFINITION & SCOPE
2.2. RESEARCH OBJECTIVES: PRIMARY & SECONDARY DATA SOURCES
2.3. DATA COLLECTION SOURCES
2.3.1. COVERAGE OF 100+ PRIMARY RESEARCH/CONSULTATION CALLS WITH INDUSTRY STAKEHOLDERS
FIGURE 17 NORTH AMERICA DIGITAL KIOSKS CURRENT AND FUTURE TYPE ANALYSIS, 2025–2034, (USD MILLION)
FIGURE 18 NORTH AMERICA DIGITAL KIOSKS CURRENT AND FUTURE END USER ANALYSIS, 2025–2034, (USD MILLION)
FIGURE 19 MARKET SHARE BY COUNTRY
FIGURE 20 LATIN AMERICA DIGITAL KIOSKS CURRENT AND FUTURE TYPE ANALYSIS, 2025–2034, (USD MILLION)
FIGURE 21 LATIN AMERICA DIGITAL KIOSKS CURRENT AND FUTURE END USER ANALYSIS, 2025–2034, (USD MILLION)
FIGURE 22 MARKET SHARE BY COUNTRY
FIGURE 23 EASTERN EUROPE DIGITAL KIOSKS CURRENT AND FUTURE TYPE ANALYSIS, 2025–2034, (USD MILLION)
FIGURE 24 EASTERN EUROPE DIGITAL KIOSKS CURRENT AND FUTURE END USER ANALYSIS, 2025–2034, (USD MILLION)
FIGURE 25 MARKET SHARE BY COUNTRY
FIGURE 26 WESTERN EUROPE DIGITAL KIOSKS CURRENT AND FUTURE TYPE ANALYSIS, 2025–2034, (USD MILLION)
FIGURE 27 WESTERN EUROPE DIGITAL KIOSKS CURRENT AND FUTURE END USER ANALYSIS, 2025–2034, (USD MILLION)
FIGURE 28 MARKET SHARE BY COUNTRY
FIGURE 29 EAST ASIA AND PACIFIC DIGITAL KIOSKS CURRENT AND FUTURE TYPE ANALYSIS, 2025–2034, (USD MILLION)
FIGURE 30 EAST ASIA AND PACIFIC DIGITAL KIOSKS CURRENT AND FUTURE END USER ANALYSIS, 2025–2034, (USD MILLION)
FIGURE 31 MARKET SHARE BY COUNTRY
FIGURE 32 SEA AND SOUTH ASIA DIGITAL KIOSKS CURRENT AND FUTURE TYPE ANALYSIS, 2025–2034, (USD MILLION)
FIGURE 33 SEA AND SOUTH ASIA DIGITAL KIOSKS CURRENT AND FUTURE END USER ANALYSIS, 2025–2034, (USD MILLION)
FIGURE 34 MARKET SHARE BY COUNTRY
FIGURE 35 MIDDLE EAST AND AFRICA DIGITAL KIOSKS CURRENT AND FUTURE TYPE ANALYSIS, 2025–2034, (USD MILLION)
FIGURE 36 MIDDLE EAST AND AFRICA DIGITAL KIOSKS CURRENT AND FUTURE END USER ANALYSIS, 2025–2034, (USD MILLION)
FIGURE 37 NORTH AMERICA DIGITAL KIOSKS CURRENT AND FUTURE MARKET VOLUME SHARE REGIONAL ANALYSIS, 2025–2034, (USD MILLION)
FIGURE 38 U.S. DIGITAL KIOSKS CURRENT AND FUTURE TYPE ANALYSIS, 2025–2034, (USD MILLION)
FIGURE 39 U.S. DIGITAL KIOSKS CURRENT AND FUTURE END USER ANALYSIS, 2025–2034, (USD MILLION)
FIGURE 40 CANADA DIGITAL KIOSKS CURRENT AND FUTURE TYPE ANALYSIS, 2025–2034, (USD MILLION)
FIGURE 41 CANADA DIGITAL KIOSKS CURRENT AND FUTURE END USER ANALYSIS, 2025–2034, (USD MILLION)
FIGURE 42 LATIN AMERICA DIGITAL KIOSKS CURRENT AND FUTURE MARKET VOLUME SHARE REGIONAL ANALYSIS, 2025–2034, (USD MILLION)
FIGURE 43 MEXICO DIGITAL KIOSKS CURRENT AND FUTURE TYPE ANALYSIS, 2025–2034, (USD MILLION)
FIGURE 44 MEXICO DIGITAL KIOSKS CURRENT AND FUTURE END USER ANALYSIS, 2025–2034, (USD MILLION)
FIGURE 45 BRAZIL DIGITAL KIOSKS CURRENT AND FUTURE TYPE ANALYSIS, 2025–2034, (USD MILLION)
FIGURE 46 BRAZIL DIGITAL KIOSKS CURRENT AND FUTURE END USER ANALYSIS, 2025–2034, (USD MILLION)
FIGURE 47 ARGENTINA DIGITAL KIOSKS CURRENT AND FUTURE TYPE ANALYSIS, 2025–2034, (USD MILLION)
FIGURE 48 ARGENTINA DIGITAL KIOSKS CURRENT AND FUTURE END USER ANALYSIS, 2025–2034, (USD MILLION)
FIGURE 49 COLUMBIA DIGITAL KIOSKS CURRENT AND FUTURE TYPE ANALYSIS, 2025–2034, (USD MILLION)
FIGURE 50 COLUMBIA DIGITAL KIOSKS CURRENT AND FUTURE END USER ANALYSIS, 2025–2034, (USD MILLION)
FIGURE 51 REST OF LATIN AMERICA DIGITAL KIOSKS CURRENT AND FUTURE TYPE ANALYSIS, 2025–2034, (USD MILLION)
FIGURE 52 REST OF LATIN AMERICA DIGITAL KIOSKS CURRENT AND FUTURE END USER ANALYSIS, 2025–2034, (USD MILLION)
FIGURE 53 EASTERN EUROPE DIGITAL KIOSKS CURRENT AND FUTURE MARKET VOLUME SHARE REGIONAL ANALYSIS, 2025–2034, (USD MILLION)
FIGURE 54 POLAND DIGITAL KIOSKS CURRENT AND FUTURE TYPE ANALYSIS, 2025–2034, (USD MILLION)
FIGURE 55 POLAND DIGITAL KIOSKS CURRENT AND FUTURE END USER ANALYSIS, 2025–2034, (USD MILLION)
FIGURE 56 RUSSIA DIGITAL KIOSKS CURRENT AND FUTURE TYPE ANALYSIS, 2025–2034, (USD MILLION)
FIGURE 57 RUSSIA DIGITAL KIOSKS CURRENT AND FUTURE END USER ANALYSIS, 2025–2034, (USD MILLION)
FIGURE 58 CZECH REPUBLIC DIGITAL KIOSKS CURRENT AND FUTURE TYPE ANALYSIS, 2025–2034, (USD MILLION)
FIGURE 59 CZECH REPUBLIC DIGITAL KIOSKS CURRENT AND FUTURE END USER ANALYSIS, 2025–2034, (USD MILLION)
FIGURE 60 ROMANIA DIGITAL KIOSKS CURRENT AND FUTURE TYPE ANALYSIS, 2025–2034, (USD MILLION)
FIGURE 61 ROMANIA DIGITAL KIOSKS CURRENT AND FUTURE END USER ANALYSIS, 2025–2034, (USD MILLION)
FIGURE 62 REST OF EASTERN EUROPE DIGITAL KIOSKS CURRENT AND FUTURE TYPE ANALYSIS, 2025–2034, (USD MILLION)
FIGURE 63 REST OF EASTERN EUROPE DIGITAL KIOSKS CURRENT AND FUTURE END USER ANALYSIS, 2025–2034, (USD MILLION)
FIGURE 64 WESTERN EUROPE DIGITAL KIOSKS CURRENT AND FUTURE MARKET VOLUME SHARE REGIONAL ANALYSIS, 2025–2034, (USD MILLION)
FIGURE 65 GERMANY DIGITAL KIOSKS CURRENT AND FUTURE TYPE ANALYSIS, 2025–2034, (USD MILLION)
FIGURE 66 GERMANY DIGITAL KIOSKS CURRENT AND FUTURE END USER ANALYSIS, 2025–2034, (USD MILLION)
FIGURE 67 FRANCE DIGITAL KIOSKS CURRENT AND FUTURE TYPE ANALYSIS, 2025–2034, (USD MILLION)
FIGURE 68 FRANCE DIGITAL KIOSKS CURRENT AND FUTURE END USER ANALYSIS, 2025–2034, (USD MILLION)
FIGURE 69 UK DIGITAL KIOSKS CURRENT AND FUTURE TYPE ANALYSIS, 2025–2034, (USD MILLION)
FIGURE 70 UK DIGITAL KIOSKS CURRENT AND FUTURE END USER ANALYSIS, 2025–2034, (USD MILLION)
FIGURE 71 SPAIN DIGITAL KIOSKS CURRENT AND FUTURE TYPE ANALYSIS, 2025–2034, (USD MILLION)
FIGURE 72 SPAIN DIGITAL KIOSKS CURRENT AND FUTURE END USER ANALYSIS, 2025–2034, (USD MILLION)
FIGURE 73 ITALY DIGITAL KIOSKS CURRENT AND FUTURE TYPE ANALYSIS, 2025–2034, (USD MILLION)
FIGURE 74 ITALY DIGITAL KIOSKS CURRENT AND FUTURE END USER ANALYSIS, 2025–2034, (USD MILLION)
FIGURE 75 REST OF WESTERN EUROPE DIGITAL KIOSKS CURRENT AND FUTURE TYPE ANALYSIS, 2025–2034, (USD MILLION)
FIGURE 76 REST OF WESTERN EUROPE DIGITAL KIOSKS CURRENT AND FUTURE END USER ANALYSIS, 2025–2034, (USD MILLION)
FIGURE 77 EAST ASIA AND PACIFIC DIGITAL KIOSKS CURRENT AND FUTURE MARKET VOLUME SHARE REGIONAL ANALYSIS, 2025–2034, (USD MILLION)
FIGURE 78 CHINA DIGITAL KIOSKS CURRENT AND FUTURE TYPE ANALYSIS, 2025–2034, (USD MILLION)
FIGURE 79 CHINA DIGITAL KIOSKS CURRENT AND FUTURE END USER ANALYSIS, 2025–2034, (USD MILLION)
FIGURE 80 JAPAN DIGITAL KIOSKS CURRENT AND FUTURE TYPE ANALYSIS, 2025–2034, (USD MILLION)
FIGURE 81 JAPAN DIGITAL KIOSKS CURRENT AND FUTURE END USER ANALYSIS, 2025–2034, (USD MILLION)
FIGURE 82 AUSTRALIA DIGITAL KIOSKS CURRENT AND FUTURE TYPE ANALYSIS, 2025–2034, (USD MILLION)
FIGURE 83 AUSTRALIA DIGITAL KIOSKS CURRENT AND FUTURE END USER ANALYSIS, 2025–2034, (USD MILLION)
FIGURE 84 CAMBODIA DIGITAL KIOSKS CURRENT AND FUTURE TYPE ANALYSIS, 2025–2034, (USD MILLION)
FIGURE 85 CAMBODIA DIGITAL KIOSKS CURRENT AND FUTURE END USER ANALYSIS, 2025–2034, (USD MILLION)
FIGURE 86 FIJI DIGITAL KIOSKS CURRENT AND FUTURE TYPE ANALYSIS, 2025–2034, (USD MILLION)
FIGURE 87 FIJI DIGITAL KIOSKS CURRENT AND FUTURE END USER ANALYSIS, 2025–2034, (USD MILLION)
FIGURE 88 INDONESIA DIGITAL KIOSKS CURRENT AND FUTURE TYPE ANALYSIS, 2025–2034, (USD MILLION)
FIGURE 89 INDONESIA DIGITAL KIOSKS CURRENT AND FUTURE END USER ANALYSIS, 2025–2034, (USD MILLION)
FIGURE 90 SOUTH KOREA DIGITAL KIOSKS CURRENT AND FUTURE TYPE ANALYSIS, 2025–2034, (USD MILLION)
FIGURE 91 SOUTH KOREA DIGITAL KIOSKS CURRENT AND FUTURE END USER ANALYSIS, 2025–2034, (USD MILLION)
FIGURE 92 REST OF EAST ASIA AND PACIFIC DIGITAL KIOSKS CURRENT AND FUTURE TYPE ANALYSIS, 2025–2034, (USD MILLION)
FIGURE 93 REST OF EAST ASIA AND PACIFIC DIGITAL KIOSKS CURRENT AND FUTURE END USER ANALYSIS, 2025–2034, (USD MILLION)
FIGURE 94 SEA AND SOUTH ASIA DIGITAL KIOSKS CURRENT AND FUTURE MARKET VOLUME SHARE REGIONAL ANALYSIS, 2025–2034, (USD MILLION)
FIGURE 95 BANGLADESH DIGITAL KIOSKS CURRENT AND FUTURE TYPE ANALYSIS, 2025–2034, (USD MILLION)
FIGURE 96 BANGLADESH DIGITAL KIOSKS CURRENT AND FUTURE END USER ANALYSIS, 2025–2034, (USD MILLION)
FIGURE 97 NEW ZEALAND DIGITAL KIOSKS CURRENT AND FUTURE TYPE ANALYSIS, 2025–2034, (USD MILLION)
FIGURE 98 NEW ZEALAND DIGITAL KIOSKS CURRENT AND FUTURE END USER ANALYSIS, 2025–2034, (USD MILLION)
FIGURE 99 INDIA DIGITAL KIOSKS CURRENT AND FUTURE TYPE ANALYSIS, 2025–2034, (USD MILLION)
FIGURE 100 INDIA DIGITAL KIOSKS CURRENT AND FUTURE END USER ANALYSIS, 2025–2034, (USD MILLION)
FIGURE 101 SINGAPORE DIGITAL KIOSKS CURRENT AND FUTURE TYPE ANALYSIS, 2025–2034, (USD MILLION)
FIGURE 102 SINGAPORE DIGITAL KIOSKS CURRENT AND FUTURE END USER ANALYSIS, 2025–2034, (USD MILLION)
FIGURE 103 THAILAND DIGITAL KIOSKS CURRENT AND FUTURE TYPE ANALYSIS, 2025–2034, (USD MILLION)
FIGURE 104 THAILAND DIGITAL KIOSKS CURRENT AND FUTURE END USER ANALYSIS, 2025–2034, (USD MILLION)
FIGURE 105 TAIWAN DIGITAL KIOSKS CURRENT AND FUTURE TYPE ANALYSIS, 2025–2034, (USD MILLION)
FIGURE 106 TAIWAN DIGITAL KIOSKS CURRENT AND FUTURE END USER ANALYSIS, 2025–2034, (USD MILLION)
FIGURE 107 MALAYSIA DIGITAL KIOSKS CURRENT AND FUTURE TYPE ANALYSIS, 2025–2034, (USD MILLION)
FIGURE 108 MALAYSIA DIGITAL KIOSKS CURRENT AND FUTURE END USER ANALYSIS, 2025–2034, (USD MILLION)
FIGURE 109 REST OF SEA AND SOUTH ASIA DIGITAL KIOSKS CURRENT AND FUTURE TYPE ANALYSIS, 2025–2034, (USD MILLION)
FIGURE 110 REST OF SEA AND SOUTH ASIA DIGITAL KIOSKS CURRENT AND FUTURE END USER ANALYSIS, 2025–2034, (USD MILLION)
FIGURE 111 MIDDLE EAST AND AFRICA DIGITAL KIOSKS CURRENT AND FUTURE MARKET VOLUME SHARE REGIONAL ANALYSIS, 2025–2034, (USD MILLION)
FIGURE 112 GCC COUNTRIES DIGITAL KIOSKS CURRENT AND FUTURE TYPE ANALYSIS, 2025–2034, (USD MILLION)
FIGURE 113 GCC COUNTRIES DIGITAL KIOSKS CURRENT AND FUTURE END USER ANALYSIS, 2025–2034, (USD MILLION)
FIGURE 114 SAUDI ARABIA DIGITAL KIOSKS CURRENT AND FUTURE TYPE ANALYSIS, 2025–2034, (USD MILLION)
FIGURE 115 SAUDI ARABIA DIGITAL KIOSKS CURRENT AND FUTURE END USER ANALYSIS, 2025–2034, (USD MILLION)
FIGURE 116 UAE DIGITAL KIOSKS CURRENT AND FUTURE TYPE ANALYSIS, 2025–2034, (USD MILLION)
FIGURE 117 UAE DIGITAL KIOSKS CURRENT AND FUTURE END USER ANALYSIS, 2025–2034, (USD MILLION)
FIGURE 118 BAHRAIN DIGITAL KIOSKS CURRENT AND FUTURE TYPE ANALYSIS, 2025–2034, (USD MILLION)
FIGURE 119 BAHRAIN DIGITAL KIOSKS CURRENT AND FUTURE END USER ANALYSIS, 2025–2034, (USD MILLION)
FIGURE 120 KUWAIT DIGITAL KIOSKS CURRENT AND FUTURE TYPE ANALYSIS, 2025–2034, (USD MILLION)
FIGURE 121 KUWAIT DIGITAL KIOSKS CURRENT AND FUTURE END USER ANALYSIS, 2025–2034, (USD MILLION)
FIGURE 122 OMAN DIGITAL KIOSKS CURRENT AND FUTURE TYPE ANALYSIS, 2025–2034, (USD MILLION)
FIGURE 123 OMAN DIGITAL KIOSKS CURRENT AND FUTURE END USER ANALYSIS, 2025–2034, (USD MILLION)
FIGURE 124 QATAR DIGITAL KIOSKS CURRENT AND FUTURE TYPE ANALYSIS, 2025–2034, (USD MILLION)
FIGURE 125 QATAR DIGITAL KIOSKS CURRENT AND FUTURE END USER ANALYSIS, 2025–2034, (USD MILLION)
FIGURE 126 EGYPT DIGITAL KIOSKS CURRENT AND FUTURE TYPE ANALYSIS, 2025–2034, (USD MILLION)
FIGURE 127 EGYPT DIGITAL KIOSKS CURRENT AND FUTURE END USER ANALYSIS, 2025–2034, (USD MILLION)
FIGURE 128 NIGERIA DIGITAL KIOSKS CURRENT AND FUTURE TYPE ANALYSIS, 2025–2034, (USD MILLION)
FIGURE 129 NIGERIA DIGITAL KIOSKS CURRENT AND FUTURE END USER ANALYSIS, 2025–2034, (USD MILLION)
FIGURE 130 SOUTH AFRICA DIGITAL KIOSKS CURRENT AND FUTURE TYPE ANALYSIS, 2025–2034, (USD MILLION)
FIGURE 131 SOUTH AFRICA DIGITAL KIOSKS CURRENT AND FUTURE END USER ANALYSIS, 2025–2034, (USD MILLION)
FIGURE 132 ISRAEL DIGITAL KIOSKS CURRENT AND FUTURE TYPE ANALYSIS, 2025–2034, (USD MILLION)
FIGURE 133 ISRAEL DIGITAL KIOSKS CURRENT AND FUTURE END USER ANALYSIS, 2025–2034, (USD MILLION)
FIGURE 134 REST OF MEA DIGITAL KIOSKS CURRENT AND FUTURE TYPE ANALYSIS, 2025–2034, (USD MILLION)
FIGURE 135 REST OF MEA DIGITAL KIOSKS CURRENT AND FUTURE END USER ANALYSIS, 2025–2034, (USD MILLION)
FIGURE 136 U. S. MARKET SHARE ANALYSIS BY TYPE (2024)
FIGURE 137 U. S. MARKET SHARE ANALYSIS BY END USER (2024)
FIGURE 138 CANADA MARKET SHARE ANALYSIS BY TYPE (2024)
FIGURE 139 CANADA MARKET SHARE ANALYSIS BY END USER (2024)
FIGURE 140 MEXICO MARKET SHARE ANALYSIS BY TYPE (2024)
FIGURE 141 MEXICO MARKET SHARE ANALYSIS BY END USER (2024)
FIGURE 142 CHINA MARKET SHARE ANALYSIS BY TYPE (2024)
FIGURE 143 CHINA MARKET SHARE ANALYSIS BY END USER (2024)
FIGURE 144 JAPAN MARKET SHARE ANALYSIS BY TYPE (2024)
FIGURE 145 JAPAN MARKET SHARE ANALYSIS BY END USER (2024)
FIGURE 146 INDIA MARKET SHARE ANALYSIS BY TYPE (2024)
FIGURE 147 INDIA MARKET SHARE ANALYSIS BY END USER (2024)
FIGURE 148 SOUTH KOREA MARKET SHARE ANALYSIS BY TYPE (2024)
FIGURE 149 SOUTH KOREA MARKET SHARE ANALYSIS BY END USER (2024)
FIGURE 150 SAUDI ARABIA MARKET SHARE ANALYSIS BY TYPE (2024)
FIGURE 151 SAUDI ARABIA MARKET SHARE ANALYSIS BY END USER (2024)
FIGURE 152 UAE MARKET SHARE ANALYSIS BY TYPE (2024)
FIGURE 153 UAE MARKET SHARE ANALYSIS BY END USER (2024)
FIGURE 154 EGYPT MARKET SHARE ANALYSIS BY TYPE (2024)
FIGURE 155 EGYPT MARKET SHARE ANALYSIS BY END USER (2024)
FIGURE 156 NIGERIA MARKET SHARE ANALYSIS BY TYPE (2024)
FIGURE 157 NIGERIA MARKET SHARE ANALYSIS BY END USER (2024)
FIGURE 158 SOUTH AFRICA MARKET SHARE ANALYSIS BY TYPE (2024)
FIGURE 159 SOUTH AFRICA MARKET SHARE ANALYSIS BY END USER (2024)
FIGURE 160 GERMANY MARKET SHARE ANALYSIS BY TYPE (2024)
FIGURE 161 GERMANY MARKET SHARE ANALYSIS BY END USER (2024)
FIGURE 162 FRANCE MARKET SHARE ANALYSIS BY TYPE (2024)
FIGURE 163 FRANCE MARKET SHARE ANALYSIS BY END USER (2024)
FIGURE 164 UK MARKET SHARE ANALYSIS BY TYPE (2024)
FIGURE 165 UK MARKET SHARE ANALYSIS BY END USER (2024)
FIGURE 166 SPAIN MARKET SHARE ANALYSIS BY TYPE (2024)
FIGURE 167 SPAIN MARKET SHARE ANALYSIS BY END USER (2024)
FIGURE 168 ITALY MARKET SHARE ANALYSIS BY TYPE (2024)
FIGURE 169 ITALY MARKET SHARE ANALYSIS BY END USER (2024)
FIGURE 170 BRAZIL MARKET SHARE ANALYSIS BY TYPE (2024)
FIGURE 171 BRAZIL MARKET SHARE ANALYSIS BY END USER (2024)
FIGURE 172 ARGENTINA MARKET SHARE ANALYSIS BY TYPE (2024)
FIGURE 173 ARGENTINA MARKET SHARE ANALYSIS BY END USER (2024)
FIGURE 174 COLUMBIA MARKET SHARE ANALYSIS BY TYPE (2024)
FIGURE 175 COLUMBIA MARKET SHARE ANALYSIS BY END USER (2024)
FIGURE 176 GLOBAL DIGITAL KIOSKS CURRENT AND FUTURE MARKET KEY COUNTRY LEVEL ANALYSIS, 2024–2034, (USD MILLION)
FIGURE 177 FINANCIAL OVERVIEW:
Key Players Analysis:
NCR Corporation: NCR Corporation stands as a global leader in the digital kiosks market, renowned for its comprehensive portfolio of self-service solutions spanning retail, banking, hospitality, and transportation. The company’s competitive advantage lies in its deep industry expertise, robust R&D capabilities, and ability to deliver end-to-end kiosk solutions—from hardware design and manufacturing to software integration and managed services. NCR’s strength is further reinforced by its global service network and focus on innovation, as seen in its recent launches of AI-powered self-checkout and contactless payment kiosks. The company’s strategic partnerships with major retailers and financial institutions, along with its commitment to digital transformation, ensure NCR remains at the forefront of the evolving kiosks landscape.
Diebold Nixdorf: Diebold Nixdorf dominates the banking and retail kiosk segments through its expertise in secure, scalable, and customizable self-service platforms. The company’s competitive differentiation stems from its focus on security, modular design, and seamless integration with core banking and retail systems. Diebold Nixdorf’s market strength is reinforced by its global footprint, strong client relationships, and ongoing investment in biometric authentication and remote management technologies. The firm is actively expanding its digital offerings, including cloud-connected kiosks and advanced analytics, to address the growing demand for personalized, data-driven customer experiences.
KIOSK Information Systems: KIOSK Information Systems specializes in custom kiosk design and manufacturing, serving a diverse range of industries including retail, government, healthcare, and transportation. The company’s competitive advantage comes from its flexible, modular approach, allowing clients to tailor kiosk solutions to specific use cases and environments. KIOSK’s strength lies in its in-house engineering, software development, and integration expertise, as well as its focus on ADA compliance and user-centric design. The firm maintains premium positioning through its ability to deliver turnkey solutions, rapid prototyping, and ongoing support for large-scale deployments.
Olea Kiosks Inc.: Olea Kiosks is recognized for its innovative, high-quality kiosk solutions that combine sleek design with robust functionality. The company’s competitive edge is its focus on customization, durability, and ease of maintenance, making it a preferred partner for clients in retail, healthcare, and smart city projects. Olea’s strength is further enhanced by its investment in emerging technologies such as biometric authentication, contactless interfaces, and IoT integration. The firm’s collaborative approach and commitment to continuous improvement have enabled it to build long-term relationships with leading brands and public sector organizations.
Zebra Technologies: Zebra Technologies is a key player in the digital kiosks market, offering interactive kiosks and digital signage solutions for retail, healthcare, and logistics. The company’s competitive advantage lies in its expertise in IoT integration, mobility, and real-time data analytics. Zebra’s strength is reinforced by its global reach, strong channel partnerships, and focus on delivering connected, intelligent kiosk solutions that enhance operational efficiency and customer engagement. The firm continues to expand its portfolio with touchless check-in, patient screening, and smart inventory management kiosks, addressing the evolving needs of digital-first enterprises.
Market Key Players
NCR Corporation
Diebold Nixdorf
KIOSK Information Systems
Olea Kiosks Inc.
Zebra Technologies
Meridian Kiosks
Advantech Co., Ltd.
SlabbKiosks
RedyRef Interactive Kiosks
Samsung Electronics
Driver:
Accelerating Digital Transformation and Demand for Contactless Services:
The rapid acceleration of digital transformation across industries is fundamentally reshaping how organizations interact with customers and deliver services. In today’s environment, businesses are under increasing pressure to modernize their operations, streamline workflows, and enhance user experiences through technology. Digital kiosks have emerged as a pivotal solution in this transformation journey, enabling organizations to automate routine transactions, provide instant access to information, and deliver services around the clock without the need for direct human intervention. The COVID-19 pandemic further amplified this trend, as health and safety concerns drove a surge in demand for contactless, self-service options in public spaces, retail stores, banks, hospitals, and transportation hubs. Digital kiosks allow users to complete purchases, check in for appointments, print tickets, or access information with minimal physical contact, reducing the risk of disease transmission and improving overall efficiency. As consumers increasingly expect fast, convenient, and safe service experiences, the deployment of digital kiosks has become a strategic imperative for organizations seeking to remain competitive and responsive in a rapidly evolving digital landscape. This driver is expected to continue fueling market growth as businesses and governments invest in digital infrastructure to meet the rising expectations for contactless, automated, and user-friendly service delivery.
Integration of Advanced Technologies (IoT, AI, Cloud)
The integration of Internet of Things (IoT) sensors, artificial intelligence (AI), and cloud connectivity is revolutionizing the digital kiosks market. IoT sensors embedded in kiosks enable real-time data collection on user interactions, device status, and environmental conditions. This data can be analyzed using AI-driven analytics to identify usage patterns, predict maintenance needs, and optimize kiosk placement for maximum impact. For example, AI algorithms can detect when a kiosk is underutilized or requires servicing, allowing operators to proactively address issues and minimize downtime. Cloud connectivity further enhances kiosk capabilities by enabling remote management, software updates, and content delivery from centralized platforms. Businesses can monitor and control large networks of kiosks across multiple locations, ensuring consistent performance and rapid response to changing needs. Cloud-based platforms also facilitate the integration of kiosks with other digital systems, such as CRM, payment gateways, and inventory management, creating seamless, data-driven service experiences. As a result, organizations can deliver more dynamic, personalized, and efficient services to users, while reducing operational complexity and costs.
Restraints:
High Initial Investment and Maintenance Costs
One of the primary restraints in the digital kiosks market is the significant upfront investment required for deployment. Organizations must allocate substantial budgets for purchasing hardware, developing or licensing software, and installing kiosks at desired locations. These costs can be particularly prohibitive for small and medium-sized enterprises (SMEs) or organizations operating in regions with limited access to capital. Additionally, the need for customized solutions, integration with existing IT infrastructure, and compliance with regulatory standards can further increase initial expenses. Beyond installation, ongoing maintenance and operational costs present additional challenges. Digital kiosks require regular software updates, security patches, and hardware servicing to ensure optimal performance and security. Unexpected repairs, vandalism, or component failures can lead to unplanned expenses and service disruptions. As technology evolves, organizations may also need to invest in hardware upgrades or replacements to keep pace with new features and security requirements. These cumulative costs can impact the total cost of ownership and slow the adoption of digital kiosks, especially among budget-conscious organizations.
Security and Data Privacy Concerns
Digital kiosks often handle sensitive user data, including personal information, payment details, and transaction histories. This makes them attractive targets for cybercriminals seeking to exploit vulnerabilities for financial gain or data theft. Ensuring robust security is a complex task, as kiosks must be protected against a wide range of threats, including malware, unauthorized access, and physical tampering. Organizations must implement strong encryption, secure authentication, and regular security audits to safeguard user data and maintain trust. Compliance with data protection regulations, such as GDPR, PCI DSS, and local privacy laws, adds another layer of complexity. Organizations must ensure that kiosks collect, process, and store data in accordance with legal requirements, which may vary by region and industry. Regular software updates and security patches are essential to address emerging threats, but managing these updates across large, distributed kiosk networks can be challenging. Failure to maintain adequate security and compliance can result in data breaches, regulatory penalties, and reputational damage, making security and privacy a top concern for kiosk operators.
Opportunities:
Expansion in Emerging Markets and New Sectors:
Emerging markets in Asia-Pacific, Latin America, and Africa present significant growth opportunities for the digital kiosks market. Rapid urbanization, rising disposable incomes, and government investments in smart infrastructure are driving demand for modern, efficient service delivery solutions. Digital kiosks are being deployed in public spaces, transportation hubs, and retail environments to improve accessibility, reduce wait times, and enhance user experiences. These regions often have large, youthful populations eager to adopt new technologies, making them fertile ground for kiosk expansion. In addition to geographic expansion, new industry sectors are increasingly adopting digital kiosks to address unique service delivery challenges. Education institutions are using kiosks for student registration, information dissemination, and campus navigation. Government agencies are deploying kiosks for public information, bill payment, and document processing, improving accessibility and reducing administrative burdens. Healthcare providers are leveraging kiosks for patient check-in, appointment scheduling, and health information delivery. As organizations in these sectors recognize the benefits of automation and self-service, the demand for digital kiosks is expected to grow rapidly.
AI-Driven Personalization and Value-Added Services:
The integration of AI into digital kiosks is unlocking new possibilities for personalized, value-added services. AI-powered kiosks can analyze user behavior, preferences, and transaction history to deliver tailored recommendations, targeted promotions, and customized content. For example, a retail kiosk can suggest products based on previous purchases, while a healthcare kiosk can provide personalized health tips or appointment reminders. This level of personalization enhances user engagement, satisfaction, and loyalty, giving businesses a competitive edge. Beyond personalization, AI enables kiosks to offer predictive maintenance and operational insights. By analyzing real-time data from IoT sensors, AI algorithms can anticipate hardware failures, schedule maintenance proactively, and optimize resource allocation. This reduces downtime, lowers maintenance costs, and ensures a seamless user experience. Additionally, AI-driven analytics provide businesses with valuable insights into customer behavior, service usage, and market trends, enabling data-driven decision-making and the development of new revenue streams through advertising, loyalty programs, and cross-selling opportunities.
Trends
Biometric and Voice-Enabled Kiosks
The integration of biometric authentication and voice interaction is rapidly transforming the digital kiosks landscape, particularly in sectors such as banking, healthcare, and transportation. Biometric features like facial recognition and fingerprint scanning provide a secure and efficient means of verifying user identity, reducing the risk of fraud and unauthorized access. These technologies not only enhance security but also streamline the user experience by enabling quick, touchless authentication—an increasingly important consideration in a post-pandemic world. Meanwhile, voice-enabled kiosks are making self-service more accessible for users with disabilities, language barriers, or limited technical skills, allowing them to interact with kiosks naturally and intuitively. The combination of biometrics and voice interaction supports the industry’s shift toward frictionless, hands-free service, improving both convenience and inclusivity while meeting rising consumer expectations for safety and ease of use. As these technologies become more affordable and reliable, their adoption is expected to accelerate, further driving innovation and differentiation in the global digital kiosks market.
Recent Development
June 2025: NCR Corporation unveiled an advanced AI-powered self-checkout kiosk featuring facial recognition and contactless payment, aimed at improving speed, security, and convenience for retail and hospitality customers. This innovation supports the growing demand for frictionless, automated service experiences.
May 2025: Diebold Nixdorf launched a modular banking kiosk equipped with biometric authentication and remote video assistance, enhancing both security and customer support in financial services. This solution allows banks to offer personalized, secure, and efficient self-service options.
April 2025: Zebra Technologies expanded its healthcare kiosk lineup with new touchless check-in and patient screening features, helping hospitals and clinics streamline patient flow and reduce physical contact. These enhancements address the need for safer, more efficient healthcare environments.
March 2025: Olea Kiosks formed a partnership with a major smart city developer to deploy interactive wayfinding kiosks in key urban centers across North America and Europe. These kiosks provide real-time navigation, local information, and digital engagement for city residents and visitors.
February 2025: KIOSK Information Systems introduced a cloud-based kiosk management platform, enabling organizations to monitor, analyze, and update large kiosk networks remotely. This platform improves operational efficiency, reduces downtime, and supports data-driven decision-making for kiosk operators.

 Aerospace And Defence
 Agriculture
 Automotive And Transportation
 Banking And Finance
 Business
 Chemicals And Materials
 Consumer And Retail
 Electronics And Semiconductors
 Food And Beverages
 Machinery & Equipments
 Manufacturing And Construction
 Medical Devices
 Others
 Pharmaceuticals And Healthcare
 Power And Energy
 Sports
 Technology

), Industry Vertical , End-Use (Retail & E-Commerce, Transportation, Healthcare, Banking & Financial Services, Hospitality, Government & Public Sector, Education), Industry Region & Key Players-Industry Segment Overview, Market Dynamics, Competitive Strategies, Trends & Forecast 2025-2034")
), Industry Vertical , End-Use (Retail & E-Commerce, Transportation, Healthcare, Banking & Financial Services, Hospitality, Government & Public Sector, Education), Industry Region & Key Players-Industry Segment Overview, Market Dynamics, Competitive Strategies, Trends & Forecast 2025-2034")
), Industry Vertical , End-Use (Retail & E-Commerce, Transportation, Healthcare, Banking & Financial Services, Hospitality, Government & Public Sector, Education), Industry Region & Key Players-Industry Segment Overview, Market Dynamics, Competitive Strategies, Trends & Forecast 2025-2034")
), Industry Vertical , End-Use (Retail & E-Commerce, Transportation, Healthcare, Banking & Financial Services, Hospitality, Government & Public Sector, Education), Industry Region & Key Players-Industry Segment Overview, Market Dynamics, Competitive Strategies, Trends & Forecast 2025-2034")

