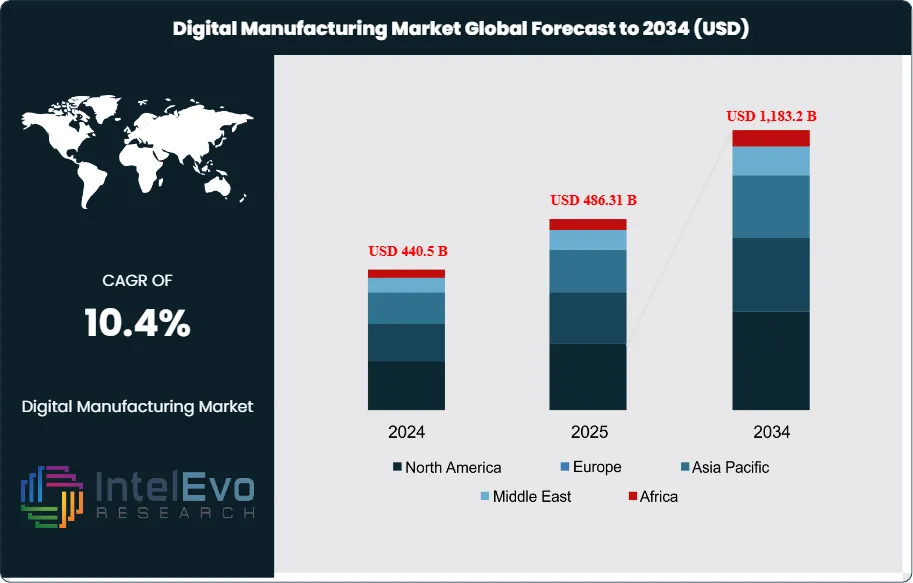
The Digital Manufacturing Market size is expected to be worth around USD 1,183.2 Billion by 2034, from USD 440.5 Billion in 2024, growing at a CAGR of 10.4% during the forecast period from 2024 to 2034. The digital manufacturing market represents a transformative segment within the industrial automation and smart technology ecosystem, focusing on the seamless integration of digital twins, artificial intelligence (AI), the Internet of Things (IoT), robotics, and advanced analytics to optimize manufacturing processes across industries.
The market’s rapid growth is driven by the increasing adoption of Industry 4.0, the rising need for real-time data-driven decision-making, and the demand for cost-efficient, flexible, and sustainable manufacturing operations. Digital manufacturing enables companies to enhance production efficiency, minimize downtime, and accelerate innovation by leveraging predictive analytics, simulation modeling, and connected systems.
Several key factors are shaping the market trajectory, including the expansion of smart factories, increasing demand for cloud-based and edge-computing solutions, and the shift toward sustainable production methods. The integration of digital twins and AI-powered automation is allowing manufacturers to simulate and optimize production environments virtually, reducing material wastage and operational risks. Moreover, post-pandemic recovery has accelerated investments in digital infrastructure as companies seek resilience, agility, and remote operational capabilities.
Regional analysis reveals North America as the leading market, capturing around 35–37% share in 2024, supported by advanced technological infrastructure, early adoption of smart factory solutions, and strong presence of leading automation players. Europe follows closely, emphasizing sustainability, innovation, and regulatory compliance in industrial automation. Meanwhile, the Asia-Pacific region is emerging as the fastest-growing market, fueled by large-scale industrialization, government-backed digitalization initiatives, and the growing manufacturing base in countries like China, India, Japan, and South Korea.
The COVID-19 pandemic initially disrupted global manufacturing operations; however, it served as a catalyst for digital transformation. Manufacturers increasingly invested in automation, remote monitoring, and predictive maintenance solutions to mitigate supply chain risks and workforce limitations. The crisis underscored the strategic importance of digital manufacturing in ensuring business continuity and adaptability.
Geopolitical tensions, trade realignments, and fluctuating raw material costs have also impacted the digital manufacturing landscape, driving companies to adopt smart sourcing, localized production, and AI-based forecasting tools. These changes are fostering a more resilient and technologically advanced global manufacturing ecosystem.
Key Takeaways:
Market Growth: The Digital Manufacturing Market is expected to reach USD 1,183.2 Billion by 2034, driven by industrial digitalization, real-time analytics, and automation.
Technology Leadership: Digital Twin and IoT solutions dominate, enabling virtual simulation, performance optimization, and predictive maintenance across industries.
Application Dominance: The automotive and aerospace sectors lead market adoption due to their demand for precision, speed, and innovation in product design and assembly.
Platform Trend: Cloud-based digital manufacturing platforms are gaining traction due to scalability, flexibility, and cost-effectiveness, supporting SMEs and large enterprises alike.
Driver: Increased adoption of AI, robotics, and connected sensors to enhance production efficiency, sustainability, and quality control.
Restraint: High implementation costs and cybersecurity vulnerabilities pose significant challenges to small and mid-sized manufacturers.
Opportunity: Expansion in emerging economies such as India and Southeast Asia, supported by government initiatives for smart manufacturing and digital infrastructure.
Trend: Growing integration of 5G, augmented reality (AR), and blockchain for enhanced connectivity, transparency, and automation in production workflows.
Regional Analysis: North America leads the market, followed by Europe, while Asia-Pacific exhibits the fastest growth due to rapid industrial digitalization.
Technology Analysis:
Digital Twin technology leads the global digital manufacturing market, accounting for a significant share due to its ability to simulate, monitor, and optimize production processes in real-time. By creating virtual replicas of physical assets, manufacturers can predict equipment failures, minimize downtime, and enhance efficiency. The integration of Artificial Intelligence (AI), Industrial Internet of Things (IIoT), and cloud-based analytics has accelerated adoption across industries. Robotics and additive manufacturing technologies are also gaining momentum, enabling faster prototyping and customization. The convergence of 5G connectivity, automation, and real-time analytics continues to redefine the manufacturing landscape, paving the way for hyperconnected, intelligent production systems that improve flexibility and scalability across industries.
Application Analysis:
The automotive and aerospace sectors dominate the digital manufacturing market, driven by the demand for precision engineering, smart automation, and advanced material design. Automotive manufacturers are adopting digital twins and robotics to enhance assembly line efficiency and reduce time-to-market for new models. In aerospace, simulation-driven design and predictive maintenance are helping optimize aircraft production and lifecycle management. The electronics and healthcare sectors are emerging as key growth contributors, leveraging digital manufacturing for high-volume production and quality assurance. The growing emphasis on energy-efficient and sustainable production methods further propels digital transformation across applications, positioning digital manufacturing as the backbone of next-generation industrial innovation.
End-User Industry Analysis:
Manufacturing, automotive, and aerospace industries represent the largest end-user segments in the digital manufacturing market, collectively driving more than half of total market revenue. The automotive sector relies heavily on digital platforms for design automation, supply chain coordination, and real-time production monitoring. Aerospace manufacturers leverage digital simulation to test performance and compliance under virtual conditions, reducing physical testing costs. Additionally, the healthcare, consumer electronics, and energy sectors are rapidly adopting digital manufacturing to enhance precision, traceability, and operational efficiency. The rising demand for connected and sustainable production systems among small and mid-sized enterprises (SMEs) further expands adoption across diverse end-user verticals.
Regional Analysis:
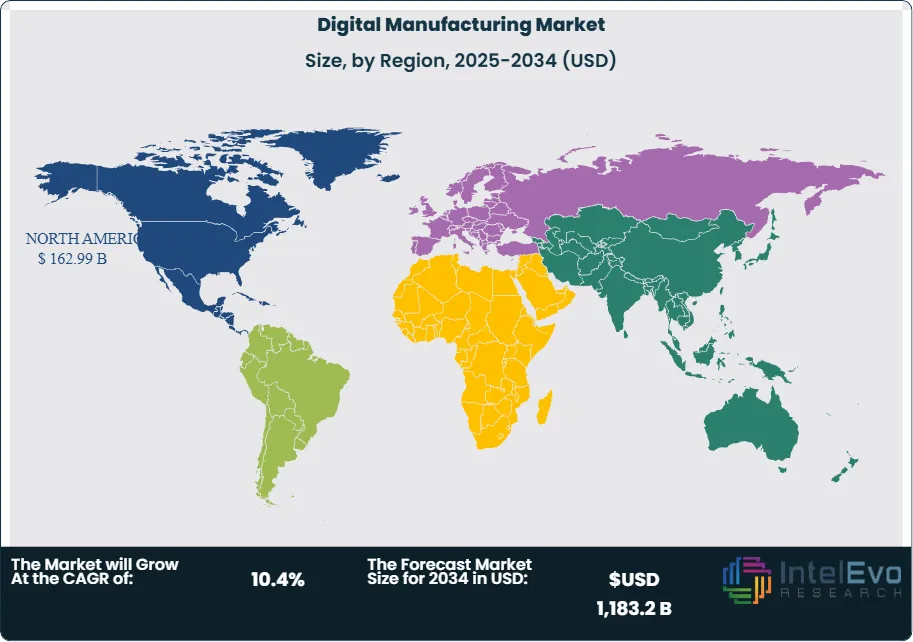
North America dominates the global digital manufacturing market with approximately 36–38% share in 2024, supported by a mature industrial base and advanced technological infrastructure. The United States leads adoption, fueled by large-scale investments in Industry 4.0, automation, and smart factories. Europe follows closely, driven by regulatory support for sustainability and strong adoption in Germany, the UK, and France. Asia-Pacific is the fastest-growing region, led by China, Japan, India, and South Korea, where rapid industrialization and digital transformation initiatives are reshaping manufacturing ecosystems. Meanwhile, Latin America and the Middle East & Africa are emerging markets with growing interest in cloud manufacturing and industrial IoT integration.
By Technology (Digital Twin, Computer-Aided Design (CAD), Industrial IoT (IIoT), Additive Manufacturing (3D Printing), Augmented & Virtual Reality (AR/VR), Cloud-based Manufacturing Solutions), By Application (Product Design and Prototyping, Process Optimization, Predictive Maintenance, Quality Control and Inspection, Supply Chain Management), By End-User Industry (Automotive, Aerospace & Defense, Electronics & Semiconductor, Healthcare & Medical Devices, Energy & Power, Industrial Machinery)
Research Methodology
Primary Research- 100 Interviews of Stakeholders
Secondary Research
Desk Research
Regional scope
North America (United States, Canada, Mexico)
Latin America (Brazil, Argentina, Columbia)
East Asia And Pacific (China, Japan, South Korea, Australia, Cambodia, Fiji, Indonesia)
Sea And South Asia (India, Singapore, Thailand, Taiwan, Malaysia)
Eastern Europe (Poland, Russia, Czech Republic, Romania)
Western Europe (Germany, U.K., France, Spain, Itlay)
Middle East & Africa (GCC Countries, Egypt, Nigeria, South Africa, Israel)
Competitive Landscape
Siemens AG, Dassault Systèmes SE, Autodesk Inc., PTC Inc., Honeywell International Inc., General Electric (GE), Rockwell Automation, Inc., SAP SE, ABB Ltd., Bosch Rexroth AG, IBM Corporation, Oracle Corporation, ANSYS, Inc., Hexagon AB, Schneider Electric SE, Mitsubishi Electric Corporation, Siemens Energy, Fujitsu Limited, Dassault Aviation, Emerson Electric Co.
Customization Scope
Customization for segments, region/country-level will be provided. Moreover, additional customization can be done based on the requirements.
Pricing and Purchase Options
Avail customized purchase options to meet your exact research needs. We have three licenses to opt for: Single User License, Multi-User License (Up to 5 Users), Corporate Use License (Unlimited User and Printable PDF).
TABLE OF CONTENTS
1. EXECUTIVE SUMMARY
1.1. MARKET SNAPSHOT
1.2. KEY FINDINGS & INSIGHTS
1.3. ANALYST RECOMMENDATIONS
1.4. FUTURE OUTLOOK
2. RESEARCH METHODOLOGY
2.1. MARKET DEFINITION & SCOPE
2.2. RESEARCH OBJECTIVES: PRIMARY & SECONDARY DATA SOURCES
2.3. DATA COLLECTION SOURCES
2.3.1. COVERAGE OF 100+ PRIMARY RESEARCH/CONSULTATION CALLS WITH INDUSTRY STAKEHOLDERS
FIGURE 17 NORTH AMERICA DIGITAL MANUFACTURING CURRENT AND FUTURE TYPE ANALYSIS, 2025–2034, (USD MILLION)
FIGURE 18 NORTH AMERICA DIGITAL MANUFACTURING CURRENT AND FUTURE END USER ANALYSIS, 2025–2034, (USD MILLION)
FIGURE 19 MARKET SHARE BY COUNTRY
FIGURE 20 LATIN AMERICA DIGITAL MANUFACTURING CURRENT AND FUTURE TYPE ANALYSIS, 2025–2034, (USD MILLION)
FIGURE 21 LATIN AMERICA DIGITAL MANUFACTURING CURRENT AND FUTURE END USER ANALYSIS, 2025–2034, (USD MILLION)
FIGURE 22 MARKET SHARE BY COUNTRY
FIGURE 23 EASTERN EUROPE DIGITAL MANUFACTURING CURRENT AND FUTURE TYPE ANALYSIS, 2025–2034, (USD MILLION)
FIGURE 24 EASTERN EUROPE DIGITAL MANUFACTURING CURRENT AND FUTURE END USER ANALYSIS, 2025–2034, (USD MILLION)
FIGURE 25 MARKET SHARE BY COUNTRY
FIGURE 26 WESTERN EUROPE DIGITAL MANUFACTURING CURRENT AND FUTURE TYPE ANALYSIS, 2025–2034, (USD MILLION)
FIGURE 27 WESTERN EUROPE DIGITAL MANUFACTURING CURRENT AND FUTURE END USER ANALYSIS, 2025–2034, (USD MILLION)
FIGURE 28 MARKET SHARE BY COUNTRY
FIGURE 29 EAST ASIA AND PACIFIC DIGITAL MANUFACTURING CURRENT AND FUTURE TYPE ANALYSIS, 2025–2034, (USD MILLION)
FIGURE 30 EAST ASIA AND PACIFIC DIGITAL MANUFACTURING CURRENT AND FUTURE END USER ANALYSIS, 2025–2034, (USD MILLION)
FIGURE 31 MARKET SHARE BY COUNTRY
FIGURE 32 SEA AND SOUTH ASIA DIGITAL MANUFACTURING CURRENT AND FUTURE TYPE ANALYSIS, 2025–2034, (USD MILLION)
FIGURE 33 SEA AND SOUTH ASIA DIGITAL MANUFACTURING CURRENT AND FUTURE END USER ANALYSIS, 2025–2034, (USD MILLION)
FIGURE 34 MARKET SHARE BY COUNTRY
FIGURE 35 MIDDLE EAST AND AFRICA DIGITAL MANUFACTURING CURRENT AND FUTURE TYPE ANALYSIS, 2025–2034, (USD MILLION)
FIGURE 36 MIDDLE EAST AND AFRICA DIGITAL MANUFACTURING CURRENT AND FUTURE END USER ANALYSIS, 2025–2034, (USD MILLION)
FIGURE 37 NORTH AMERICA DIGITAL MANUFACTURING CURRENT AND FUTURE MARKET VOLUME SHARE REGIONAL ANALYSIS, 2025–2034, (USD MILLION)
FIGURE 38 U.S. DIGITAL MANUFACTURING CURRENT AND FUTURE TYPE ANALYSIS, 2025–2034, (USD MILLION)
FIGURE 39 U.S. DIGITAL MANUFACTURING CURRENT AND FUTURE END USER ANALYSIS, 2025–2034, (USD MILLION)
FIGURE 40 CANADA DIGITAL MANUFACTURING CURRENT AND FUTURE TYPE ANALYSIS, 2025–2034, (USD MILLION)
FIGURE 41 CANADA DIGITAL MANUFACTURING CURRENT AND FUTURE END USER ANALYSIS, 2025–2034, (USD MILLION)
FIGURE 42 LATIN AMERICA DIGITAL MANUFACTURING CURRENT AND FUTURE MARKET VOLUME SHARE REGIONAL ANALYSIS, 2025–2034, (USD MILLION)
FIGURE 43 MEXICO DIGITAL MANUFACTURING CURRENT AND FUTURE TYPE ANALYSIS, 2025–2034, (USD MILLION)
FIGURE 44 MEXICO DIGITAL MANUFACTURING CURRENT AND FUTURE END USER ANALYSIS, 2025–2034, (USD MILLION)
FIGURE 45 BRAZIL DIGITAL MANUFACTURING CURRENT AND FUTURE TYPE ANALYSIS, 2025–2034, (USD MILLION)
FIGURE 46 BRAZIL DIGITAL MANUFACTURING CURRENT AND FUTURE END USER ANALYSIS, 2025–2034, (USD MILLION)
FIGURE 47 ARGENTINA DIGITAL MANUFACTURING CURRENT AND FUTURE TYPE ANALYSIS, 2025–2034, (USD MILLION)
FIGURE 48 ARGENTINA DIGITAL MANUFACTURING CURRENT AND FUTURE END USER ANALYSIS, 2025–2034, (USD MILLION)
FIGURE 49 COLUMBIA DIGITAL MANUFACTURING CURRENT AND FUTURE TYPE ANALYSIS, 2025–2034, (USD MILLION)
FIGURE 50 COLUMBIA DIGITAL MANUFACTURING CURRENT AND FUTURE END USER ANALYSIS, 2025–2034, (USD MILLION)
FIGURE 51 REST OF LATIN AMERICA DIGITAL MANUFACTURING CURRENT AND FUTURE TYPE ANALYSIS, 2025–2034, (USD MILLION)
FIGURE 52 REST OF LATIN AMERICA DIGITAL MANUFACTURING CURRENT AND FUTURE END USER ANALYSIS, 2025–2034, (USD MILLION)
FIGURE 53 EASTERN EUROPE DIGITAL MANUFACTURING CURRENT AND FUTURE MARKET VOLUME SHARE REGIONAL ANALYSIS, 2025–2034, (USD MILLION)
FIGURE 54 POLAND DIGITAL MANUFACTURING CURRENT AND FUTURE TYPE ANALYSIS, 2025–2034, (USD MILLION)
FIGURE 55 POLAND DIGITAL MANUFACTURING CURRENT AND FUTURE END USER ANALYSIS, 2025–2034, (USD MILLION)
FIGURE 56 RUSSIA DIGITAL MANUFACTURING CURRENT AND FUTURE TYPE ANALYSIS, 2025–2034, (USD MILLION)
FIGURE 57 RUSSIA DIGITAL MANUFACTURING CURRENT AND FUTURE END USER ANALYSIS, 2025–2034, (USD MILLION)
FIGURE 58 CZECH REPUBLIC DIGITAL MANUFACTURING CURRENT AND FUTURE TYPE ANALYSIS, 2025–2034, (USD MILLION)
FIGURE 59 CZECH REPUBLIC DIGITAL MANUFACTURING CURRENT AND FUTURE END USER ANALYSIS, 2025–2034, (USD MILLION)
FIGURE 60 ROMANIA DIGITAL MANUFACTURING CURRENT AND FUTURE TYPE ANALYSIS, 2025–2034, (USD MILLION)
FIGURE 61 ROMANIA DIGITAL MANUFACTURING CURRENT AND FUTURE END USER ANALYSIS, 2025–2034, (USD MILLION)
FIGURE 62 REST OF EASTERN EUROPE DIGITAL MANUFACTURING CURRENT AND FUTURE TYPE ANALYSIS, 2025–2034, (USD MILLION)
FIGURE 63 REST OF EASTERN EUROPE DIGITAL MANUFACTURING CURRENT AND FUTURE END USER ANALYSIS, 2025–2034, (USD MILLION)
FIGURE 64 WESTERN EUROPE DIGITAL MANUFACTURING CURRENT AND FUTURE MARKET VOLUME SHARE REGIONAL ANALYSIS, 2025–2034, (USD MILLION)
FIGURE 65 GERMANY DIGITAL MANUFACTURING CURRENT AND FUTURE TYPE ANALYSIS, 2025–2034, (USD MILLION)
FIGURE 66 GERMANY DIGITAL MANUFACTURING CURRENT AND FUTURE END USER ANALYSIS, 2025–2034, (USD MILLION)
FIGURE 67 FRANCE DIGITAL MANUFACTURING CURRENT AND FUTURE TYPE ANALYSIS, 2025–2034, (USD MILLION)
FIGURE 68 FRANCE DIGITAL MANUFACTURING CURRENT AND FUTURE END USER ANALYSIS, 2025–2034, (USD MILLION)
FIGURE 69 UK DIGITAL MANUFACTURING CURRENT AND FUTURE TYPE ANALYSIS, 2025–2034, (USD MILLION)
FIGURE 70 UK DIGITAL MANUFACTURING CURRENT AND FUTURE END USER ANALYSIS, 2025–2034, (USD MILLION)
FIGURE 71 SPAIN DIGITAL MANUFACTURING CURRENT AND FUTURE TYPE ANALYSIS, 2025–2034, (USD MILLION)
FIGURE 72 SPAIN DIGITAL MANUFACTURING CURRENT AND FUTURE END USER ANALYSIS, 2025–2034, (USD MILLION)
FIGURE 73 ITALY DIGITAL MANUFACTURING CURRENT AND FUTURE TYPE ANALYSIS, 2025–2034, (USD MILLION)
FIGURE 74 ITALY DIGITAL MANUFACTURING CURRENT AND FUTURE END USER ANALYSIS, 2025–2034, (USD MILLION)
FIGURE 75 REST OF WESTERN EUROPE DIGITAL MANUFACTURING CURRENT AND FUTURE TYPE ANALYSIS, 2025–2034, (USD MILLION)
FIGURE 76 REST OF WESTERN EUROPE DIGITAL MANUFACTURING CURRENT AND FUTURE END USER ANALYSIS, 2025–2034, (USD MILLION)
FIGURE 77 EAST ASIA AND PACIFIC DIGITAL MANUFACTURING CURRENT AND FUTURE MARKET VOLUME SHARE REGIONAL ANALYSIS, 2025–2034, (USD MILLION)
FIGURE 78 CHINA DIGITAL MANUFACTURING CURRENT AND FUTURE TYPE ANALYSIS, 2025–2034, (USD MILLION)
FIGURE 79 CHINA DIGITAL MANUFACTURING CURRENT AND FUTURE END USER ANALYSIS, 2025–2034, (USD MILLION)
FIGURE 80 JAPAN DIGITAL MANUFACTURING CURRENT AND FUTURE TYPE ANALYSIS, 2025–2034, (USD MILLION)
FIGURE 81 JAPAN DIGITAL MANUFACTURING CURRENT AND FUTURE END USER ANALYSIS, 2025–2034, (USD MILLION)
FIGURE 82 AUSTRALIA DIGITAL MANUFACTURING CURRENT AND FUTURE TYPE ANALYSIS, 2025–2034, (USD MILLION)
FIGURE 83 AUSTRALIA DIGITAL MANUFACTURING CURRENT AND FUTURE END USER ANALYSIS, 2025–2034, (USD MILLION)
FIGURE 84 CAMBODIA DIGITAL MANUFACTURING CURRENT AND FUTURE TYPE ANALYSIS, 2025–2034, (USD MILLION)
FIGURE 85 CAMBODIA DIGITAL MANUFACTURING CURRENT AND FUTURE END USER ANALYSIS, 2025–2034, (USD MILLION)
FIGURE 86 FIJI DIGITAL MANUFACTURING CURRENT AND FUTURE TYPE ANALYSIS, 2025–2034, (USD MILLION)
FIGURE 87 FIJI DIGITAL MANUFACTURING CURRENT AND FUTURE END USER ANALYSIS, 2025–2034, (USD MILLION)
FIGURE 88 INDONESIA DIGITAL MANUFACTURING CURRENT AND FUTURE TYPE ANALYSIS, 2025–2034, (USD MILLION)
FIGURE 89 INDONESIA DIGITAL MANUFACTURING CURRENT AND FUTURE END USER ANALYSIS, 2025–2034, (USD MILLION)
FIGURE 90 SOUTH KOREA DIGITAL MANUFACTURING CURRENT AND FUTURE TYPE ANALYSIS, 2025–2034, (USD MILLION)
FIGURE 91 SOUTH KOREA DIGITAL MANUFACTURING CURRENT AND FUTURE END USER ANALYSIS, 2025–2034, (USD MILLION)
FIGURE 92 REST OF EAST ASIA AND PACIFIC DIGITAL MANUFACTURING CURRENT AND FUTURE TYPE ANALYSIS, 2025–2034, (USD MILLION)
FIGURE 93 REST OF EAST ASIA AND PACIFIC DIGITAL MANUFACTURING CURRENT AND FUTURE END USER ANALYSIS, 2025–2034, (USD MILLION)
FIGURE 94 SEA AND SOUTH ASIA DIGITAL MANUFACTURING CURRENT AND FUTURE MARKET VOLUME SHARE REGIONAL ANALYSIS, 2025–2034, (USD MILLION)
FIGURE 95 BANGLADESH DIGITAL MANUFACTURING CURRENT AND FUTURE TYPE ANALYSIS, 2025–2034, (USD MILLION)
FIGURE 96 BANGLADESH DIGITAL MANUFACTURING CURRENT AND FUTURE END USER ANALYSIS, 2025–2034, (USD MILLION)
FIGURE 97 NEW ZEALAND DIGITAL MANUFACTURING CURRENT AND FUTURE TYPE ANALYSIS, 2025–2034, (USD MILLION)
FIGURE 98 NEW ZEALAND DIGITAL MANUFACTURING CURRENT AND FUTURE END USER ANALYSIS, 2025–2034, (USD MILLION)
FIGURE 99 INDIA DIGITAL MANUFACTURING CURRENT AND FUTURE TYPE ANALYSIS, 2025–2034, (USD MILLION)
FIGURE 100 INDIA DIGITAL MANUFACTURING CURRENT AND FUTURE END USER ANALYSIS, 2025–2034, (USD MILLION)
FIGURE 101 SINGAPORE DIGITAL MANUFACTURING CURRENT AND FUTURE TYPE ANALYSIS, 2025–2034, (USD MILLION)
FIGURE 102 SINGAPORE DIGITAL MANUFACTURING CURRENT AND FUTURE END USER ANALYSIS, 2025–2034, (USD MILLION)
FIGURE 103 THAILAND DIGITAL MANUFACTURING CURRENT AND FUTURE TYPE ANALYSIS, 2025–2034, (USD MILLION)
FIGURE 104 THAILAND DIGITAL MANUFACTURING CURRENT AND FUTURE END USER ANALYSIS, 2025–2034, (USD MILLION)
FIGURE 105 TAIWAN DIGITAL MANUFACTURING CURRENT AND FUTURE TYPE ANALYSIS, 2025–2034, (USD MILLION)
FIGURE 106 TAIWAN DIGITAL MANUFACTURING CURRENT AND FUTURE END USER ANALYSIS, 2025–2034, (USD MILLION)
FIGURE 107 MALAYSIA DIGITAL MANUFACTURING CURRENT AND FUTURE TYPE ANALYSIS, 2025–2034, (USD MILLION)
FIGURE 108 MALAYSIA DIGITAL MANUFACTURING CURRENT AND FUTURE END USER ANALYSIS, 2025–2034, (USD MILLION)
FIGURE 109 REST OF SEA AND SOUTH ASIA DIGITAL MANUFACTURING CURRENT AND FUTURE TYPE ANALYSIS, 2025–2034, (USD MILLION)
FIGURE 110 REST OF SEA AND SOUTH ASIA DIGITAL MANUFACTURING CURRENT AND FUTURE END USER ANALYSIS, 2025–2034, (USD MILLION)
FIGURE 111 MIDDLE EAST AND AFRICA DIGITAL MANUFACTURING CURRENT AND FUTURE MARKET VOLUME SHARE REGIONAL ANALYSIS, 2025–2034, (USD MILLION)
FIGURE 112 GCC COUNTRIES DIGITAL MANUFACTURING CURRENT AND FUTURE TYPE ANALYSIS, 2025–2034, (USD MILLION)
FIGURE 113 GCC COUNTRIES DIGITAL MANUFACTURING CURRENT AND FUTURE END USER ANALYSIS, 2025–2034, (USD MILLION)
FIGURE 114 SAUDI ARABIA DIGITAL MANUFACTURING CURRENT AND FUTURE TYPE ANALYSIS, 2025–2034, (USD MILLION)
FIGURE 115 SAUDI ARABIA DIGITAL MANUFACTURING CURRENT AND FUTURE END USER ANALYSIS, 2025–2034, (USD MILLION)
FIGURE 116 UAE DIGITAL MANUFACTURING CURRENT AND FUTURE TYPE ANALYSIS, 2025–2034, (USD MILLION)
FIGURE 117 UAE DIGITAL MANUFACTURING CURRENT AND FUTURE END USER ANALYSIS, 2025–2034, (USD MILLION)
FIGURE 118 BAHRAIN DIGITAL MANUFACTURING CURRENT AND FUTURE TYPE ANALYSIS, 2025–2034, (USD MILLION)
FIGURE 119 BAHRAIN DIGITAL MANUFACTURING CURRENT AND FUTURE END USER ANALYSIS, 2025–2034, (USD MILLION)
FIGURE 120 KUWAIT DIGITAL MANUFACTURING CURRENT AND FUTURE TYPE ANALYSIS, 2025–2034, (USD MILLION)
FIGURE 121 KUWAIT DIGITAL MANUFACTURING CURRENT AND FUTURE END USER ANALYSIS, 2025–2034, (USD MILLION)
FIGURE 122 OMAN DIGITAL MANUFACTURING CURRENT AND FUTURE TYPE ANALYSIS, 2025–2034, (USD MILLION)
FIGURE 123 OMAN DIGITAL MANUFACTURING CURRENT AND FUTURE END USER ANALYSIS, 2025–2034, (USD MILLION)
FIGURE 124 QATAR DIGITAL MANUFACTURING CURRENT AND FUTURE TYPE ANALYSIS, 2025–2034, (USD MILLION)
FIGURE 125 QATAR DIGITAL MANUFACTURING CURRENT AND FUTURE END USER ANALYSIS, 2025–2034, (USD MILLION)
FIGURE 126 EGYPT DIGITAL MANUFACTURING CURRENT AND FUTURE TYPE ANALYSIS, 2025–2034, (USD MILLION)
FIGURE 127 EGYPT DIGITAL MANUFACTURING CURRENT AND FUTURE END USER ANALYSIS, 2025–2034, (USD MILLION)
FIGURE 128 NIGERIA DIGITAL MANUFACTURING CURRENT AND FUTURE TYPE ANALYSIS, 2025–2034, (USD MILLION)
FIGURE 129 NIGERIA DIGITAL MANUFACTURING CURRENT AND FUTURE END USER ANALYSIS, 2025–2034, (USD MILLION)
FIGURE 130 SOUTH AFRICA DIGITAL MANUFACTURING CURRENT AND FUTURE TYPE ANALYSIS, 2025–2034, (USD MILLION)
FIGURE 131 SOUTH AFRICA DIGITAL MANUFACTURING CURRENT AND FUTURE END USER ANALYSIS, 2025–2034, (USD MILLION)
FIGURE 132 ISRAEL DIGITAL MANUFACTURING CURRENT AND FUTURE TYPE ANALYSIS, 2025–2034, (USD MILLION)
FIGURE 133 ISRAEL DIGITAL MANUFACTURING CURRENT AND FUTURE END USER ANALYSIS, 2025–2034, (USD MILLION)
FIGURE 134 REST OF MEA DIGITAL MANUFACTURING CURRENT AND FUTURE TYPE ANALYSIS, 2025–2034, (USD MILLION)
FIGURE 135 REST OF MEA DIGITAL MANUFACTURING CURRENT AND FUTURE END USER ANALYSIS, 2025–2034, (USD MILLION)
FIGURE 136 U. S. MARKET SHARE ANALYSIS BY TYPE (2024)
FIGURE 137 U. S. MARKET SHARE ANALYSIS BY END USER (2024)
FIGURE 138 CANADA MARKET SHARE ANALYSIS BY TYPE (2024)
FIGURE 139 CANADA MARKET SHARE ANALYSIS BY END USER (2024)
FIGURE 140 MEXICO MARKET SHARE ANALYSIS BY TYPE (2024)
FIGURE 141 MEXICO MARKET SHARE ANALYSIS BY END USER (2024)
FIGURE 142 CHINA MARKET SHARE ANALYSIS BY TYPE (2024)
FIGURE 143 CHINA MARKET SHARE ANALYSIS BY END USER (2024)
FIGURE 144 JAPAN MARKET SHARE ANALYSIS BY TYPE (2024)
FIGURE 145 JAPAN MARKET SHARE ANALYSIS BY END USER (2024)
FIGURE 146 INDIA MARKET SHARE ANALYSIS BY TYPE (2024)
FIGURE 147 INDIA MARKET SHARE ANALYSIS BY END USER (2024)
FIGURE 148 SOUTH KOREA MARKET SHARE ANALYSIS BY TYPE (2024)
FIGURE 149 SOUTH KOREA MARKET SHARE ANALYSIS BY END USER (2024)
FIGURE 150 SAUDI ARABIA MARKET SHARE ANALYSIS BY TYPE (2024)
FIGURE 151 SAUDI ARABIA MARKET SHARE ANALYSIS BY END USER (2024)
FIGURE 152 UAE MARKET SHARE ANALYSIS BY TYPE (2024)
FIGURE 153 UAE MARKET SHARE ANALYSIS BY END USER (2024)
FIGURE 154 EGYPT MARKET SHARE ANALYSIS BY TYPE (2024)
FIGURE 155 EGYPT MARKET SHARE ANALYSIS BY END USER (2024)
FIGURE 156 NIGERIA MARKET SHARE ANALYSIS BY TYPE (2024)
FIGURE 157 NIGERIA MARKET SHARE ANALYSIS BY END USER (2024)
FIGURE 158 SOUTH AFRICA MARKET SHARE ANALYSIS BY TYPE (2024)
FIGURE 159 SOUTH AFRICA MARKET SHARE ANALYSIS BY END USER (2024)
FIGURE 160 GERMANY MARKET SHARE ANALYSIS BY TYPE (2024)
FIGURE 161 GERMANY MARKET SHARE ANALYSIS BY END USER (2024)
FIGURE 162 FRANCE MARKET SHARE ANALYSIS BY TYPE (2024)
FIGURE 163 FRANCE MARKET SHARE ANALYSIS BY END USER (2024)
FIGURE 164 UK MARKET SHARE ANALYSIS BY TYPE (2024)
FIGURE 165 UK MARKET SHARE ANALYSIS BY END USER (2024)
FIGURE 166 SPAIN MARKET SHARE ANALYSIS BY TYPE (2024)
FIGURE 167 SPAIN MARKET SHARE ANALYSIS BY END USER (2024)
FIGURE 168 ITALY MARKET SHARE ANALYSIS BY TYPE (2024)
FIGURE 169 ITALY MARKET SHARE ANALYSIS BY END USER (2024)
FIGURE 170 BRAZIL MARKET SHARE ANALYSIS BY TYPE (2024)
FIGURE 171 BRAZIL MARKET SHARE ANALYSIS BY END USER (2024)
FIGURE 172 ARGENTINA MARKET SHARE ANALYSIS BY TYPE (2024)
FIGURE 173 ARGENTINA MARKET SHARE ANALYSIS BY END USER (2024)
FIGURE 174 COLUMBIA MARKET SHARE ANALYSIS BY TYPE (2024)
FIGURE 175 COLUMBIA MARKET SHARE ANALYSIS BY END USER (2024)
FIGURE 176 GLOBAL DIGITAL MANUFACTURING CURRENT AND FUTURE MARKET KEY COUNTRY LEVEL ANALYSIS, 2024–2034, (USD MILLION)
FIGURE 177 FINANCIAL OVERVIEW:
Key Player Analysis:
Siemens AG: Siemens AG is a global leader in digital manufacturing and automation solutions, offering comprehensive software and hardware under its “Digital Industries Software” division. Its flagship “Xcelerator” platform integrates design, simulation, and real-time analytics, enabling seamless product lifecycle management (PLM). Siemens’ commitment to open digital ecosystems and AI integration positions it at the forefront of smart manufacturing innovation worldwide.
Dassault Systèmes SE: Dassault Systèmes leads the market with its “3DEXPERIENCE” platform, providing digital twin capabilities across industries such as aerospace, automotive, and industrial equipment. The company’s focus on virtual prototyping, sustainability, and collaborative design makes it a strategic partner for manufacturers transitioning to digital ecosystems. Its solutions enhance simulation accuracy, reduce design errors, and optimize manufacturing workflows.
Autodesk Inc.: Autodesk specializes in advanced design and engineering software such as AutoCAD and Fusion 360, widely used for 3D modeling, generative design, and digital fabrication. The company’s emphasis on cloud-based solutions enables real-time collaboration and remote project management. Autodesk’s innovative subscription models and sustainability-driven tools cater to both large enterprises and SMEs, supporting digital transformation at every scale.
PTC Inc.: PTC Inc. is renowned for its “ThingWorx” IoT platform and “Creo” CAD software, both of which empower manufacturers to connect, analyze, and optimize production assets. PTC’s strong focus on augmented reality (AR) and industrial IoT integration enhances maintenance and training processes. Through partnerships with companies like Rockwell Automation, PTC is accelerating industrial digitalization and bridging IT and OT systems efficiently.
Honeywell International Inc.: Honeywell provides a wide range of automation and industrial control systems designed to optimize plant performance and safety. Its “Forge” analytics platform leverages AI and machine learning for predictive maintenance and performance optimization. The company’s expertise in aerospace, energy, and manufacturing sectors enables end-to-end digital transformation, making it a key enabler of smart industrial ecosystems globally.
Key Players
Siemens AG
Dassault Systèmes SE
Autodesk Inc.
PTC Inc.
Honeywell International Inc.
General Electric (GE)
Rockwell Automation, Inc.
SAP SE
ABB Ltd.
Bosch Rexroth AG
IBM Corporation
Oracle Corporation
ANSYS, Inc.
Hexagon AB
Schneider Electric SE
Mitsubishi Electric Corporation
Siemens Energy
Fujitsu Limited
Dassault Aviation
Emerson Electric Co.
Drivers:
Rapid Adoption of Industry 4.0 and Smart Factory Technologies
The increasing adoption of Industry 4.0 is a major catalyst propelling the digital manufacturing market. Companies are integrating intelligent automation, robotics, and connected systems to enhance efficiency, reduce waste, and improve product quality. The ability of smart factories to collect and analyze real-time data through IoT sensors has revolutionized predictive maintenance and decision-making processes. Governments worldwide are also promoting digitalization through industrial innovation policies and funding initiatives. This shift towards data-driven manufacturing is enabling organizations to achieve agility, transparency, and sustainability — critical factors for competitiveness in global markets.
Rising Demand for Product Customization and Accelerated Prototyping
Consumer expectations for personalized products are reshaping manufacturing processes. Digital manufacturing solutions, including additive manufacturing (3D printing) and digital twins, allow for faster prototyping, shorter design cycles, and cost-efficient customization. This capability is particularly crucial in industries such as automotive, aerospace, and healthcare, where precision and performance are paramount. As competition intensifies, the ability to deliver customized products efficiently has become a key differentiator, driving investment in digital tools and virtual design technologies.
Restraints:
High Implementation Costs and Skill Gaps
Despite its benefits, the deployment of digital manufacturing systems involves substantial upfront investment in software, hardware, and infrastructure. Small and medium-sized enterprises (SMEs) often struggle with the capital required for such transformation. Additionally, the lack of skilled professionals proficient in data analytics, AI, and automation hinders the full-scale adoption of these technologies. The need for continuous workforce training and process integration also contributes to slower implementation rates, especially in emerging markets.
Cybersecurity Risks and Data Privacy Concerns
As manufacturing processes become more connected, the risk of cyberattacks and data breaches increases significantly. Industrial control systems and IoT networks are often targeted by malicious entities seeking to disrupt operations or steal intellectual property. Ensuring data protection across multiple digital touchpoints remains a top concern for manufacturers. The lack of standardized cybersecurity frameworks in industrial IoT environments can lead to vulnerabilities that threaten operational stability and stakeholder confidence.
Opportunities:
Expansion of Cloud-based and AI-powered Manufacturing Solutions
The growing shift toward cloud-enabled digital manufacturing platforms offers scalable, cost-efficient solutions for enterprises of all sizes. Integration of artificial intelligence and machine learning in manufacturing operations enables predictive analytics, process optimization, and quality assurance. Cloud-based systems further enhance collaboration across supply chains, allowing real-time visibility and agility. As industries embrace hybrid work models and remote monitoring, the demand for intelligent, cloud-driven manufacturing solutions will continue to accelerate globally.
Growing Investments in Sustainable and Energy-efficient Production
The increasing focus on sustainability and carbon reduction presents vast opportunities for digital manufacturing providers. Technologies like digital twins, AI-based energy management, and additive manufacturing support resource optimization and waste minimization. Manufacturers are adopting eco-friendly production strategies to meet regulatory mandates and corporate social responsibility goals. These sustainability-driven transformations are positioning digital manufacturing as an enabler of green innovation and long-term industrial resilience.
Trends:
Integration of Digital Twins and Industrial Metaverse
The convergence of digital twin technology with the industrial metaverse is a transformative trend reshaping modern manufacturing. Digital twins allow real-time simulation of physical assets, while immersive metaverse environments enhance collaboration, design visualization, and remote troubleshooting. Major industrial players are investing heavily in this integration to improve operational intelligence and virtual workforce training. This trend is expected to redefine product development, testing, and maintenance practices over the next decade.
Expansion of Additive Manufacturing and Robotics
Additive manufacturing (3D printing) continues to revolutionize production flexibility, enabling rapid prototyping, complex geometries, and localized manufacturing. Simultaneously, the integration of collaborative robots (cobots) and autonomous systems is enhancing precision, safety, and efficiency on the production floor. These advancements are fostering “lights-out” manufacturing environments — fully automated systems that operate with minimal human intervention, driving higher productivity and lower costs.
Recent Developments:
June 2025: Siemens launched a cloud-based digital twin platform for small and medium-sized enterprises (SMEs), enabling affordable access to advanced simulation and monitoring tools.
May 2025: Dassault Systèmes acquired a leading AI-driven manufacturing analytics startup, enhancing its capabilities in predictive maintenance and process optimization.
April 2025: General Electric introduced a new predictive maintenance solution for industrial IoT, leveraging AI and machine learning to reduce downtime and maintenance costs.
March 2025: Autodesk announced the integration of generative design tools with its Fusion 360 platform, enabling manufacturers to optimize product designs for performance and sustainability.
February 2025: ABB unveiled a new line of collaborative robots (cobots) designed for flexible, safe, and efficient operation in smart factories.
January 2025: PTC expanded its ThingWorx IoT platform with enhanced cybersecurity features and support for edge computing.