Digital Twin in Aerospace & Defense Market Size, Growth | CAGR 39.5%
Global Digital Twin in Aerospace and Defence Market Size, Share & Technology Analysis By Application (Predictive Maintenance, Design Simulation, Fleet Management, Training & Testing), By Platform (Cloud, On-Premise), By End User (Commercial Aviation, Military, Space), AI & IoT Integration, Defense Modernization Programs, Key Players, Trends & Forecast 2025–2034
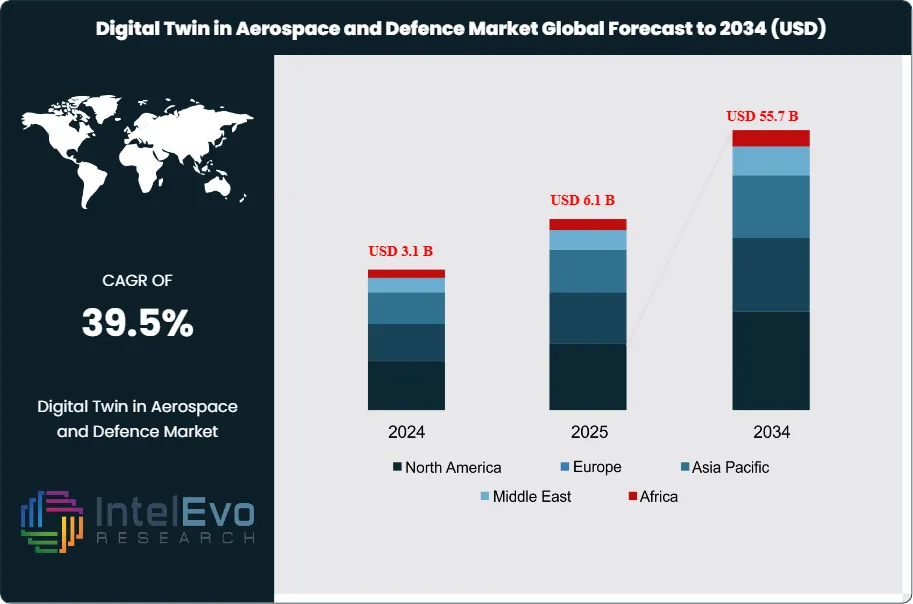
The Digital Twin in Aerospace and Defense Market is estimated at USD 3.1 billion in 2024 and is on track to reach roughly USD 55.7 billion by 2034, implying a robust compound annual growth rate (CAGR) of 39.5% over 2025–2034. This exceptional growth is being driven by rising adoption of predictive maintenance, virtual prototyping, and real-time performance monitoring across aircraft, spacecraft, and defense platforms. Governments and OEMs are increasingly leveraging digital twins to reduce lifecycle costs, improve mission readiness, and accelerate design validation. As defense modernization programs and next-generation aerospace platforms expand, digital twin technology is becoming a foundational capability rather than an optional innovation.
This rapid expansion reflects the sector’s increasing reliance on advanced simulation and predictive modeling to manage complex systems, reduce costs, and improve operational efficiency. North America accounted for 40.7% of global revenue in 2024, valued at USD 8.85 billion, underscoring its position as the leading hub for adoption and investment.
The market has evolved from early-stage pilots to large-scale deployments as aerospace and defense organizations recognize the tangible benefits of digital twins. Historically, physical testing and maintenance cycles dominated cost structures. Today, digital twins enable real-time monitoring, predictive maintenance, and accelerated product development, reducing testing costs by up to 15% and shortening design timelines by as much as 25%. Defense agencies are extending asset lifespans and improving mission readiness, while aerospace manufacturers are applying digital twins to engines, airframes, and full aircraft systems to enhance reliability and safety.
Key growth drivers include the rising complexity of aerospace platforms, the demand for improved system reliability, and the industry-wide push for digital transformation. According to LTIMindtree, 73% of aerospace and defense organizations now maintain a long-term roadmap for digital twin adoption, up from 57% in 2021. Investment levels are rising sharply, with the sector allocating 2.7% of revenue to digital twin initiatives in 2023, a 40% increase year on year. At the same time, 78% of organizations cite technological advancements such as AI-driven modeling, automation, and advanced analytics as the primary enabler of adoption.
Regional trends highlight North America’s dominance, but Europe and Asia-Pacific are emerging as critical growth regions. European defense programs are integrating digital twins into lifecycle management, while Asia-Pacific markets are accelerating adoption in commercial aerospace manufacturing. These regions represent important investment hotspots for stakeholders seeking long-term growth opportunities.
Real-world outcomes reinforce the market’s trajectory. The U.S. Air Force saved €7.47 million by reducing wind tunnel tests for the F-22 through computational modeling, while the U.S. Navy cut aircraft development timelines by 25% using digital twin systems. With 24% of companies already applying digital twins across full lifecycle operations and another 50% planning adoption within two years, the technology is moving from experimentation to strategic necessity. By 2034, digital twins will be central to aerospace and defense competitiveness, driving efficiency, sustainability, and operational resilience.
Key Takeaways
Market Growth: The global digital twin market in aerospace and defense is projected to expand from USD 3.1 billion in 2024 to USD 55.7 billion by 2034, reflecting a CAGR of 39.5% over 2025–2034. Growth is driven by rising demand for predictive maintenance, lifecycle management, and cost reduction in complex aerospace systems.
Component: The component segment accounted for 52.8% of total revenue in 2024, underscoring its central role in enabling simulation, monitoring, and predictive analytics across aircraft systems and defense platforms.
Deployment: On-premise solutions captured 64.6% of the market in 2024, reflecting the sector’s preference for localized infrastructure to safeguard sensitive defense and aerospace data.
Driver: Digital transformation initiatives are accelerating adoption. According to LTIMindtree, 73% of aerospace and defense organizations now maintain a long-term roadmap for digital twin deployment, up from 57% in 2021.
Restraint: High implementation costs and integration challenges remain significant barriers. Smaller enterprises face limited adoption capacity, with upfront investments often exceeding USD 5–10 million for full-scale deployment.
Opportunity: Product design and development applications represented 25.2% of market share in 2024. This segment is expected to grow rapidly as digital twins shorten design cycles by up to 25% and reduce testing costs by 15%, creating strong returns for aerospace manufacturers.
Trend: Adoption is shifting from pilots to enterprise-wide integration. In 2023, 24% of aerospace and defense companies used digital twins across the full product lifecycle, while another 50% planned adoption within two years, signaling rapid mainstreaming of the technology.
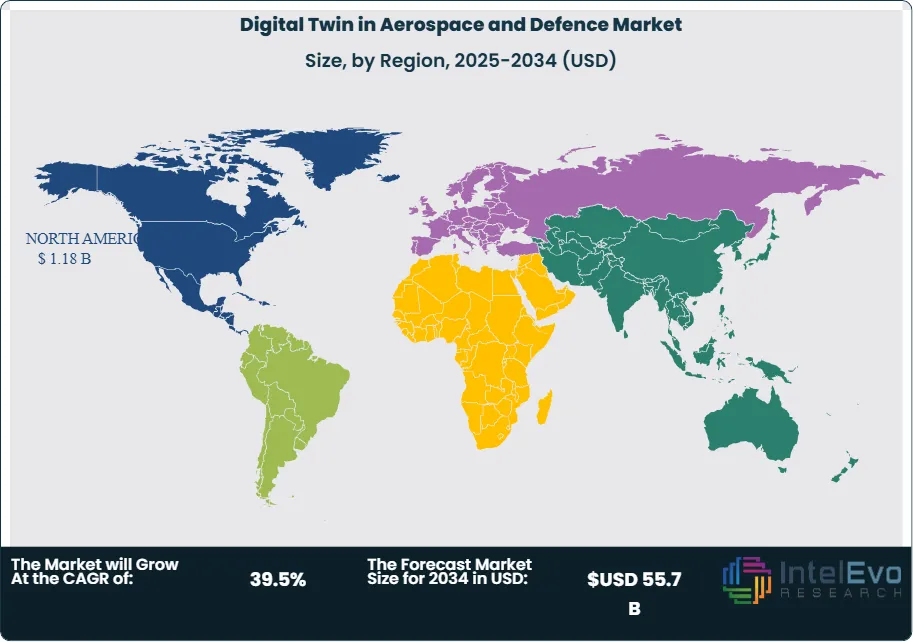
Regional Analysis: North America led with 40.7% share in 2024, generating USD 8.85 billion in revenue. The U.S. market alone reached USD 0.6 billion and is forecast to grow at a CAGR of 38.2%, outpacing the global average. Europe is advancing adoption in defense programs, while Asia-Pacific is emerging as a high-growth hub in commercial aerospace manufacturing.
Type Analysis
High-performance concrete continues to dominate the advanced concrete market in 2025, supported by its superior strength, durability, and ability to withstand extreme environmental conditions. This segment is widely adopted in large-scale infrastructure and defense-related projects where structural integrity is critical. Industry estimates suggest that high-performance concrete accounts for more than 45% of total market revenues, with demand expected to grow at a CAGR of over 7% through 2030 as governments and private developers prioritize resilient construction.
Self-consolidating concrete is gaining traction due to its efficiency in reducing labor costs and improving construction speed. Its ability to flow easily into complex formworks without mechanical vibration makes it particularly attractive for high-rise buildings and precast applications. Adoption is expanding in both developed and emerging markets, with Asia Pacific showing the fastest uptake. This segment is projected to grow at a CAGR above 8% over the forecast period, driven by urbanization and the need for faster project delivery.
Other specialty concretes, including lightweight and fiber-reinforced variants, are carving out niche applications in aerospace-related facilities, industrial flooring, and sustainable construction. While their market share remains smaller, these types are expected to see steady growth as sustainability regulations tighten and demand for energy-efficient materials rises.
Application Analysis
Pavers represent one of the largest application areas, supported by rapid urban infrastructure development and public investment in smart city projects. In 2025, pavers account for nearly 35% of total demand, with growth concentrated in Asia Pacific and the Middle East. Governments in India, China, and the Gulf states are driving large-scale adoption through road modernization and airport expansion programs.
Retaining walls are another significant application, particularly in regions with challenging terrain and high urban density. The segment is expanding at a CAGR of 6.5% as cities invest in slope stabilization, flood control, and land-use optimization. North America and Europe remain key markets, with regulatory emphasis on sustainable land management practices further supporting demand.
Other applications, including precast elements for industrial and defense facilities, are gaining importance. These solutions reduce construction timelines and improve structural consistency, making them attractive for aerospace manufacturing hubs and military infrastructure projects.
End-Use Analysis
Residential construction remains the largest end-use segment, accounting for over 40% of market revenues in 2025. Rising urban populations and government-backed affordable housing programs are fueling demand, particularly in Asia Pacific and Latin America. The use of self-consolidating concrete in residential projects is expanding due to its efficiency in high-volume housing developments.
Commercial buildings represent the second-largest segment, with demand driven by office complexes, retail centers, and airport expansions. This category is expected to grow at a CAGR of 7.2% through 2030, supported by post-pandemic recovery in commercial real estate and rising investment in logistics hubs.
Industrial construction, including aerospace and defense facilities, is a smaller but high-value segment. The adoption of high-performance and specialty concretes in this category is accelerating as manufacturers prioritize durability, safety, and compliance with stringent industry standards.
Regional Analysis
North America continues to lead the global market, holding more than 38% of revenues in 2025. The region benefits from advanced construction technologies, strong investment in defense infrastructure, and a mature aerospace sector. The U.S. remains the largest contributor, with federal infrastructure programs and defense modernization initiatives driving demand.
Europe follows closely, supported by sustainability-focused regulations and large-scale infrastructure renewal projects. Countries such as Germany, France, and the UK are investing heavily in green construction materials, which is accelerating the adoption of self-consolidating and fiber-reinforced concretes.
Asia Pacific is the fastest-growing region, projected to expand at a CAGR above 8% through 2030. Rapid urbanization, large-scale housing programs, and significant investment in airports and defense facilities are fueling demand. China and India dominate regional consumption, while Southeast Asia is emerging as a new growth hub.
Latin America and the Middle East & Africa present smaller but expanding opportunities. Brazil and Mexico are investing in urban infrastructure, while Gulf states are channeling resources into mega-projects and defense-related construction. These regions are expected to see steady growth as governments diversify their economies and expand industrial capacity.
By Solution, Component, Process, System, By Deployment, Cloud, On-premise, By Enterprise Size, Large Enterprises, Small and Medium Enterprises (SMEs), By Application, Product Design & Development, Predictive Maintenance, Business Optimization, Space-Based Monitoring, Others
Research Methodology
Primary Research- 100 Interviews of Stakeholders
Secondary Research
Desk Research
Regional scope
North America (United States, Canada, Mexico)
Latin America (Brazil, Argentina, Columbia)
East Asia And Pacific (China, Japan, South Korea, Australia, Cambodia, Fiji, Indonesia)
Sea And South Asia (India, Singapore, Thailand, Taiwan, Malaysia)
Eastern Europe (Poland, Russia, Czech Republic, Romania)
Western Europe (Germany, U.K., France, Spain, Itlay)
Middle East & Africa (GCC Countries, Egypt, Nigeria, South Africa, Israel)
Competitive Landscape
Siemens AG, Autodesk Inc., Robert Bosch GmbH, Amazon Web Services, Inc., Dassault Systèmes, Rockwell Automation, Microsoft Corporation, General Electric, PTC Inc., SAP SE, ANSYS, Inc., ABB Group, AVEVA Group plc, Hexagon AB, Bentley Systems Inc., International Business Machines Corporation, Others
Customization Scope
Customization for segments, region/country-level will be provided. Moreover, additional customization can be done based on the requirements.
Pricing and Purchase Options
Avail customized purchase options to meet your exact research needs. We have three licenses to opt for: Single User License, Multi-User License (Up to 5 Users), Corporate Use License (Unlimited User and Printable PDF).
TABLE OF CONTENTS
1. EXECUTIVE SUMMARY
1.1. MARKET SNAPSHOT
1.2. KEY FINDINGS & INSIGHTS
1.3. ANALYST RECOMMENDATIONS
1.4. FUTURE OUTLOOK
2. RESEARCH METHODOLOGY
2.1. MARKET DEFINITION & SCOPE
2.2. RESEARCH OBJECTIVES: PRIMARY & SECONDARY DATA SOURCES
2.3. DATA COLLECTION SOURCES
2.3.1. COVERAGE OF 100+ PRIMARY RESEARCH/CONSULTATION CALLS WITH INDUSTRY STAKEHOLDERS
FIGURE 17 NORTH AMERICA DIGITAL TWIN IN AEROSPACE AND DEFENCE CURRENT AND FUTURE TYPE ANALYSIS, 2025–2034, (USD MILLION)
FIGURE 18 NORTH AMERICA DIGITAL TWIN IN AEROSPACE AND DEFENCE CURRENT AND FUTURE END USER ANALYSIS, 2025–2034, (USD MILLION)
FIGURE 19 MARKET SHARE BY COUNTRY
FIGURE 20 LATIN AMERICA DIGITAL TWIN IN AEROSPACE AND DEFENCE CURRENT AND FUTURE TYPE ANALYSIS, 2025–2034, (USD MILLION)
FIGURE 21 LATIN AMERICA DIGITAL TWIN IN AEROSPACE AND DEFENCE CURRENT AND FUTURE END USER ANALYSIS, 2025–2034, (USD MILLION)
FIGURE 22 MARKET SHARE BY COUNTRY
FIGURE 23 EASTERN EUROPE DIGITAL TWIN IN AEROSPACE AND DEFENCE CURRENT AND FUTURE TYPE ANALYSIS, 2025–2034, (USD MILLION)
FIGURE 24 EASTERN EUROPE DIGITAL TWIN IN AEROSPACE AND DEFENCE CURRENT AND FUTURE END USER ANALYSIS, 2025–2034, (USD MILLION)
FIGURE 25 MARKET SHARE BY COUNTRY
FIGURE 26 WESTERN EUROPE DIGITAL TWIN IN AEROSPACE AND DEFENCE CURRENT AND FUTURE TYPE ANALYSIS, 2025–2034, (USD MILLION)
FIGURE 27 WESTERN EUROPE DIGITAL TWIN IN AEROSPACE AND DEFENCE CURRENT AND FUTURE END USER ANALYSIS, 2025–2034, (USD MILLION)
FIGURE 28 MARKET SHARE BY COUNTRY
FIGURE 29 EAST ASIA AND PACIFIC DIGITAL TWIN IN AEROSPACE AND DEFENCE CURRENT AND FUTURE TYPE ANALYSIS, 2025–2034, (USD MILLION)
FIGURE 30 EAST ASIA AND PACIFIC DIGITAL TWIN IN AEROSPACE AND DEFENCE CURRENT AND FUTURE END USER ANALYSIS, 2025–2034, (USD MILLION)
FIGURE 31 MARKET SHARE BY COUNTRY
FIGURE 32 SEA AND SOUTH ASIA DIGITAL TWIN IN AEROSPACE AND DEFENCE CURRENT AND FUTURE TYPE ANALYSIS, 2025–2034, (USD MILLION)
FIGURE 33 SEA AND SOUTH ASIA DIGITAL TWIN IN AEROSPACE AND DEFENCE CURRENT AND FUTURE END USER ANALYSIS, 2025–2034, (USD MILLION)
FIGURE 34 MARKET SHARE BY COUNTRY
FIGURE 35 MIDDLE EAST AND AFRICA DIGITAL TWIN IN AEROSPACE AND DEFENCE CURRENT AND FUTURE TYPE ANALYSIS, 2025–2034, (USD MILLION)
FIGURE 36 MIDDLE EAST AND AFRICA DIGITAL TWIN IN AEROSPACE AND DEFENCE CURRENT AND FUTURE END USER ANALYSIS, 2025–2034, (USD MILLION)
FIGURE 37 NORTH AMERICA DIGITAL TWIN IN AEROSPACE AND DEFENCE CURRENT AND FUTURE MARKET VOLUME SHARE REGIONAL ANALYSIS, 2025–2034, (USD MILLION)
FIGURE 38 U.S. DIGITAL TWIN IN AEROSPACE AND DEFENCE CURRENT AND FUTURE TYPE ANALYSIS, 2025–2034, (USD MILLION)
FIGURE 39 U.S. DIGITAL TWIN IN AEROSPACE AND DEFENCE CURRENT AND FUTURE END USER ANALYSIS, 2025–2034, (USD MILLION)
FIGURE 40 CANADA DIGITAL TWIN IN AEROSPACE AND DEFENCE CURRENT AND FUTURE TYPE ANALYSIS, 2025–2034, (USD MILLION)
FIGURE 41 CANADA DIGITAL TWIN IN AEROSPACE AND DEFENCE CURRENT AND FUTURE END USER ANALYSIS, 2025–2034, (USD MILLION)
FIGURE 42 LATIN AMERICA DIGITAL TWIN IN AEROSPACE AND DEFENCE CURRENT AND FUTURE MARKET VOLUME SHARE REGIONAL ANALYSIS, 2025–2034, (USD MILLION)
FIGURE 43 MEXICO DIGITAL TWIN IN AEROSPACE AND DEFENCE CURRENT AND FUTURE TYPE ANALYSIS, 2025–2034, (USD MILLION)
FIGURE 44 MEXICO DIGITAL TWIN IN AEROSPACE AND DEFENCE CURRENT AND FUTURE END USER ANALYSIS, 2025–2034, (USD MILLION)
FIGURE 45 BRAZIL DIGITAL TWIN IN AEROSPACE AND DEFENCE CURRENT AND FUTURE TYPE ANALYSIS, 2025–2034, (USD MILLION)
FIGURE 46 BRAZIL DIGITAL TWIN IN AEROSPACE AND DEFENCE CURRENT AND FUTURE END USER ANALYSIS, 2025–2034, (USD MILLION)
FIGURE 47 ARGENTINA DIGITAL TWIN IN AEROSPACE AND DEFENCE CURRENT AND FUTURE TYPE ANALYSIS, 2025–2034, (USD MILLION)
FIGURE 48 ARGENTINA DIGITAL TWIN IN AEROSPACE AND DEFENCE CURRENT AND FUTURE END USER ANALYSIS, 2025–2034, (USD MILLION)
FIGURE 49 COLUMBIA DIGITAL TWIN IN AEROSPACE AND DEFENCE CURRENT AND FUTURE TYPE ANALYSIS, 2025–2034, (USD MILLION)
FIGURE 50 COLUMBIA DIGITAL TWIN IN AEROSPACE AND DEFENCE CURRENT AND FUTURE END USER ANALYSIS, 2025–2034, (USD MILLION)
FIGURE 51 REST OF LATIN AMERICA DIGITAL TWIN IN AEROSPACE AND DEFENCE CURRENT AND FUTURE TYPE ANALYSIS, 2025–2034, (USD MILLION)
FIGURE 52 REST OF LATIN AMERICA DIGITAL TWIN IN AEROSPACE AND DEFENCE CURRENT AND FUTURE END USER ANALYSIS, 2025–2034, (USD MILLION)
FIGURE 53 EASTERN EUROPE DIGITAL TWIN IN AEROSPACE AND DEFENCE CURRENT AND FUTURE MARKET VOLUME SHARE REGIONAL ANALYSIS, 2025–2034, (USD MILLION)
FIGURE 54 POLAND DIGITAL TWIN IN AEROSPACE AND DEFENCE CURRENT AND FUTURE TYPE ANALYSIS, 2025–2034, (USD MILLION)
FIGURE 55 POLAND DIGITAL TWIN IN AEROSPACE AND DEFENCE CURRENT AND FUTURE END USER ANALYSIS, 2025–2034, (USD MILLION)
FIGURE 56 RUSSIA DIGITAL TWIN IN AEROSPACE AND DEFENCE CURRENT AND FUTURE TYPE ANALYSIS, 2025–2034, (USD MILLION)
FIGURE 57 RUSSIA DIGITAL TWIN IN AEROSPACE AND DEFENCE CURRENT AND FUTURE END USER ANALYSIS, 2025–2034, (USD MILLION)
FIGURE 58 CZECH REPUBLIC DIGITAL TWIN IN AEROSPACE AND DEFENCE CURRENT AND FUTURE TYPE ANALYSIS, 2025–2034, (USD MILLION)
FIGURE 59 CZECH REPUBLIC DIGITAL TWIN IN AEROSPACE AND DEFENCE CURRENT AND FUTURE END USER ANALYSIS, 2025–2034, (USD MILLION)
FIGURE 60 ROMANIA DIGITAL TWIN IN AEROSPACE AND DEFENCE CURRENT AND FUTURE TYPE ANALYSIS, 2025–2034, (USD MILLION)
FIGURE 61 ROMANIA DIGITAL TWIN IN AEROSPACE AND DEFENCE CURRENT AND FUTURE END USER ANALYSIS, 2025–2034, (USD MILLION)
FIGURE 62 REST OF EASTERN EUROPE DIGITAL TWIN IN AEROSPACE AND DEFENCE CURRENT AND FUTURE TYPE ANALYSIS, 2025–2034, (USD MILLION)
FIGURE 63 REST OF EASTERN EUROPE DIGITAL TWIN IN AEROSPACE AND DEFENCE CURRENT AND FUTURE END USER ANALYSIS, 2025–2034, (USD MILLION)
FIGURE 64 WESTERN EUROPE DIGITAL TWIN IN AEROSPACE AND DEFENCE CURRENT AND FUTURE MARKET VOLUME SHARE REGIONAL ANALYSIS, 2025–2034, (USD MILLION)
FIGURE 65 GERMANY DIGITAL TWIN IN AEROSPACE AND DEFENCE CURRENT AND FUTURE TYPE ANALYSIS, 2025–2034, (USD MILLION)
FIGURE 66 GERMANY DIGITAL TWIN IN AEROSPACE AND DEFENCE CURRENT AND FUTURE END USER ANALYSIS, 2025–2034, (USD MILLION)
FIGURE 67 FRANCE DIGITAL TWIN IN AEROSPACE AND DEFENCE CURRENT AND FUTURE TYPE ANALYSIS, 2025–2034, (USD MILLION)
FIGURE 68 FRANCE DIGITAL TWIN IN AEROSPACE AND DEFENCE CURRENT AND FUTURE END USER ANALYSIS, 2025–2034, (USD MILLION)
FIGURE 69 UK DIGITAL TWIN IN AEROSPACE AND DEFENCE CURRENT AND FUTURE TYPE ANALYSIS, 2025–2034, (USD MILLION)
FIGURE 70 UK DIGITAL TWIN IN AEROSPACE AND DEFENCE CURRENT AND FUTURE END USER ANALYSIS, 2025–2034, (USD MILLION)
FIGURE 71 SPAIN DIGITAL TWIN IN AEROSPACE AND DEFENCE CURRENT AND FUTURE TYPE ANALYSIS, 2025–2034, (USD MILLION)
FIGURE 72 SPAIN DIGITAL TWIN IN AEROSPACE AND DEFENCE CURRENT AND FUTURE END USER ANALYSIS, 2025–2034, (USD MILLION)
FIGURE 73 ITALY DIGITAL TWIN IN AEROSPACE AND DEFENCE CURRENT AND FUTURE TYPE ANALYSIS, 2025–2034, (USD MILLION)
FIGURE 74 ITALY DIGITAL TWIN IN AEROSPACE AND DEFENCE CURRENT AND FUTURE END USER ANALYSIS, 2025–2034, (USD MILLION)
FIGURE 75 REST OF WESTERN EUROPE DIGITAL TWIN IN AEROSPACE AND DEFENCE CURRENT AND FUTURE TYPE ANALYSIS, 2025–2034, (USD MILLION)
FIGURE 76 REST OF WESTERN EUROPE DIGITAL TWIN IN AEROSPACE AND DEFENCE CURRENT AND FUTURE END USER ANALYSIS, 2025–2034, (USD MILLION)
FIGURE 77 EAST ASIA AND PACIFIC DIGITAL TWIN IN AEROSPACE AND DEFENCE CURRENT AND FUTURE MARKET VOLUME SHARE REGIONAL ANALYSIS, 2025–2034, (USD MILLION)
FIGURE 78 CHINA DIGITAL TWIN IN AEROSPACE AND DEFENCE CURRENT AND FUTURE TYPE ANALYSIS, 2025–2034, (USD MILLION)
FIGURE 79 CHINA DIGITAL TWIN IN AEROSPACE AND DEFENCE CURRENT AND FUTURE END USER ANALYSIS, 2025–2034, (USD MILLION)
FIGURE 80 JAPAN DIGITAL TWIN IN AEROSPACE AND DEFENCE CURRENT AND FUTURE TYPE ANALYSIS, 2025–2034, (USD MILLION)
FIGURE 81 JAPAN DIGITAL TWIN IN AEROSPACE AND DEFENCE CURRENT AND FUTURE END USER ANALYSIS, 2025–2034, (USD MILLION)
FIGURE 82 AUSTRALIA DIGITAL TWIN IN AEROSPACE AND DEFENCE CURRENT AND FUTURE TYPE ANALYSIS, 2025–2034, (USD MILLION)
FIGURE 83 AUSTRALIA DIGITAL TWIN IN AEROSPACE AND DEFENCE CURRENT AND FUTURE END USER ANALYSIS, 2025–2034, (USD MILLION)
FIGURE 84 CAMBODIA DIGITAL TWIN IN AEROSPACE AND DEFENCE CURRENT AND FUTURE TYPE ANALYSIS, 2025–2034, (USD MILLION)
FIGURE 85 CAMBODIA DIGITAL TWIN IN AEROSPACE AND DEFENCE CURRENT AND FUTURE END USER ANALYSIS, 2025–2034, (USD MILLION)
FIGURE 86 FIJI DIGITAL TWIN IN AEROSPACE AND DEFENCE CURRENT AND FUTURE TYPE ANALYSIS, 2025–2034, (USD MILLION)
FIGURE 87 FIJI DIGITAL TWIN IN AEROSPACE AND DEFENCE CURRENT AND FUTURE END USER ANALYSIS, 2025–2034, (USD MILLION)
FIGURE 88 INDONESIA DIGITAL TWIN IN AEROSPACE AND DEFENCE CURRENT AND FUTURE TYPE ANALYSIS, 2025–2034, (USD MILLION)
FIGURE 89 INDONESIA DIGITAL TWIN IN AEROSPACE AND DEFENCE CURRENT AND FUTURE END USER ANALYSIS, 2025–2034, (USD MILLION)
FIGURE 90 SOUTH KOREA DIGITAL TWIN IN AEROSPACE AND DEFENCE CURRENT AND FUTURE TYPE ANALYSIS, 2025–2034, (USD MILLION)
FIGURE 91 SOUTH KOREA DIGITAL TWIN IN AEROSPACE AND DEFENCE CURRENT AND FUTURE END USER ANALYSIS, 2025–2034, (USD MILLION)
FIGURE 92 REST OF EAST ASIA AND PACIFIC DIGITAL TWIN IN AEROSPACE AND DEFENCE CURRENT AND FUTURE TYPE ANALYSIS, 2025–2034, (USD MILLION)
FIGURE 93 REST OF EAST ASIA AND PACIFIC DIGITAL TWIN IN AEROSPACE AND DEFENCE CURRENT AND FUTURE END USER ANALYSIS, 2025–2034, (USD MILLION)
FIGURE 94 SEA AND SOUTH ASIA DIGITAL TWIN IN AEROSPACE AND DEFENCE CURRENT AND FUTURE MARKET VOLUME SHARE REGIONAL ANALYSIS, 2025–2034, (USD MILLION)
FIGURE 95 BANGLADESH DIGITAL TWIN IN AEROSPACE AND DEFENCE CURRENT AND FUTURE TYPE ANALYSIS, 2025–2034, (USD MILLION)
FIGURE 96 BANGLADESH DIGITAL TWIN IN AEROSPACE AND DEFENCE CURRENT AND FUTURE END USER ANALYSIS, 2025–2034, (USD MILLION)
FIGURE 97 NEW ZEALAND DIGITAL TWIN IN AEROSPACE AND DEFENCE CURRENT AND FUTURE TYPE ANALYSIS, 2025–2034, (USD MILLION)
FIGURE 98 NEW ZEALAND DIGITAL TWIN IN AEROSPACE AND DEFENCE CURRENT AND FUTURE END USER ANALYSIS, 2025–2034, (USD MILLION)
FIGURE 99 INDIA DIGITAL TWIN IN AEROSPACE AND DEFENCE CURRENT AND FUTURE TYPE ANALYSIS, 2025–2034, (USD MILLION)
FIGURE 100 INDIA DIGITAL TWIN IN AEROSPACE AND DEFENCE CURRENT AND FUTURE END USER ANALYSIS, 2025–2034, (USD MILLION)
FIGURE 101 SINGAPORE DIGITAL TWIN IN AEROSPACE AND DEFENCE CURRENT AND FUTURE TYPE ANALYSIS, 2025–2034, (USD MILLION)
FIGURE 102 SINGAPORE DIGITAL TWIN IN AEROSPACE AND DEFENCE CURRENT AND FUTURE END USER ANALYSIS, 2025–2034, (USD MILLION)
FIGURE 103 THAILAND DIGITAL TWIN IN AEROSPACE AND DEFENCE CURRENT AND FUTURE TYPE ANALYSIS, 2025–2034, (USD MILLION)
FIGURE 104 THAILAND DIGITAL TWIN IN AEROSPACE AND DEFENCE CURRENT AND FUTURE END USER ANALYSIS, 2025–2034, (USD MILLION)
FIGURE 105 TAIWAN DIGITAL TWIN IN AEROSPACE AND DEFENCE CURRENT AND FUTURE TYPE ANALYSIS, 2025–2034, (USD MILLION)
FIGURE 106 TAIWAN DIGITAL TWIN IN AEROSPACE AND DEFENCE CURRENT AND FUTURE END USER ANALYSIS, 2025–2034, (USD MILLION)
FIGURE 107 MALAYSIA DIGITAL TWIN IN AEROSPACE AND DEFENCE CURRENT AND FUTURE TYPE ANALYSIS, 2025–2034, (USD MILLION)
FIGURE 108 MALAYSIA DIGITAL TWIN IN AEROSPACE AND DEFENCE CURRENT AND FUTURE END USER ANALYSIS, 2025–2034, (USD MILLION)
FIGURE 109 REST OF SEA AND SOUTH ASIA DIGITAL TWIN IN AEROSPACE AND DEFENCE CURRENT AND FUTURE TYPE ANALYSIS, 2025–2034, (USD MILLION)
FIGURE 110 REST OF SEA AND SOUTH ASIA DIGITAL TWIN IN AEROSPACE AND DEFENCE CURRENT AND FUTURE END USER ANALYSIS, 2025–2034, (USD MILLION)
FIGURE 111 MIDDLE EAST AND AFRICA DIGITAL TWIN IN AEROSPACE AND DEFENCE CURRENT AND FUTURE MARKET VOLUME SHARE REGIONAL ANALYSIS, 2025–2034, (USD MILLION)
FIGURE 112 GCC COUNTRIES DIGITAL TWIN IN AEROSPACE AND DEFENCE CURRENT AND FUTURE TYPE ANALYSIS, 2025–2034, (USD MILLION)
FIGURE 113 GCC COUNTRIES DIGITAL TWIN IN AEROSPACE AND DEFENCE CURRENT AND FUTURE END USER ANALYSIS, 2025–2034, (USD MILLION)
FIGURE 114 SAUDI ARABIA DIGITAL TWIN IN AEROSPACE AND DEFENCE CURRENT AND FUTURE TYPE ANALYSIS, 2025–2034, (USD MILLION)
FIGURE 115 SAUDI ARABIA DIGITAL TWIN IN AEROSPACE AND DEFENCE CURRENT AND FUTURE END USER ANALYSIS, 2025–2034, (USD MILLION)
FIGURE 116 UAE DIGITAL TWIN IN AEROSPACE AND DEFENCE CURRENT AND FUTURE TYPE ANALYSIS, 2025–2034, (USD MILLION)
FIGURE 117 UAE DIGITAL TWIN IN AEROSPACE AND DEFENCE CURRENT AND FUTURE END USER ANALYSIS, 2025–2034, (USD MILLION)
FIGURE 118 BAHRAIN DIGITAL TWIN IN AEROSPACE AND DEFENCE CURRENT AND FUTURE TYPE ANALYSIS, 2025–2034, (USD MILLION)
FIGURE 119 BAHRAIN DIGITAL TWIN IN AEROSPACE AND DEFENCE CURRENT AND FUTURE END USER ANALYSIS, 2025–2034, (USD MILLION)
FIGURE 120 KUWAIT DIGITAL TWIN IN AEROSPACE AND DEFENCE CURRENT AND FUTURE TYPE ANALYSIS, 2025–2034, (USD MILLION)
FIGURE 121 KUWAIT DIGITAL TWIN IN AEROSPACE AND DEFENCE CURRENT AND FUTURE END USER ANALYSIS, 2025–2034, (USD MILLION)
FIGURE 122 OMAN DIGITAL TWIN IN AEROSPACE AND DEFENCE CURRENT AND FUTURE TYPE ANALYSIS, 2025–2034, (USD MILLION)
FIGURE 123 OMAN DIGITAL TWIN IN AEROSPACE AND DEFENCE CURRENT AND FUTURE END USER ANALYSIS, 2025–2034, (USD MILLION)
FIGURE 124 QATAR DIGITAL TWIN IN AEROSPACE AND DEFENCE CURRENT AND FUTURE TYPE ANALYSIS, 2025–2034, (USD MILLION)
FIGURE 125 QATAR DIGITAL TWIN IN AEROSPACE AND DEFENCE CURRENT AND FUTURE END USER ANALYSIS, 2025–2034, (USD MILLION)
FIGURE 126 EGYPT DIGITAL TWIN IN AEROSPACE AND DEFENCE CURRENT AND FUTURE TYPE ANALYSIS, 2025–2034, (USD MILLION)
FIGURE 127 EGYPT DIGITAL TWIN IN AEROSPACE AND DEFENCE CURRENT AND FUTURE END USER ANALYSIS, 2025–2034, (USD MILLION)
FIGURE 128 NIGERIA DIGITAL TWIN IN AEROSPACE AND DEFENCE CURRENT AND FUTURE TYPE ANALYSIS, 2025–2034, (USD MILLION)
FIGURE 129 NIGERIA DIGITAL TWIN IN AEROSPACE AND DEFENCE CURRENT AND FUTURE END USER ANALYSIS, 2025–2034, (USD MILLION)
FIGURE 130 SOUTH AFRICA DIGITAL TWIN IN AEROSPACE AND DEFENCE CURRENT AND FUTURE TYPE ANALYSIS, 2025–2034, (USD MILLION)
FIGURE 131 SOUTH AFRICA DIGITAL TWIN IN AEROSPACE AND DEFENCE CURRENT AND FUTURE END USER ANALYSIS, 2025–2034, (USD MILLION)
FIGURE 132 ISRAEL DIGITAL TWIN IN AEROSPACE AND DEFENCE CURRENT AND FUTURE TYPE ANALYSIS, 2025–2034, (USD MILLION)
FIGURE 133 ISRAEL DIGITAL TWIN IN AEROSPACE AND DEFENCE CURRENT AND FUTURE END USER ANALYSIS, 2025–2034, (USD MILLION)
FIGURE 134 REST OF MEA DIGITAL TWIN IN AEROSPACE AND DEFENCE CURRENT AND FUTURE TYPE ANALYSIS, 2025–2034, (USD MILLION)
FIGURE 135 REST OF MEA DIGITAL TWIN IN AEROSPACE AND DEFENCE CURRENT AND FUTURE END USER ANALYSIS, 2025–2034, (USD MILLION)
FIGURE 136 U. S. MARKET SHARE ANALYSIS BY TYPE (2024)
FIGURE 137 U. S. MARKET SHARE ANALYSIS BY END USER (2024)
FIGURE 138 CANADA MARKET SHARE ANALYSIS BY TYPE (2024)
FIGURE 139 CANADA MARKET SHARE ANALYSIS BY END USER (2024)
FIGURE 140 MEXICO MARKET SHARE ANALYSIS BY TYPE (2024)
FIGURE 141 MEXICO MARKET SHARE ANALYSIS BY END USER (2024)
FIGURE 142 CHINA MARKET SHARE ANALYSIS BY TYPE (2024)
FIGURE 143 CHINA MARKET SHARE ANALYSIS BY END USER (2024)
FIGURE 144 JAPAN MARKET SHARE ANALYSIS BY TYPE (2024)
FIGURE 145 JAPAN MARKET SHARE ANALYSIS BY END USER (2024)
FIGURE 146 INDIA MARKET SHARE ANALYSIS BY TYPE (2024)
FIGURE 147 INDIA MARKET SHARE ANALYSIS BY END USER (2024)
FIGURE 148 SOUTH KOREA MARKET SHARE ANALYSIS BY TYPE (2024)
FIGURE 149 SOUTH KOREA MARKET SHARE ANALYSIS BY END USER (2024)
FIGURE 150 SAUDI ARABIA MARKET SHARE ANALYSIS BY TYPE (2024)
FIGURE 151 SAUDI ARABIA MARKET SHARE ANALYSIS BY END USER (2024)
FIGURE 152 UAE MARKET SHARE ANALYSIS BY TYPE (2024)
FIGURE 153 UAE MARKET SHARE ANALYSIS BY END USER (2024)
FIGURE 154 EGYPT MARKET SHARE ANALYSIS BY TYPE (2024)
FIGURE 155 EGYPT MARKET SHARE ANALYSIS BY END USER (2024)
FIGURE 156 NIGERIA MARKET SHARE ANALYSIS BY TYPE (2024)
FIGURE 157 NIGERIA MARKET SHARE ANALYSIS BY END USER (2024)
FIGURE 158 SOUTH AFRICA MARKET SHARE ANALYSIS BY TYPE (2024)
FIGURE 159 SOUTH AFRICA MARKET SHARE ANALYSIS BY END USER (2024)
FIGURE 160 GERMANY MARKET SHARE ANALYSIS BY TYPE (2024)
FIGURE 161 GERMANY MARKET SHARE ANALYSIS BY END USER (2024)
FIGURE 162 FRANCE MARKET SHARE ANALYSIS BY TYPE (2024)
FIGURE 163 FRANCE MARKET SHARE ANALYSIS BY END USER (2024)
FIGURE 164 UK MARKET SHARE ANALYSIS BY TYPE (2024)
FIGURE 165 UK MARKET SHARE ANALYSIS BY END USER (2024)
FIGURE 166 SPAIN MARKET SHARE ANALYSIS BY TYPE (2024)
FIGURE 167 SPAIN MARKET SHARE ANALYSIS BY END USER (2024)
FIGURE 168 ITALY MARKET SHARE ANALYSIS BY TYPE (2024)
FIGURE 169 ITALY MARKET SHARE ANALYSIS BY END USER (2024)
FIGURE 170 BRAZIL MARKET SHARE ANALYSIS BY TYPE (2024)
FIGURE 171 BRAZIL MARKET SHARE ANALYSIS BY END USER (2024)
FIGURE 172 ARGENTINA MARKET SHARE ANALYSIS BY TYPE (2024)
FIGURE 173 ARGENTINA MARKET SHARE ANALYSIS BY END USER (2024)
FIGURE 174 COLUMBIA MARKET SHARE ANALYSIS BY TYPE (2024)
FIGURE 175 COLUMBIA MARKET SHARE ANALYSIS BY END USER (2024)
FIGURE 176 GLOBAL DIGITAL TWIN IN AEROSPACE AND DEFENCE CURRENT AND FUTURE MARKET KEY COUNTRY LEVEL ANALYSIS, 2024–2034, (USD MILLION)
FIGURE 177 FINANCIAL OVERVIEW:
Key Player Analysis
ABB Group: Positioning: Challenger with strong industrial credentials moving into aerospace and defense digital twins. ABB deploys ABB Ability platforms, robotics, and electrification systems that feed asset-level twins for motors, drives, and power distribution within aerospace plants and defense facilities. In 2025, ABB focuses on AI-enabled condition monitoring and edge analytics to support high-availability operations. The company reports double-digit growth in asset performance management subscriptions, driven by retrofit programs across mature facilities.
Strategic moves include expanded interoperability with major PLM and simulation ecosystems and targeted partnerships with aerospace OEMs and tier suppliers for factory digitalization. ABB’s differentiator is its depth in power and motion control, safety-certified robotics, and IEC-compliant data models. This gives you tighter integration from shop-floor sensors to enterprise dashboards. Regional strength in Europe and North America underpins multi-year contracts, with aerospace accounts contributing a rising share of ABB’s industrial software revenues.
Amazon Web Services, Inc.: Positioning: Leader in cloud-native digital twin infrastructure for aerospace and defense. AWS delivers IoT TwinMaker, IoT SiteWise, and Greengrass to build, visualize, and operate twins at scale. In 2025, AWS supports mission workloads through secure regions, data sovereignty controls, and ML services that power predictive maintenance and lifecycle analytics. Aerospace workloads on AWS continue to grow at over 25% year over year, driven by digital thread initiatives and fleet-wide data lakes.
Strategically, AWS expands reference architectures for DO-178C-adjacent workflows, high-fidelity simulation pipelines, and secure collaboration with primes and MRO networks. Differentiators include native integration with analytics, managed AI, and CAD/PLM connectors, plus robust compliance frameworks for defense procurement. You gain faster deployment cycles, lower total cost of ownership, and elastic compute for physics and CFD models without on-premise capacity constraints.
ANSYS, Inc.: Positioning: Leader in multiphysics simulation and high-fidelity digital twins. ANSYS Twin Builder, Fluent, Mechanical, and HFSS anchor model-based development for engines, airframes, avionics cooling, and RF systems. In 2025, ANSYS increases investments in reduced-order modeling and real-time simulation to make twins operationally viable on edge devices. Aerospace license growth in mission-critical applications is estimated in the low teens, supported by long-cycle programs and certification-driven demand.
Strategic initiatives include deeper integrations with major CAD, PLM, and cloud providers to enable physics-informed twins that stay synchronized with live telemetry. Differentiators are verification-grade solvers, domain libraries for aero-thermal and structural loads, and workflows aligned with aerospace certification processes. You get credible performance predictions, faster design iterations, and validated models that reduce physical testing by double-digit percentages.
Autodesk Inc.: Positioning: Challenger in aerospace digital twin workflows with strong design-to-operations reach. Autodesk combines Fusion 360, Inventor, and BIM solutions with Autodesk Tandem to create facility and production-line twins for aerospace campuses. In 2025, Autodesk accelerates cloud-based collaboration and API-driven integrations to bridge engineering data with operations and maintenance records. Adoption rises in greenfield aerospace facilities and retrofit projects seeking unified asset registries.
Strategic moves emphasize partnerships with contractors and system integrators to deliver turnkey BIM-to-twin implementations tied to sustainability reporting and cost control. Differentiators include mature BIM, user-friendly CAD, and cloud-native data services that shorten deployment timelines. For you, Autodesk offers a pragmatic route to operational twins focused on facility performance, utilities, and layout changes, improving throughput and maintenance planning without the complexity of deep physics stacks.
Market Key Players
Siemens AG
Autodesk Inc.
Robert Bosch GmbH
Amazon Web Services, Inc.
Dassault Systèmes
Rockwell Automation
Microsoft Corporation
General Electric
PTC Inc.
SAP SE
ANSYS, Inc.
ABB Group
AVEVA Group plc
Hexagon AB
Bentley Systems Inc.
International Business Machines Corporation
Others
Driver:
Predictive Maintenance as a Strategic Imperative
In 2025, predictive maintenance is still the main reason for adopting digital twins in aerospace and defense. Aircraft, spacecraft, and defense platforms produce large amounts of operational data, and digital twins turn this data into useful insights. By simulating real-time operating conditions, organizations can predict component failures, minimize unexpected downtime, and improve maintenance schedules. This capability is essential as global fleet sizes grow and mission readiness demands increase in both commercial and defense aviation.
Lifecycle Cost Reduction and Asset Reliability
Besides maintenance forecasting, digital twins offer measurable savings in lifecycle costs and improvements in reliability. Maintenance, repair, and overhaul (MRO) costs make up almost 15% of total operating expenses in aerospace and defense programs. Digital twins support condition-based maintenance and virtual stress testing, which lessen the need for expensive physical inspections and extend the life of assets. These advantages make adopting digital twins a critical need for operators wanting better availability, safety, and cost efficiency.
Restraint:
Cybersecurity and Data Sensitivity Risks
Cybersecurity is the biggest challenge to digital twin adoption in aerospace and defense. Digital twins rely on constant data flows from sensors, IoT devices, and connected systems, increasing the risk of cyber threats. In 2025, over 40% of industry leaders cite data security as their main worry, especially given the national security risks of breaches involving defense platforms and military assets.
High Compliance and Deployment Costs
Meeting strict defense-grade cybersecurity and data sovereignty standards adds significant costs and complexity. Secure cloud environments, encryption, access controls, and real-time monitoring can increase deployment budgets by 20% to 25%. For smaller contractors and suppliers, these requirements slow adoption and limit their participation, leading to greater market concentration among large, well-funded aerospace and defense companies.
Opportunity:
AI- and IoT-Driven Simulation Capabilities
Advances in IoT and artificial intelligence are creating new chances for digital twin growth. By 2025, more than 75% of aerospace and defense organizations will integrate high-frequency IoT sensors into their platforms, providing digital twins with real-time operational data. AI and machine learning models improve these twins by simulating system behavior under extreme, mission-critical conditions.
Defense Modernization and Mission Readiness
Digital twins are becoming crucial to defense modernization programs, where reliability in unpredictable environments is vital. AI-enabled digital twins assist with scenario modeling, mission rehearsals, and performance improvement for aircraft, naval vessels, and ground systems. This positions digital twins as a key technology for next-generation defense systems, offering strong long-term growth potential at the intersection of AI, simulation, and national security.
Trend:
Enterprise-Wide Lifecycle Deployment
A major trend in 2025 is moving from pilot projects to full enterprise-wide digital twin deployment. Nearly one-third of aerospace and defense organizations now use digital twins throughout the entire product lifecycle, from design and testing to operations and maintenance. Cloud-based platforms and high-speed connectivity are making real-time management of complex simulation environments at scale possible.
Sustainability and Efficiency Optimization
Sustainability is also becoming an important trend influencing digital twin adoption. Aerospace manufacturers and defense agencies are using digital twins to model fuel efficiency, reduce emissions, and increase asset longevity. As environmental regulations become stricter and efficiency goals rise, digital twins are increasingly seen not only as engineering tools but also as solutions for compliance and cost optimization. This reinforces their status as long-term strategic investments.
Recent Developments
Dec 2024 – MarketsandMarkets: Published a report forecasting the global digital twin market to grow from $21.14 billion in 2025 to $149.81 billion by 2030. This projection underscores the massive investment flowing into virtual replication technologies across the aerospace and defense sectors.
Feb 2025 – U.S. Department of Defense (DoD): Announced a collaboration with the Digital Twin Consortium to create a new standards-based framework for digital twin interoperability across all branches of the armed forces. The initiative aims to break down data silos and accelerate the development of next-generation military systems.
Apr 2025 – Airbus: Revealed a corporate-wide, digital-first strategy centered on implementing digital twins throughout the entire aircraft lifecycle, from design to operations. This move is designed to accelerate product development, improve manufacturing efficiency, and enhance predictive maintenance for its commercial and defense platforms.
May 2025 – Boeing: Advanced its digital twin and predictive analytics capabilities for both commercial and government aviation clients, with a specialized focus on mission readiness for defense operations. The company's updated tools help reduce maintenance events and ensure aircraft availability in unpredictable environments.
Jul 2025 – Siemens: Entered a strategic partnership with a major defense contractor to integrate its digital twin software into the development of a new combat aircraft, a deal valued at over $150 million. This collaboration gives the contractor a comprehensive virtual environment for system testing and validation, significantly shortening development timelines.
Sep 2025 – Ansys: Launched its enhanced simulation suite, which fuses historical data, AI, and real-time physics to improve the prediction accuracy of digital twins to 98%. This technological step forward provides defense organizations with near-certainty in condition-based maintenance and increases the reliability of deployed assets.