Future of Digital Twin Simulation Market $97.2B by 2034 | CAGR 21.5%
Global Digital Twin Market Size, Share, Analysis Report By Type (Product Digital Twin, Process Digital Twin, System Digital Twin), Technology (IoT, Artificial Intelligence, Big Data Analytics, Augmented Reality, Virtual Reality), Application (Predictive Maintenance, Product Design and Development, Performance Monitoring, Fleet Management), Industry Vertical(Manufacturing, Automotive, Aerospace and Defense, Energy and Utilities, Healthcare), Region and Key Players - Industry Segment Overview, Market Dynamics, Competitive Strategies, Trends and Forecast 2025-2034
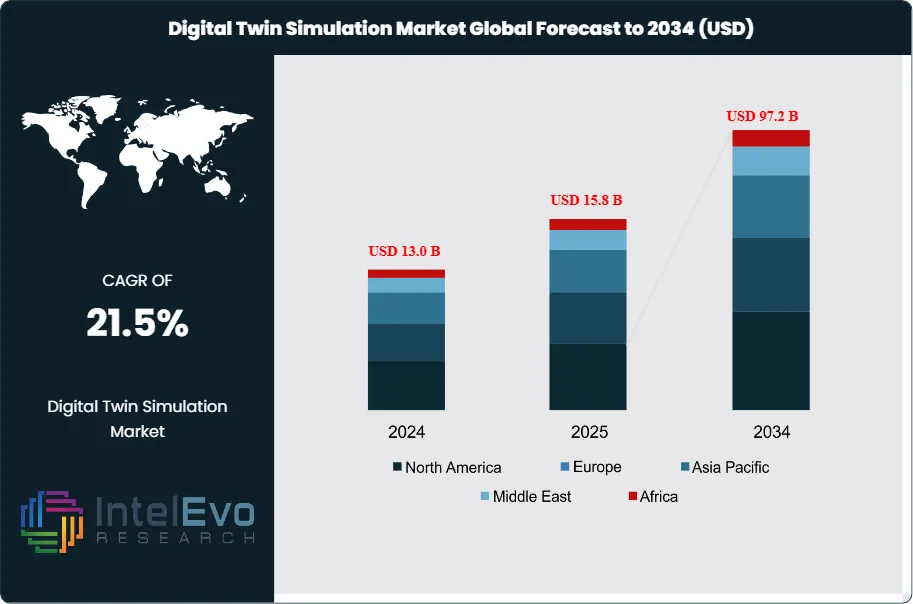
The Digital Twin Simulation Market is projected to reach approximately USD 97.2 Billion by 2034, up from USD 13.0 Billion in 2024, growing at a CAGR of 21.5% during the forecast period from 2024 to 2034. The market outlook reflects strong demand for real-time monitoring and advanced simulation capabilities. With expanding applications across industries, digital twins are set to become a critical enabler of Industry 4.0 transformation.
Digital twin simulation refers to the creation of virtual replicas of physical assets, processes, or systems, enabling real-time monitoring, predictive analytics, and scenario testing. This market encompasses software platforms, integration services, and IoT-enabled devices that collectively allow organizations to optimize operations, reduce downtime, and accelerate innovation. Digital twin simulation is widely adopted across industries such as manufacturing, automotive, energy, healthcare, aerospace, and smart cities, supporting use cases from product design and predictive maintenance to supply chain optimization and urban planning.
The market’s rapid growth is driven by the increasing adoption of Industry 4.0 practices, the proliferation of IoT sensors, and the need for data-driven decision-making. Key growth catalysts include advancements in AI and machine learning, which enhance simulation accuracy and enable autonomous optimization. The integration of cloud computing and edge analytics further accelerates deployment and scalability, while the growing complexity of industrial systems makes digital twins essential for risk mitigation and operational efficiency.
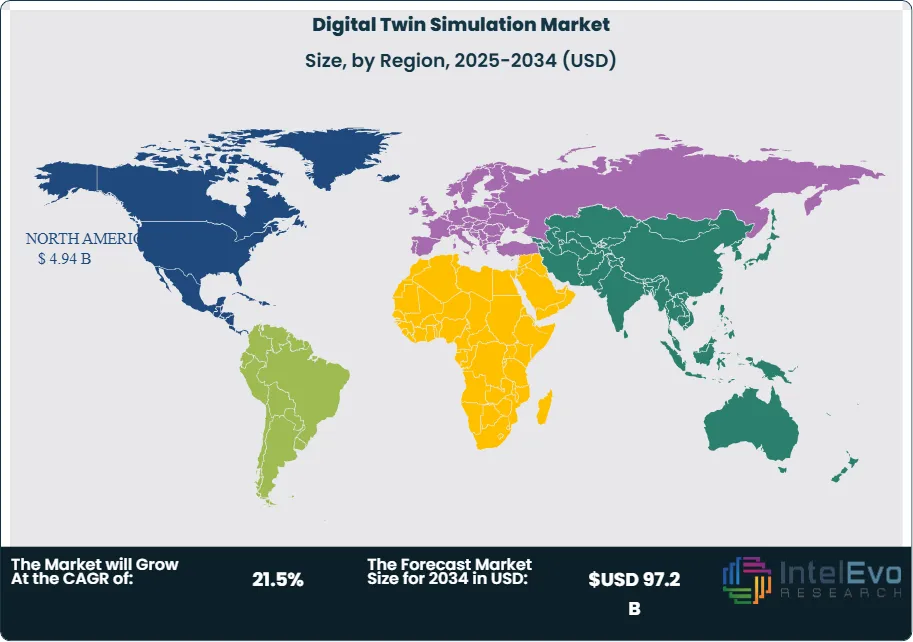
North America leads the global digital twin simulation market, supported by strong investments in R&D, a mature industrial base, and early adoption of advanced technologies. The Asia-Pacific region is the fastest-growing market, fueled by rapid industrialization, smart city initiatives, and government support for digital transformation. Europe maintains a significant presence due to its focus on sustainability, automotive innovation, and regulatory compliance.
The COVID-19 pandemic accelerated digital transformation, highlighting the value of remote monitoring, virtual commissioning, and scenario planning. Organizations increasingly rely on digital twins to ensure business continuity, optimize resource allocation, and enhance resilience against future disruptions.
Rising demand for predictive maintenance, asset optimization, and real-time process control is reshaping market dynamics. The convergence of digital twins with AR/VR, blockchain, and 5G connectivity is unlocking new opportunities for immersive simulation, secure data sharing, and ultra-low-latency applications.
Key Takeaways
Market Growth: The Digital Twin Simulation Market is expected to reach USD 97.2 Billion by 2034, driven by Industry 4.0 adoption, IoT proliferation, and the need for operational efficiency.
Type Dominance: System Digital Twins lead the segment, enabling end-to-end simulation of complex industrial processes and infrastructure.
Application Dominance: Predictive Maintenance and Asset Management are the largest application areas, as organizations seek to minimize downtime and extend asset lifecycles.
Driver: Growth is propelled by the need for real-time monitoring, cost reduction, and accelerated product development cycles.
Restraint: High implementation costs, data integration challenges, and cybersecurity risks hinder widespread adoption.
Opportunity: The market is poised for expansion through AI-driven autonomous twins, integration with AR/VR for immersive simulation, and adoption in emerging sectors like healthcare and smart cities.
Trend: The rise of cloud-native digital twins, edge analytics, and blockchain-enabled data integrity is transforming simulation capabilities and business models.
Regional Analysis: North America leads due to advanced industrial infrastructure, while Asia-Pacific is the fastest-growing region, and Europe maintains a strong focus on sustainability and compliance.
Type Analysis
System Digital Twins represent the leading segment, providing comprehensive simulation of entire production lines, energy grids, or transportation networks. These digital twins enable organizations to model complex interactions, optimize workflows, and test scenarios before implementation. Their dominance is driven by the need for holistic visibility and control in large-scale operations. Component and Process Digital Twins are also significant, focusing on individual assets or specific processes. These are widely used in manufacturing, automotive, and aerospace for design validation, quality assurance, and process optimization.
Application Analysis
Predictive Maintenance and Asset Management Lead With Over 35% Market Share. Predictive maintenance is the largest application, leveraging digital twins to monitor equipment health, predict failures, and schedule maintenance proactively. This reduces unplanned downtime, lowers maintenance costs, and extends asset lifespans. Asset management applications use digital twins for real-time tracking, performance optimization, and lifecycle management. Other key applications include product design and development, supply chain optimization, energy management, and urban planning.
Region Analysis
North America dominates the global digital twin simulation market, supported by a robust industrial sector, high R&D investment, and early adoption of digital transformation initiatives. The region benefits from a strong presence of leading technology providers and a culture of innovation. The Asia-Pacific region is the fastest-growing market, driven by rapid industrialization, government-led smart city projects, and increasing adoption of IoT and AI technologies. China, Japan, and South Korea are key contributors. Europe maintains a significant market share, focusing on sustainability, automotive innovation, and regulatory compliance, particularly in Germany, France, and the UK.
By Type (Product/Component Digital Twin, Process Digital Twin, System Digital Twin), By Technology (IoT & IIoT, Artificial Intelligence (AI) & Machine Learning (ML), Cloud Computing & Big Data Analytics, Augmented Reality (AR) & Virtual Reality (VR)), By End-User Industry (Manufacturing, Healthcare, Automotive & Transportation, Aerospace & Defense, Energy & Utilities, Oil & Gas, Retail & Consumer Goods, Others), By Application (Predictive Maintenance, Business Optimization, Asset Performance Management, Real-Time Monitoring, Simulation & Design, Others)
Research Methodology
Primary Research- 100 Interviews of Stakeholders
Secondary Research
Desk Research
Regional scope
North America (United States, Canada, Mexico)
Latin America (Brazil, Argentina, Columbia)
East Asia And Pacific (China, Japan, South Korea, Australia, Cambodia, Fiji, Indonesia)
Sea And South Asia (India, Singapore, Thailand, Taiwan, Malaysia)
Eastern Europe (Poland, Russia, Czech Republic, Romania)
Western Europe (Germany, U.K., France, Spain, Itlay)
Middle East & Africa (GCC Countries, Egypt, Nigeria, South Africa, Israel)
Competitive Landscape
Siemens AG, General Electric (GE), IBM Corporation, Microsoft Corporation, PTC Inc., SAP SE, Oracle Corporation, Ansys, Inc., Dassault Systèmes, Robert Bosch GmbH, AVEVA Group plc, Bentley Systems, Incorporated, Altair Engineering, Inc., Hexagon AB, Rockwell Automation, Inc., Autodesk, Inc., Emerson Electric Co., Schneider Electric SE, Huawei Technologies Co., Ltd., ABB Ltd.
Customization Scope
Customization for segments, region/country-level will be provided. Moreover, additional customization can be done based on the requirements.
Pricing and Purchase Options
Avail customized purchase options to meet your exact research needs. We have three licenses to opt for: Single User License, Multi-User License (Up to 5 Users), Corporate Use License (Unlimited User and Printable PDF).
TABLE OF CONTENTS
1. EXECUTIVE SUMMARY
1.1. MARKET SNAPSHOT
1.2. KEY FINDINGS & INSIGHTS
1.3. ANALYST RECOMMENDATIONS
1.4. FUTURE OUTLOOK
2. RESEARCH METHODOLOGY
2.1. MARKET DEFINITION & SCOPE
2.2. RESEARCH OBJECTIVES: PRIMARY & SECONDARY DATA SOURCES
2.3. DATA COLLECTION SOURCES
2.3.1. COVERAGE OF 100+ PRIMARY RESEARCH/CONSULTATION CALLS WITH INDUSTRY STAKEHOLDERS
FIGURE 17 NORTH AMERICA DIGITAL TWIN CURRENT AND FUTURE TYPE ANALYSIS, 2025–2034, (USD MILLION)
FIGURE 18 NORTH AMERICA DIGITAL TWIN CURRENT AND FUTURE END USER ANALYSIS, 2025–2034, (USD MILLION)
FIGURE 19 MARKET SHARE BY COUNTRY
FIGURE 20 LATIN AMERICA DIGITAL TWIN CURRENT AND FUTURE TYPE ANALYSIS, 2025–2034, (USD MILLION)
FIGURE 21 LATIN AMERICA DIGITAL TWIN CURRENT AND FUTURE END USER ANALYSIS, 2025–2034, (USD MILLION)
FIGURE 22 MARKET SHARE BY COUNTRY
FIGURE 23 EASTERN EUROPE DIGITAL TWIN CURRENT AND FUTURE TYPE ANALYSIS, 2025–2034, (USD MILLION)
FIGURE 24 EASTERN EUROPE DIGITAL TWIN CURRENT AND FUTURE END USER ANALYSIS, 2025–2034, (USD MILLION)
FIGURE 25 MARKET SHARE BY COUNTRY
FIGURE 26 WESTERN EUROPE DIGITAL TWIN CURRENT AND FUTURE TYPE ANALYSIS, 2025–2034, (USD MILLION)
FIGURE 27 WESTERN EUROPE DIGITAL TWIN CURRENT AND FUTURE END USER ANALYSIS, 2025–2034, (USD MILLION)
FIGURE 28 MARKET SHARE BY COUNTRY
FIGURE 29 EAST ASIA AND PACIFIC DIGITAL TWIN CURRENT AND FUTURE TYPE ANALYSIS, 2025–2034, (USD MILLION)
FIGURE 30 EAST ASIA AND PACIFIC DIGITAL TWIN CURRENT AND FUTURE END USER ANALYSIS, 2025–2034, (USD MILLION)
FIGURE 31 MARKET SHARE BY COUNTRY
FIGURE 32 SEA AND SOUTH ASIA DIGITAL TWIN CURRENT AND FUTURE TYPE ANALYSIS, 2025–2034, (USD MILLION)
FIGURE 33 SEA AND SOUTH ASIA DIGITAL TWIN CURRENT AND FUTURE END USER ANALYSIS, 2025–2034, (USD MILLION)
FIGURE 34 MARKET SHARE BY COUNTRY
FIGURE 35 MIDDLE EAST AND AFRICA DIGITAL TWIN CURRENT AND FUTURE TYPE ANALYSIS, 2025–2034, (USD MILLION)
FIGURE 36 MIDDLE EAST AND AFRICA DIGITAL TWIN CURRENT AND FUTURE END USER ANALYSIS, 2025–2034, (USD MILLION)
FIGURE 37 NORTH AMERICA DIGITAL TWIN CURRENT AND FUTURE MARKET VOLUME SHARE REGIONAL ANALYSIS, 2025–2034, (USD MILLION)
FIGURE 38 U.S. DIGITAL TWIN CURRENT AND FUTURE TYPE ANALYSIS, 2025–2034, (USD MILLION)
FIGURE 39 U.S. DIGITAL TWIN CURRENT AND FUTURE END USER ANALYSIS, 2025–2034, (USD MILLION)
FIGURE 40 CANADA DIGITAL TWIN CURRENT AND FUTURE TYPE ANALYSIS, 2025–2034, (USD MILLION)
FIGURE 41 CANADA DIGITAL TWIN CURRENT AND FUTURE END USER ANALYSIS, 2025–2034, (USD MILLION)
FIGURE 42 LATIN AMERICA DIGITAL TWIN CURRENT AND FUTURE MARKET VOLUME SHARE REGIONAL ANALYSIS, 2025–2034, (USD MILLION)
FIGURE 43 MEXICO DIGITAL TWIN CURRENT AND FUTURE TYPE ANALYSIS, 2025–2034, (USD MILLION)
FIGURE 44 MEXICO DIGITAL TWIN CURRENT AND FUTURE END USER ANALYSIS, 2025–2034, (USD MILLION)
FIGURE 45 BRAZIL DIGITAL TWIN CURRENT AND FUTURE TYPE ANALYSIS, 2025–2034, (USD MILLION)
FIGURE 46 BRAZIL DIGITAL TWIN CURRENT AND FUTURE END USER ANALYSIS, 2025–2034, (USD MILLION)
FIGURE 47 ARGENTINA DIGITAL TWIN CURRENT AND FUTURE TYPE ANALYSIS, 2025–2034, (USD MILLION)
FIGURE 48 ARGENTINA DIGITAL TWIN CURRENT AND FUTURE END USER ANALYSIS, 2025–2034, (USD MILLION)
FIGURE 49 COLUMBIA DIGITAL TWIN CURRENT AND FUTURE TYPE ANALYSIS, 2025–2034, (USD MILLION)
FIGURE 50 COLUMBIA DIGITAL TWIN CURRENT AND FUTURE END USER ANALYSIS, 2025–2034, (USD MILLION)
FIGURE 51 REST OF LATIN AMERICA DIGITAL TWIN CURRENT AND FUTURE TYPE ANALYSIS, 2025–2034, (USD MILLION)
FIGURE 52 REST OF LATIN AMERICA DIGITAL TWIN CURRENT AND FUTURE END USER ANALYSIS, 2025–2034, (USD MILLION)
FIGURE 53 EASTERN EUROPE DIGITAL TWIN CURRENT AND FUTURE MARKET VOLUME SHARE REGIONAL ANALYSIS, 2025–2034, (USD MILLION)
FIGURE 54 POLAND DIGITAL TWIN CURRENT AND FUTURE TYPE ANALYSIS, 2025–2034, (USD MILLION)
FIGURE 55 POLAND DIGITAL TWIN CURRENT AND FUTURE END USER ANALYSIS, 2025–2034, (USD MILLION)
FIGURE 56 RUSSIA DIGITAL TWIN CURRENT AND FUTURE TYPE ANALYSIS, 2025–2034, (USD MILLION)
FIGURE 57 RUSSIA DIGITAL TWIN CURRENT AND FUTURE END USER ANALYSIS, 2025–2034, (USD MILLION)
FIGURE 58 CZECH REPUBLIC DIGITAL TWIN CURRENT AND FUTURE TYPE ANALYSIS, 2025–2034, (USD MILLION)
FIGURE 59 CZECH REPUBLIC DIGITAL TWIN CURRENT AND FUTURE END USER ANALYSIS, 2025–2034, (USD MILLION)
FIGURE 60 ROMANIA DIGITAL TWIN CURRENT AND FUTURE TYPE ANALYSIS, 2025–2034, (USD MILLION)
FIGURE 61 ROMANIA DIGITAL TWIN CURRENT AND FUTURE END USER ANALYSIS, 2025–2034, (USD MILLION)
FIGURE 62 REST OF EASTERN EUROPE DIGITAL TWIN CURRENT AND FUTURE TYPE ANALYSIS, 2025–2034, (USD MILLION)
FIGURE 63 REST OF EASTERN EUROPE DIGITAL TWIN CURRENT AND FUTURE END USER ANALYSIS, 2025–2034, (USD MILLION)
FIGURE 64 WESTERN EUROPE DIGITAL TWIN CURRENT AND FUTURE MARKET VOLUME SHARE REGIONAL ANALYSIS, 2025–2034, (USD MILLION)
FIGURE 65 GERMANY DIGITAL TWIN CURRENT AND FUTURE TYPE ANALYSIS, 2025–2034, (USD MILLION)
FIGURE 66 GERMANY DIGITAL TWIN CURRENT AND FUTURE END USER ANALYSIS, 2025–2034, (USD MILLION)
FIGURE 67 FRANCE DIGITAL TWIN CURRENT AND FUTURE TYPE ANALYSIS, 2025–2034, (USD MILLION)
FIGURE 68 FRANCE DIGITAL TWIN CURRENT AND FUTURE END USER ANALYSIS, 2025–2034, (USD MILLION)
FIGURE 69 UK DIGITAL TWIN CURRENT AND FUTURE TYPE ANALYSIS, 2025–2034, (USD MILLION)
FIGURE 70 UK DIGITAL TWIN CURRENT AND FUTURE END USER ANALYSIS, 2025–2034, (USD MILLION)
FIGURE 71 SPAIN DIGITAL TWIN CURRENT AND FUTURE TYPE ANALYSIS, 2025–2034, (USD MILLION)
FIGURE 72 SPAIN DIGITAL TWIN CURRENT AND FUTURE END USER ANALYSIS, 2025–2034, (USD MILLION)
FIGURE 73 ITALY DIGITAL TWIN CURRENT AND FUTURE TYPE ANALYSIS, 2025–2034, (USD MILLION)
FIGURE 74 ITALY DIGITAL TWIN CURRENT AND FUTURE END USER ANALYSIS, 2025–2034, (USD MILLION)
FIGURE 75 REST OF WESTERN EUROPE DIGITAL TWIN CURRENT AND FUTURE TYPE ANALYSIS, 2025–2034, (USD MILLION)
FIGURE 76 REST OF WESTERN EUROPE DIGITAL TWIN CURRENT AND FUTURE END USER ANALYSIS, 2025–2034, (USD MILLION)
FIGURE 77 EAST ASIA AND PACIFIC DIGITAL TWIN CURRENT AND FUTURE MARKET VOLUME SHARE REGIONAL ANALYSIS, 2025–2034, (USD MILLION)
FIGURE 78 CHINA DIGITAL TWIN CURRENT AND FUTURE TYPE ANALYSIS, 2025–2034, (USD MILLION)
FIGURE 79 CHINA DIGITAL TWIN CURRENT AND FUTURE END USER ANALYSIS, 2025–2034, (USD MILLION)
FIGURE 80 JAPAN DIGITAL TWIN CURRENT AND FUTURE TYPE ANALYSIS, 2025–2034, (USD MILLION)
FIGURE 81 JAPAN DIGITAL TWIN CURRENT AND FUTURE END USER ANALYSIS, 2025–2034, (USD MILLION)
FIGURE 82 AUSTRALIA DIGITAL TWIN CURRENT AND FUTURE TYPE ANALYSIS, 2025–2034, (USD MILLION)
FIGURE 83 AUSTRALIA DIGITAL TWIN CURRENT AND FUTURE END USER ANALYSIS, 2025–2034, (USD MILLION)
FIGURE 84 CAMBODIA DIGITAL TWIN CURRENT AND FUTURE TYPE ANALYSIS, 2025–2034, (USD MILLION)
FIGURE 85 CAMBODIA DIGITAL TWIN CURRENT AND FUTURE END USER ANALYSIS, 2025–2034, (USD MILLION)
FIGURE 86 FIJI DIGITAL TWIN CURRENT AND FUTURE TYPE ANALYSIS, 2025–2034, (USD MILLION)
FIGURE 87 FIJI DIGITAL TWIN CURRENT AND FUTURE END USER ANALYSIS, 2025–2034, (USD MILLION)
FIGURE 88 INDONESIA DIGITAL TWIN CURRENT AND FUTURE TYPE ANALYSIS, 2025–2034, (USD MILLION)
FIGURE 89 INDONESIA DIGITAL TWIN CURRENT AND FUTURE END USER ANALYSIS, 2025–2034, (USD MILLION)
FIGURE 90 SOUTH KOREA DIGITAL TWIN CURRENT AND FUTURE TYPE ANALYSIS, 2025–2034, (USD MILLION)
FIGURE 91 SOUTH KOREA DIGITAL TWIN CURRENT AND FUTURE END USER ANALYSIS, 2025–2034, (USD MILLION)
FIGURE 92 REST OF EAST ASIA AND PACIFIC DIGITAL TWIN CURRENT AND FUTURE TYPE ANALYSIS, 2025–2034, (USD MILLION)
FIGURE 93 REST OF EAST ASIA AND PACIFIC DIGITAL TWIN CURRENT AND FUTURE END USER ANALYSIS, 2025–2034, (USD MILLION)
FIGURE 94 SEA AND SOUTH ASIA DIGITAL TWIN CURRENT AND FUTURE MARKET VOLUME SHARE REGIONAL ANALYSIS, 2025–2034, (USD MILLION)
FIGURE 95 BANGLADESH DIGITAL TWIN CURRENT AND FUTURE TYPE ANALYSIS, 2025–2034, (USD MILLION)
FIGURE 96 BANGLADESH DIGITAL TWIN CURRENT AND FUTURE END USER ANALYSIS, 2025–2034, (USD MILLION)
FIGURE 97 NEW ZEALAND DIGITAL TWIN CURRENT AND FUTURE TYPE ANALYSIS, 2025–2034, (USD MILLION)
FIGURE 98 NEW ZEALAND DIGITAL TWIN CURRENT AND FUTURE END USER ANALYSIS, 2025–2034, (USD MILLION)
FIGURE 99 INDIA DIGITAL TWIN CURRENT AND FUTURE TYPE ANALYSIS, 2025–2034, (USD MILLION)
FIGURE 100 INDIA DIGITAL TWIN CURRENT AND FUTURE END USER ANALYSIS, 2025–2034, (USD MILLION)
FIGURE 101 SINGAPORE DIGITAL TWIN CURRENT AND FUTURE TYPE ANALYSIS, 2025–2034, (USD MILLION)
FIGURE 102 SINGAPORE DIGITAL TWIN CURRENT AND FUTURE END USER ANALYSIS, 2025–2034, (USD MILLION)
FIGURE 103 THAILAND DIGITAL TWIN CURRENT AND FUTURE TYPE ANALYSIS, 2025–2034, (USD MILLION)
FIGURE 104 THAILAND DIGITAL TWIN CURRENT AND FUTURE END USER ANALYSIS, 2025–2034, (USD MILLION)
FIGURE 105 TAIWAN DIGITAL TWIN CURRENT AND FUTURE TYPE ANALYSIS, 2025–2034, (USD MILLION)
FIGURE 106 TAIWAN DIGITAL TWIN CURRENT AND FUTURE END USER ANALYSIS, 2025–2034, (USD MILLION)
FIGURE 107 MALAYSIA DIGITAL TWIN CURRENT AND FUTURE TYPE ANALYSIS, 2025–2034, (USD MILLION)
FIGURE 108 MALAYSIA DIGITAL TWIN CURRENT AND FUTURE END USER ANALYSIS, 2025–2034, (USD MILLION)
FIGURE 109 REST OF SEA AND SOUTH ASIA DIGITAL TWIN CURRENT AND FUTURE TYPE ANALYSIS, 2025–2034, (USD MILLION)
FIGURE 110 REST OF SEA AND SOUTH ASIA DIGITAL TWIN CURRENT AND FUTURE END USER ANALYSIS, 2025–2034, (USD MILLION)
FIGURE 111 MIDDLE EAST AND AFRICA DIGITAL TWIN CURRENT AND FUTURE MARKET VOLUME SHARE REGIONAL ANALYSIS, 2025–2034, (USD MILLION)
FIGURE 112 GCC COUNTRIES DIGITAL TWIN CURRENT AND FUTURE TYPE ANALYSIS, 2025–2034, (USD MILLION)
FIGURE 113 GCC COUNTRIES DIGITAL TWIN CURRENT AND FUTURE END USER ANALYSIS, 2025–2034, (USD MILLION)
FIGURE 114 SAUDI ARABIA DIGITAL TWIN CURRENT AND FUTURE TYPE ANALYSIS, 2025–2034, (USD MILLION)
FIGURE 115 SAUDI ARABIA DIGITAL TWIN CURRENT AND FUTURE END USER ANALYSIS, 2025–2034, (USD MILLION)
FIGURE 116 UAE DIGITAL TWIN CURRENT AND FUTURE TYPE ANALYSIS, 2025–2034, (USD MILLION)
FIGURE 117 UAE DIGITAL TWIN CURRENT AND FUTURE END USER ANALYSIS, 2025–2034, (USD MILLION)
FIGURE 118 BAHRAIN DIGITAL TWIN CURRENT AND FUTURE TYPE ANALYSIS, 2025–2034, (USD MILLION)
FIGURE 119 BAHRAIN DIGITAL TWIN CURRENT AND FUTURE END USER ANALYSIS, 2025–2034, (USD MILLION)
FIGURE 120 KUWAIT DIGITAL TWIN CURRENT AND FUTURE TYPE ANALYSIS, 2025–2034, (USD MILLION)
FIGURE 121 KUWAIT DIGITAL TWIN CURRENT AND FUTURE END USER ANALYSIS, 2025–2034, (USD MILLION)
FIGURE 122 OMAN DIGITAL TWIN CURRENT AND FUTURE TYPE ANALYSIS, 2025–2034, (USD MILLION)
FIGURE 123 OMAN DIGITAL TWIN CURRENT AND FUTURE END USER ANALYSIS, 2025–2034, (USD MILLION)
FIGURE 124 QATAR DIGITAL TWIN CURRENT AND FUTURE TYPE ANALYSIS, 2025–2034, (USD MILLION)
FIGURE 125 QATAR DIGITAL TWIN CURRENT AND FUTURE END USER ANALYSIS, 2025–2034, (USD MILLION)
FIGURE 126 EGYPT DIGITAL TWIN CURRENT AND FUTURE TYPE ANALYSIS, 2025–2034, (USD MILLION)
FIGURE 127 EGYPT DIGITAL TWIN CURRENT AND FUTURE END USER ANALYSIS, 2025–2034, (USD MILLION)
FIGURE 128 NIGERIA DIGITAL TWIN CURRENT AND FUTURE TYPE ANALYSIS, 2025–2034, (USD MILLION)
FIGURE 129 NIGERIA DIGITAL TWIN CURRENT AND FUTURE END USER ANALYSIS, 2025–2034, (USD MILLION)
FIGURE 130 SOUTH AFRICA DIGITAL TWIN CURRENT AND FUTURE TYPE ANALYSIS, 2025–2034, (USD MILLION)
FIGURE 131 SOUTH AFRICA DIGITAL TWIN CURRENT AND FUTURE END USER ANALYSIS, 2025–2034, (USD MILLION)
FIGURE 132 ISRAEL DIGITAL TWIN CURRENT AND FUTURE TYPE ANALYSIS, 2025–2034, (USD MILLION)
FIGURE 133 ISRAEL DIGITAL TWIN CURRENT AND FUTURE END USER ANALYSIS, 2025–2034, (USD MILLION)
FIGURE 134 REST OF MEA DIGITAL TWIN CURRENT AND FUTURE TYPE ANALYSIS, 2025–2034, (USD MILLION)
FIGURE 135 REST OF MEA DIGITAL TWIN CURRENT AND FUTURE END USER ANALYSIS, 2025–2034, (USD MILLION)
FIGURE 136 U. S. MARKET SHARE ANALYSIS BY TYPE (2024)
FIGURE 137 U. S. MARKET SHARE ANALYSIS BY END USER (2024)
FIGURE 138 CANADA MARKET SHARE ANALYSIS BY TYPE (2024)
FIGURE 139 CANADA MARKET SHARE ANALYSIS BY END USER (2024)
FIGURE 140 MEXICO MARKET SHARE ANALYSIS BY TYPE (2024)
FIGURE 141 MEXICO MARKET SHARE ANALYSIS BY END USER (2024)
FIGURE 142 CHINA MARKET SHARE ANALYSIS BY TYPE (2024)
FIGURE 143 CHINA MARKET SHARE ANALYSIS BY END USER (2024)
FIGURE 144 JAPAN MARKET SHARE ANALYSIS BY TYPE (2024)
FIGURE 145 JAPAN MARKET SHARE ANALYSIS BY END USER (2024)
FIGURE 146 INDIA MARKET SHARE ANALYSIS BY TYPE (2024)
FIGURE 147 INDIA MARKET SHARE ANALYSIS BY END USER (2024)
FIGURE 148 SOUTH KOREA MARKET SHARE ANALYSIS BY TYPE (2024)
FIGURE 149 SOUTH KOREA MARKET SHARE ANALYSIS BY END USER (2024)
FIGURE 150 SAUDI ARABIA MARKET SHARE ANALYSIS BY TYPE (2024)
FIGURE 151 SAUDI ARABIA MARKET SHARE ANALYSIS BY END USER (2024)
FIGURE 152 UAE MARKET SHARE ANALYSIS BY TYPE (2024)
FIGURE 153 UAE MARKET SHARE ANALYSIS BY END USER (2024)
FIGURE 154 EGYPT MARKET SHARE ANALYSIS BY TYPE (2024)
FIGURE 155 EGYPT MARKET SHARE ANALYSIS BY END USER (2024)
FIGURE 156 NIGERIA MARKET SHARE ANALYSIS BY TYPE (2024)
FIGURE 157 NIGERIA MARKET SHARE ANALYSIS BY END USER (2024)
FIGURE 158 SOUTH AFRICA MARKET SHARE ANALYSIS BY TYPE (2024)
FIGURE 159 SOUTH AFRICA MARKET SHARE ANALYSIS BY END USER (2024)
FIGURE 160 GERMANY MARKET SHARE ANALYSIS BY TYPE (2024)
FIGURE 161 GERMANY MARKET SHARE ANALYSIS BY END USER (2024)
FIGURE 162 FRANCE MARKET SHARE ANALYSIS BY TYPE (2024)
FIGURE 163 FRANCE MARKET SHARE ANALYSIS BY END USER (2024)
FIGURE 164 UK MARKET SHARE ANALYSIS BY TYPE (2024)
FIGURE 165 UK MARKET SHARE ANALYSIS BY END USER (2024)
FIGURE 166 SPAIN MARKET SHARE ANALYSIS BY TYPE (2024)
FIGURE 167 SPAIN MARKET SHARE ANALYSIS BY END USER (2024)
FIGURE 168 ITALY MARKET SHARE ANALYSIS BY TYPE (2024)
FIGURE 169 ITALY MARKET SHARE ANALYSIS BY END USER (2024)
FIGURE 170 BRAZIL MARKET SHARE ANALYSIS BY TYPE (2024)
FIGURE 171 BRAZIL MARKET SHARE ANALYSIS BY END USER (2024)
FIGURE 172 ARGENTINA MARKET SHARE ANALYSIS BY TYPE (2024)
FIGURE 173 ARGENTINA MARKET SHARE ANALYSIS BY END USER (2024)
FIGURE 174 COLUMBIA MARKET SHARE ANALYSIS BY TYPE (2024)
FIGURE 175 COLUMBIA MARKET SHARE ANALYSIS BY END USER (2024)
FIGURE 176 GLOBAL DIGITAL TWIN CURRENT AND FUTURE MARKET KEY COUNTRY LEVEL ANALYSIS, 2024–2034, (USD MILLION)
FIGURE 177 FINANCIAL OVERVIEW:
Key Players Analysis
Siemens AG: A global leader in digital twin solutions, offering comprehensive platforms for manufacturing, energy, and infrastructure.
General Electric (GE) Digital: Specializes in industrial digital twins for asset performance management and predictive analytics.
IBM Corporation: Provides AI-driven digital twin platforms for diverse industries, focusing on integration and scalability.
Microsoft Corporation: Offers Azure-based digital twin services, enabling cloud-native simulation and IoT integration.
PTC Inc.: Known for its ThingWorx platform, supporting industrial digital twins and AR/VR integration.
Dassault Systèmes: Delivers advanced simulation and product lifecycle management solutions for automotive, aerospace, and healthcare.
Ansys Inc.: Focuses on engineering simulation and digital twin modeling for product design and optimization.
Key Players
Siemens AG
General Electric (GE)
IBM Corporation
Microsoft Corporation
PTC Inc.
SAP SE
Oracle Corporation
Ansys, Inc.
Dassault Systèmes
Robert Bosch GmbH
AVEVA Group plc
Bentley Systems, Incorporated
Altair Engineering, Inc.
Hexagon AB
Rockwell Automation, Inc.
Autodesk, Inc.
Emerson Electric Co.
Schneider Electric SE
Huawei Technologies Co., Ltd.
ABB Ltd.
Drivers:
Rising Adoption in Manufacturing and Industrial Sectors
Digital twin simulation is transforming the manufacturing and industrial landscape by enabling companies to create detailed virtual models of their physical assets, such as machines, production lines, or entire factories. These digital replicas allow organizations to simulate various operational scenarios—like changes in production schedules, equipment malfunctions, or process optimizations—without disrupting actual operations. By analyzing the outcomes of these simulations, companies can identify bottlenecks, optimize workflows, and implement preventive maintenance strategies. This proactive approach helps reduce unplanned downtime, extend equipment lifespan, and improve overall productivity. As a result, manufacturers can achieve significant cost savings, enhance product quality, and respond more quickly to market demands, making digital twin technology an increasingly valuable tool in the industrial sector.
Growth of IoT and Connected Devices
The rapid expansion of IoT (Internet of Things) technology is a key enabler for digital twin simulation. IoT devices, such as sensors and smart controllers, continuously collect real-time data from physical assets—monitoring parameters like temperature, pressure, vibration, and usage patterns. This data is fed into digital twin models, ensuring that the virtual representation accurately reflects the current state of the physical asset. With this real-time feedback loop, digital twins can provide actionable insights for asset management, predictive maintenance, and operational optimization. For example, if a sensor detects abnormal vibrations in a machine, the digital twin can simulate potential causes and recommend corrective actions before a breakdown occurs. As more industries embrace IoT and connected devices, the demand for digital twin solutions grows, empowering organizations to make data-driven decisions and maintain a competitive edge.
Restraints:
High Implementation Costs
Implementing digital twin simulation technology involves substantial upfront investments that can be challenging for many organizations, especially small and medium-sized enterprises (SMEs). The costs include purchasing advanced simulation software, acquiring or upgrading hardware such as servers and sensors, and hiring or training skilled personnel who can develop, manage, and interpret digital twin models. Additionally, integrating digital twin solutions with existing IT infrastructure and operational systems can require significant customization and ongoing maintenance.
Data Security and Privacy Concerns
Digital twin technology depends on the continuous flow of data between physical assets and their digital counterparts, often across networks and cloud platforms. This constant data exchange introduces vulnerabilities that can be exploited by cybercriminals, leading to risks such as data breaches, unauthorized access, and cyberattacks. Sensitive operational data, intellectual property, and even personal information may be exposed if robust security measures are not in place. Furthermore, as digital twins are increasingly used in critical infrastructure and industrial environments, the potential impact of a security breach becomes even more severe. Organizations must also navigate complex privacy regulations and ensure compliance with data protection laws, which can add to the complexity and cost of implementation.
Opportunities
Expansion in Healthcare and Smart Cities
Digital twin technology is rapidly expanding beyond its industrial roots and finding transformative applications in sectors like healthcare and smart cities. In healthcare, digital twins can be used to create highly detailed, patient-specific models that simulate organs, diseases, or even entire physiological systems. These virtual replicas allow doctors to test different treatment strategies, predict patient responses, and personalize therapies with greater precision, ultimately improving patient outcomes and reducing risks. For example, a digital twin of a patient’s heart can help cardiologists plan complex surgeries or monitor the effectiveness of ongoing treatments in real time.
Integration with AI and Machine Learning
The integration of digital twins with artificial intelligence (AI) and machine learning (ML) is unlocking new levels of simulation accuracy and operational intelligence. AI and ML algorithms can analyze the vast amounts of data generated by digital twins, learning from patterns and historical outcomes to make more accurate predictions and recommendations. For instance, in manufacturing, AI-enhanced digital twins can detect subtle anomalies in equipment behavior, predict failures before they occur, and automatically suggest optimal maintenance schedules, reducing downtime and costs.
Trends
Cloud-Based Digital Twin Platforms
The adoption of cloud-based platforms is revolutionizing how organizations implement and scale digital twin technology. Traditionally, deploying digital twins required significant investment in on-premises hardware, specialized IT infrastructure, and dedicated maintenance. With the shift to cloud-based solutions, these barriers are greatly reduced. Cloud platforms provide the flexibility to create, manage, and update digital twins remotely, making it easier for organizations of all sizes to access advanced simulation capabilities without the need for heavy upfront investments. Additionally, cloud-based digital twins can be seamlessly integrated with other enterprise systems and IoT devices, enabling real-time data exchange and analytics. This approach also supports remote monitoring and collaboration, allowing teams across different locations to work together on the same digital models, share insights, and make faster, data-driven decisions.
Focus on Sustainability and Energy Efficiency
Sustainability and energy efficiency have become top priorities for organizations worldwide, and digital twin simulations are playing a crucial role in supporting these goals. By creating virtual models of buildings, factories, or entire cities, companies can analyze and optimize energy consumption, identify sources of waste, and test the impact of different sustainability initiatives before implementing them in the real world. For example, in the energy and utilities sector, digital twins can simulate grid performance, forecast demand, and optimize the integration of renewable energy sources. In construction, they can help design greener buildings by modeling airflow, lighting, and material usage to minimize environmental impact. These capabilities not only help organizations reduce costs and comply with environmental regulations but also demonstrate their commitment to corporate social responsibility.
Recent Developments
June 2025: Siemens AG launched a next-generation cloud-native digital twin platform, integrating AI-driven analytics and edge computing for real-time industrial simulation.
April 2025: IBM announced a partnership with a leading healthcare provider to deploy digital twins for hospital operations, optimizing patient flow and resource allocation.
February 2025: Microsoft expanded its Azure Digital Twins platform with new features for smart city simulation, supporting urban planning and infrastructure management.