Dimethyl Terephthalate (DMT) Market to Hit $3.3B by 2034 | 7.3% CAGR
Global Dimethyl Terephthalate Market Size, Share & Analysis By Form (Solid, Liquid), By Application (Polyester Fibers, PET Resins, Films), By End-Use Industry (Packaging, Textiles), Industry Regions & Key Players – Capacity Expansion & Forecast 2025–2034
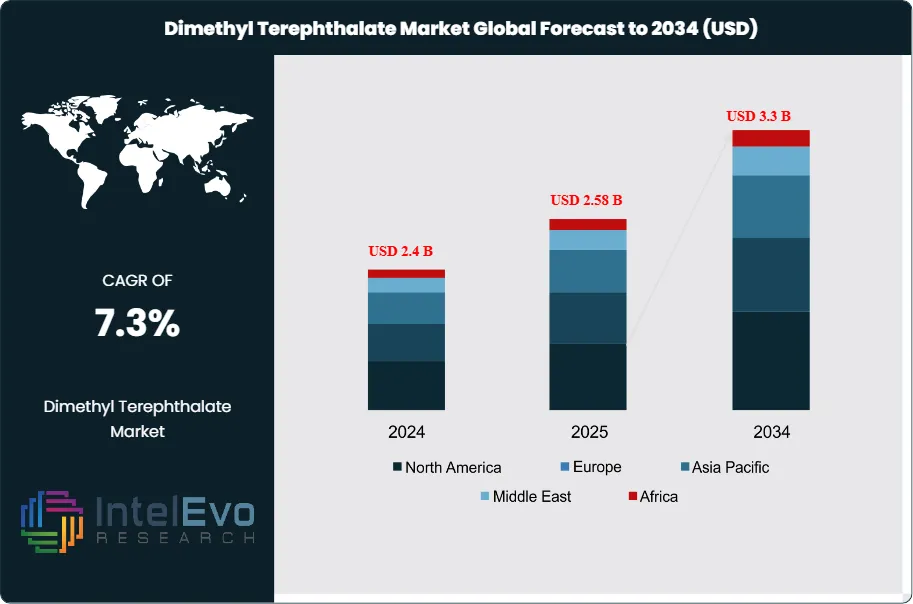
The Dimethyl Terephthalate (DMT) market is estimated at USD 2.4 billion in 2024 and is on track to reach roughly USD 3.3 billion by 2034, implying a compound annual growth rate of 7.3% over 2025–2034. Growing demand for high-performance polymers, PET resins, and polyester fibers continues to push DMT consumption across packaging, automotive, and textile applications. The shift toward lightweight materials and sustainable packaging solutions is further strengthening long-term market traction. As global manufacturing scales and recycling technologies mature, DMT is expected to play a pivotal role in next-generation material innovation.
DMT remains an essential intermediate in polyester production, particularly for polyethylene terephthalate (PET), polybutylene terephthalate (PBT), and polytrimethylene terephthalate (PTT). Demand has steadily expanded as manufacturers seek stable, high-yield feedstocks for large-scale polyester output. Volumes have grown in parallel with increased PET usage in beverage packaging and textile fiber manufacturing. In 2024, PET accounted for over 60% of total DMT consumption globally. Asia Pacific continues to lead demand, with China and India expanding domestic polyester capacity to support export-driven textile sectors. Southeast Asia has seen a 9% year-on-year rise in PET resin imports, reinforcing regional reliance on DMT-based production chains. Europe and North America remain stable demand centers, supported by investments in PET bottle recycling and closed-loop polymer systems.
DMT’s role in circular material flows is also expanding. As of 2025, chemical recycling facilities using DMT as a recovery intermediate have scaled operations in Germany, Japan, and South Korea. These processes convert post-consumer PET waste into reusable feedstocks, with DMT acting as a bridge between plastic recovery and virgin-equivalent production. In this application, DMT helps reduce reliance on fossil-derived inputs, addressing regulatory and investor pressure on carbon intensity and waste mitigation. Production technology is also evolving. Plants utilizing liquid-phase oxidation methods have improved yield efficiency by 7–9% over the last three years, lowering unit production costs. However, risks remain. DMT in powdered form poses an ignition hazard, and handling standards remain inconsistent in emerging manufacturing zones. Additionally, price volatility in paraxylene—the core input for DMT—continues to affect cost structures.
On the demand side, polyester films produced using DMT have gained traction in medical imaging, electronics, and industrial coatings. In 2025, specialty polyester films are expected to generate over USD 280 million in DMT-related consumption, driven by rising procurement from diagnostic equipment makers and flexible circuit manufacturers. Global trade flows also reflect growing strategic interest. The Middle East has increased its DMT exports to Asia by 12% in volume since 2023, filling regional supply gaps and diversifying beyond crude-linked exports. Overall, sustained demand from PET packaging, fiber production, and closed-loop chemical recycling will remain central to market growth over the next decade.
Key Takeaways
Market Growth: The global Dimethyl Terephthalate (DMT) market was valued at USD 2.4 billion in 2024 and is projected to reach USD 233 billion by 2034, growing at a CAGR of 7.3%. Growth is driven by sustained demand for polyester-based applications in textiles, packaging, and engineered plastics.
By Form: Solid DMT holds the largest market share at 71.2%, supported by its stability in handling, ease of storage, and dominant use in polyester fiber and resin production processes.
By Application: Polyester fibers lead the application segment with a 47.7% share, reflecting high-volume consumption in apparel, home textiles, nonwovens, and technical fabrics.
Driver: Rising global demand for PET packaging and polyester textiles is fueling upstream DMT consumption. The PET industry alone contributed to over 60% of DMT demand in 2024.
Restraint: Price volatility in paraxylene, a core feedstock for DMT, continues to challenge production cost stability. Supply disruptions and raw material inflation directly affect profit margins for mid-tier producers.
Opportunity: Chemical recycling of PET using DMT as an intermediate offers a scalable route to circular production. Emerging capacity in Japan, South Korea, and parts of Europe is expected to boost DMT demand in sustainable polymer manufacturing.
Trend: Technological upgrades in oxidation and esterification processes have increased DMT yield by up to 9% since 2022. This efficiency gain supports lower production costs and aligns with energy reduction targets across global manufacturing sites.
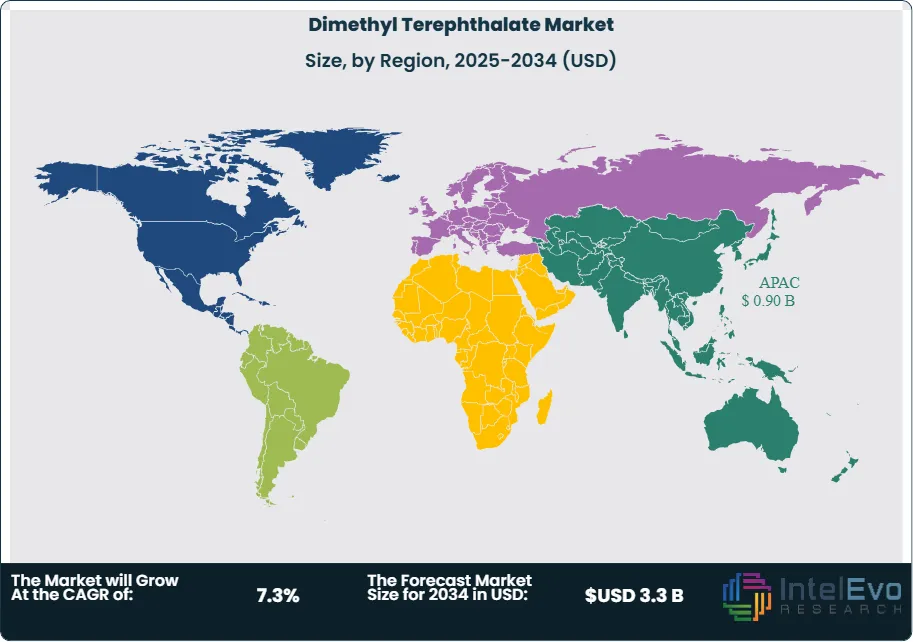
Regional Analysis: Asia Pacific dominates the global market with a 37.4% share, driven by large-scale polyester production in China, India, and Southeast Asia. The region benefits from growing demand in textiles, automotive parts, and electronic films.
Form Analysis
Dimethyl Terephthalate (DMT) is commercially produced in two forms: solid and liquid. As of 2024, the solid form accounted for approximately 71.2% of the global market share. This dominance is attributed to its stability in ambient conditions, ease of handling during transport and storage, and suitability for high-volume industrial processes. Solid DMT is widely used in the production of polyethylene terephthalate (PET) resins, polyester fibers, and films—core inputs for industries such as textiles, packaging, and automotive components.
The liquid form, while used in select downstream applications requiring faster reaction times or specialized blending, remains a niche segment due to its sensitivity to storage conditions and higher handling requirements. With the continued expansion of polyester manufacturing across Asia and the Middle East, demand for solid DMT is expected to grow steadily through 2030, particularly in regions prioritizing integrated and cost-effective production infrastructure.
Application Analysis
Polyester fibers represent the largest application segment for DMT, holding a 47.7% share in 2024. This leadership is driven by the continued global demand for synthetic textiles used in apparel, furnishings, nonwovens, and industrial fabrics. Emerging economies—particularly China, India, and Vietnam—have scaled up fiber production capacity to meet export demand and serve growing domestic markets. Additionally, fast fashion, cost efficiency, and performance benefits such as durability and low maintenance continue to support the use of polyester over natural fibers in multiple end-use sectors.
Beyond fiber, DMT is a key input in polyester films and PET resins. Polyester films are widely used in electronics, medical imaging, and flexible packaging, while PET resins dominate the beverage packaging sector. Polybutylene terephthalate (PBT), a smaller application segment, is gaining ground in the automotive and electronics industries due to its thermal and mechanical properties. As downstream industries evolve toward recyclable and performance-based materials, demand across all DMT-based applications is expected to remain strong, with polyester fiber retaining the highest consumption share through the forecast period.
Regional Analysis
Asia Pacific continues to lead the global DMT market, accounting for 37.4% of global revenue in 2024. China remains the largest producer and consumer, supported by extensive polyester manufacturing capacity and competitive feedstock sourcing. India is scaling up rapidly, bolstered by policy initiatives such as the Production-Linked Incentive (PLI) scheme targeting textile and petrochemical industries. These developments have strengthened the region’s position as a key supplier to both domestic and export markets.
In parallel, Southeast Asian economies—including Vietnam, Indonesia, and Thailand—are attracting new investments as global companies diversify supply chains to reduce exposure to rising input costs and geopolitical risks in China. Cost advantages, infrastructure upgrades, and trade-friendly policies are contributing to the region’s attractiveness as a base for DMT production and downstream applications.
Meanwhile, Japan and South Korea are advancing the market for bio-based and low-emission DMT through government-backed R&D and environmental compliance programs. This dual focus on volume-driven output and sustainable alternatives positions Asia Pacific as the core growth engine for the global DMT market in both conventional and emerging applications.
By Form (Solid, Liquid), By Application (Polyester Fibers, Polyester Film, PET Resins, Polybutylene Terephthalate, Others)
Research Methodology
Primary Research- 100 Interviews of Stakeholders
Secondary Research
Desk Research
Regional scope
North America (United States, Canada, Mexico)
Latin America (Brazil, Argentina, Columbia)
East Asia And Pacific (China, Japan, South Korea, Australia, Cambodia, Fiji, Indonesia)
Sea And South Asia (India, Singapore, Thailand, Taiwan, Malaysia)
Eastern Europe (Poland, Russia, Czech Republic, Romania)
Western Europe (Germany, U.K., France, Spain, Itlay)
Middle East & Africa (GCC Countries, Egypt, Nigeria, South Africa, Israel)
Competitive Landscape
SK chemicals, Kishida Chemical Co., Ltd, OAO Mogilevkhimvolokno, Eastman Chemical Company, Sarna Chemicals PVT. LTD, KANTO CHEMICAL CO., INC., OXXYNOVA GmbH, Fiber Intermediate Products Company, Connect Chemicals, SASA, Other Key Players
Customization Scope
Customization for segments, region/country-level will be provided. Moreover, additional customization can be done based on the requirements.
Pricing and Purchase Options
Avail customized purchase options to meet your exact research needs. We have three licenses to opt for: Single User License, Multi-User License (Up to 5 Users), Corporate Use License (Unlimited User and Printable PDF).
TABLE OF CONTENTS
1. EXECUTIVE SUMMARY
1.1. MARKET SNAPSHOT
1.2. KEY FINDINGS & INSIGHTS
1.3. ANALYST RECOMMENDATIONS
1.4. FUTURE OUTLOOK
2. RESEARCH METHODOLOGY
2.1. MARKET DEFINITION & SCOPE
2.2. RESEARCH OBJECTIVES: PRIMARY & SECONDARY DATA SOURCES
2.3. DATA COLLECTION SOURCES
2.3.1. COVERAGE OF 100+ PRIMARY RESEARCH/CONSULTATION CALLS WITH INDUSTRY STAKEHOLDERS
FIGURE 17 NORTH AMERICA DIMETHYL TEREPHTHALATE CURRENT AND FUTURE TYPE ANALYSIS, 2025–2034, (USD MILLION)
FIGURE 18 NORTH AMERICA DIMETHYL TEREPHTHALATE CURRENT AND FUTURE END USER ANALYSIS, 2025–2034, (USD MILLION)
FIGURE 19 MARKET SHARE BY COUNTRY
FIGURE 20 LATIN AMERICA DIMETHYL TEREPHTHALATE CURRENT AND FUTURE TYPE ANALYSIS, 2025–2034, (USD MILLION)
FIGURE 21 LATIN AMERICA DIMETHYL TEREPHTHALATE CURRENT AND FUTURE END USER ANALYSIS, 2025–2034, (USD MILLION)
FIGURE 22 MARKET SHARE BY COUNTRY
FIGURE 23 EASTERN EUROPE DIMETHYL TEREPHTHALATE CURRENT AND FUTURE TYPE ANALYSIS, 2025–2034, (USD MILLION)
FIGURE 24 EASTERN EUROPE DIMETHYL TEREPHTHALATE CURRENT AND FUTURE END USER ANALYSIS, 2025–2034, (USD MILLION)
FIGURE 25 MARKET SHARE BY COUNTRY
FIGURE 26 WESTERN EUROPE DIMETHYL TEREPHTHALATE CURRENT AND FUTURE TYPE ANALYSIS, 2025–2034, (USD MILLION)
FIGURE 27 WESTERN EUROPE DIMETHYL TEREPHTHALATE CURRENT AND FUTURE END USER ANALYSIS, 2025–2034, (USD MILLION)
FIGURE 28 MARKET SHARE BY COUNTRY
FIGURE 29 EAST ASIA AND PACIFIC DIMETHYL TEREPHTHALATE CURRENT AND FUTURE TYPE ANALYSIS, 2025–2034, (USD MILLION)
FIGURE 30 EAST ASIA AND PACIFIC DIMETHYL TEREPHTHALATE CURRENT AND FUTURE END USER ANALYSIS, 2025–2034, (USD MILLION)
FIGURE 31 MARKET SHARE BY COUNTRY
FIGURE 32 SEA AND SOUTH ASIA DIMETHYL TEREPHTHALATE CURRENT AND FUTURE TYPE ANALYSIS, 2025–2034, (USD MILLION)
FIGURE 33 SEA AND SOUTH ASIA DIMETHYL TEREPHTHALATE CURRENT AND FUTURE END USER ANALYSIS, 2025–2034, (USD MILLION)
FIGURE 34 MARKET SHARE BY COUNTRY
FIGURE 35 MIDDLE EAST AND AFRICA DIMETHYL TEREPHTHALATE CURRENT AND FUTURE TYPE ANALYSIS, 2025–2034, (USD MILLION)
FIGURE 36 MIDDLE EAST AND AFRICA DIMETHYL TEREPHTHALATE CURRENT AND FUTURE END USER ANALYSIS, 2025–2034, (USD MILLION)
FIGURE 37 NORTH AMERICA DIMETHYL TEREPHTHALATE CURRENT AND FUTURE MARKET VOLUME SHARE REGIONAL ANALYSIS, 2025–2034, (USD MILLION)
FIGURE 38 U.S. DIMETHYL TEREPHTHALATE CURRENT AND FUTURE TYPE ANALYSIS, 2025–2034, (USD MILLION)
FIGURE 39 U.S. DIMETHYL TEREPHTHALATE CURRENT AND FUTURE END USER ANALYSIS, 2025–2034, (USD MILLION)
FIGURE 40 CANADA DIMETHYL TEREPHTHALATE CURRENT AND FUTURE TYPE ANALYSIS, 2025–2034, (USD MILLION)
FIGURE 41 CANADA DIMETHYL TEREPHTHALATE CURRENT AND FUTURE END USER ANALYSIS, 2025–2034, (USD MILLION)
FIGURE 42 LATIN AMERICA DIMETHYL TEREPHTHALATE CURRENT AND FUTURE MARKET VOLUME SHARE REGIONAL ANALYSIS, 2025–2034, (USD MILLION)
FIGURE 43 MEXICO DIMETHYL TEREPHTHALATE CURRENT AND FUTURE TYPE ANALYSIS, 2025–2034, (USD MILLION)
FIGURE 44 MEXICO DIMETHYL TEREPHTHALATE CURRENT AND FUTURE END USER ANALYSIS, 2025–2034, (USD MILLION)
FIGURE 45 BRAZIL DIMETHYL TEREPHTHALATE CURRENT AND FUTURE TYPE ANALYSIS, 2025–2034, (USD MILLION)
FIGURE 46 BRAZIL DIMETHYL TEREPHTHALATE CURRENT AND FUTURE END USER ANALYSIS, 2025–2034, (USD MILLION)
FIGURE 47 ARGENTINA DIMETHYL TEREPHTHALATE CURRENT AND FUTURE TYPE ANALYSIS, 2025–2034, (USD MILLION)
FIGURE 48 ARGENTINA DIMETHYL TEREPHTHALATE CURRENT AND FUTURE END USER ANALYSIS, 2025–2034, (USD MILLION)
FIGURE 49 COLUMBIA DIMETHYL TEREPHTHALATE CURRENT AND FUTURE TYPE ANALYSIS, 2025–2034, (USD MILLION)
FIGURE 50 COLUMBIA DIMETHYL TEREPHTHALATE CURRENT AND FUTURE END USER ANALYSIS, 2025–2034, (USD MILLION)
FIGURE 51 REST OF LATIN AMERICA DIMETHYL TEREPHTHALATE CURRENT AND FUTURE TYPE ANALYSIS, 2025–2034, (USD MILLION)
FIGURE 52 REST OF LATIN AMERICA DIMETHYL TEREPHTHALATE CURRENT AND FUTURE END USER ANALYSIS, 2025–2034, (USD MILLION)
FIGURE 53 EASTERN EUROPE DIMETHYL TEREPHTHALATE CURRENT AND FUTURE MARKET VOLUME SHARE REGIONAL ANALYSIS, 2025–2034, (USD MILLION)
FIGURE 54 POLAND DIMETHYL TEREPHTHALATE CURRENT AND FUTURE TYPE ANALYSIS, 2025–2034, (USD MILLION)
FIGURE 55 POLAND DIMETHYL TEREPHTHALATE CURRENT AND FUTURE END USER ANALYSIS, 2025–2034, (USD MILLION)
FIGURE 56 RUSSIA DIMETHYL TEREPHTHALATE CURRENT AND FUTURE TYPE ANALYSIS, 2025–2034, (USD MILLION)
FIGURE 57 RUSSIA DIMETHYL TEREPHTHALATE CURRENT AND FUTURE END USER ANALYSIS, 2025–2034, (USD MILLION)
FIGURE 58 CZECH REPUBLIC DIMETHYL TEREPHTHALATE CURRENT AND FUTURE TYPE ANALYSIS, 2025–2034, (USD MILLION)
FIGURE 59 CZECH REPUBLIC DIMETHYL TEREPHTHALATE CURRENT AND FUTURE END USER ANALYSIS, 2025–2034, (USD MILLION)
FIGURE 60 ROMANIA DIMETHYL TEREPHTHALATE CURRENT AND FUTURE TYPE ANALYSIS, 2025–2034, (USD MILLION)
FIGURE 61 ROMANIA DIMETHYL TEREPHTHALATE CURRENT AND FUTURE END USER ANALYSIS, 2025–2034, (USD MILLION)
FIGURE 62 REST OF EASTERN EUROPE DIMETHYL TEREPHTHALATE CURRENT AND FUTURE TYPE ANALYSIS, 2025–2034, (USD MILLION)
FIGURE 63 REST OF EASTERN EUROPE DIMETHYL TEREPHTHALATE CURRENT AND FUTURE END USER ANALYSIS, 2025–2034, (USD MILLION)
FIGURE 64 WESTERN EUROPE DIMETHYL TEREPHTHALATE CURRENT AND FUTURE MARKET VOLUME SHARE REGIONAL ANALYSIS, 2025–2034, (USD MILLION)
FIGURE 65 GERMANY DIMETHYL TEREPHTHALATE CURRENT AND FUTURE TYPE ANALYSIS, 2025–2034, (USD MILLION)
FIGURE 66 GERMANY DIMETHYL TEREPHTHALATE CURRENT AND FUTURE END USER ANALYSIS, 2025–2034, (USD MILLION)
FIGURE 67 FRANCE DIMETHYL TEREPHTHALATE CURRENT AND FUTURE TYPE ANALYSIS, 2025–2034, (USD MILLION)
FIGURE 68 FRANCE DIMETHYL TEREPHTHALATE CURRENT AND FUTURE END USER ANALYSIS, 2025–2034, (USD MILLION)
FIGURE 69 UK DIMETHYL TEREPHTHALATE CURRENT AND FUTURE TYPE ANALYSIS, 2025–2034, (USD MILLION)
FIGURE 70 UK DIMETHYL TEREPHTHALATE CURRENT AND FUTURE END USER ANALYSIS, 2025–2034, (USD MILLION)
FIGURE 71 SPAIN DIMETHYL TEREPHTHALATE CURRENT AND FUTURE TYPE ANALYSIS, 2025–2034, (USD MILLION)
FIGURE 72 SPAIN DIMETHYL TEREPHTHALATE CURRENT AND FUTURE END USER ANALYSIS, 2025–2034, (USD MILLION)
FIGURE 73 ITALY DIMETHYL TEREPHTHALATE CURRENT AND FUTURE TYPE ANALYSIS, 2025–2034, (USD MILLION)
FIGURE 74 ITALY DIMETHYL TEREPHTHALATE CURRENT AND FUTURE END USER ANALYSIS, 2025–2034, (USD MILLION)
FIGURE 75 REST OF WESTERN EUROPE DIMETHYL TEREPHTHALATE CURRENT AND FUTURE TYPE ANALYSIS, 2025–2034, (USD MILLION)
FIGURE 76 REST OF WESTERN EUROPE DIMETHYL TEREPHTHALATE CURRENT AND FUTURE END USER ANALYSIS, 2025–2034, (USD MILLION)
FIGURE 77 EAST ASIA AND PACIFIC DIMETHYL TEREPHTHALATE CURRENT AND FUTURE MARKET VOLUME SHARE REGIONAL ANALYSIS, 2025–2034, (USD MILLION)
FIGURE 78 CHINA DIMETHYL TEREPHTHALATE CURRENT AND FUTURE TYPE ANALYSIS, 2025–2034, (USD MILLION)
FIGURE 79 CHINA DIMETHYL TEREPHTHALATE CURRENT AND FUTURE END USER ANALYSIS, 2025–2034, (USD MILLION)
FIGURE 80 JAPAN DIMETHYL TEREPHTHALATE CURRENT AND FUTURE TYPE ANALYSIS, 2025–2034, (USD MILLION)
FIGURE 81 JAPAN DIMETHYL TEREPHTHALATE CURRENT AND FUTURE END USER ANALYSIS, 2025–2034, (USD MILLION)
FIGURE 82 AUSTRALIA DIMETHYL TEREPHTHALATE CURRENT AND FUTURE TYPE ANALYSIS, 2025–2034, (USD MILLION)
FIGURE 83 AUSTRALIA DIMETHYL TEREPHTHALATE CURRENT AND FUTURE END USER ANALYSIS, 2025–2034, (USD MILLION)
FIGURE 84 CAMBODIA DIMETHYL TEREPHTHALATE CURRENT AND FUTURE TYPE ANALYSIS, 2025–2034, (USD MILLION)
FIGURE 85 CAMBODIA DIMETHYL TEREPHTHALATE CURRENT AND FUTURE END USER ANALYSIS, 2025–2034, (USD MILLION)
FIGURE 86 FIJI DIMETHYL TEREPHTHALATE CURRENT AND FUTURE TYPE ANALYSIS, 2025–2034, (USD MILLION)
FIGURE 87 FIJI DIMETHYL TEREPHTHALATE CURRENT AND FUTURE END USER ANALYSIS, 2025–2034, (USD MILLION)
FIGURE 88 INDONESIA DIMETHYL TEREPHTHALATE CURRENT AND FUTURE TYPE ANALYSIS, 2025–2034, (USD MILLION)
FIGURE 89 INDONESIA DIMETHYL TEREPHTHALATE CURRENT AND FUTURE END USER ANALYSIS, 2025–2034, (USD MILLION)
FIGURE 90 SOUTH KOREA DIMETHYL TEREPHTHALATE CURRENT AND FUTURE TYPE ANALYSIS, 2025–2034, (USD MILLION)
FIGURE 91 SOUTH KOREA DIMETHYL TEREPHTHALATE CURRENT AND FUTURE END USER ANALYSIS, 2025–2034, (USD MILLION)
FIGURE 92 REST OF EAST ASIA AND PACIFIC DIMETHYL TEREPHTHALATE CURRENT AND FUTURE TYPE ANALYSIS, 2025–2034, (USD MILLION)
FIGURE 93 REST OF EAST ASIA AND PACIFIC DIMETHYL TEREPHTHALATE CURRENT AND FUTURE END USER ANALYSIS, 2025–2034, (USD MILLION)
FIGURE 94 SEA AND SOUTH ASIA DIMETHYL TEREPHTHALATE CURRENT AND FUTURE MARKET VOLUME SHARE REGIONAL ANALYSIS, 2025–2034, (USD MILLION)
FIGURE 95 BANGLADESH DIMETHYL TEREPHTHALATE CURRENT AND FUTURE TYPE ANALYSIS, 2025–2034, (USD MILLION)
FIGURE 96 BANGLADESH DIMETHYL TEREPHTHALATE CURRENT AND FUTURE END USER ANALYSIS, 2025–2034, (USD MILLION)
FIGURE 97 NEW ZEALAND DIMETHYL TEREPHTHALATE CURRENT AND FUTURE TYPE ANALYSIS, 2025–2034, (USD MILLION)
FIGURE 98 NEW ZEALAND DIMETHYL TEREPHTHALATE CURRENT AND FUTURE END USER ANALYSIS, 2025–2034, (USD MILLION)
FIGURE 99 INDIA DIMETHYL TEREPHTHALATE CURRENT AND FUTURE TYPE ANALYSIS, 2025–2034, (USD MILLION)
FIGURE 100 INDIA DIMETHYL TEREPHTHALATE CURRENT AND FUTURE END USER ANALYSIS, 2025–2034, (USD MILLION)
FIGURE 101 SINGAPORE DIMETHYL TEREPHTHALATE CURRENT AND FUTURE TYPE ANALYSIS, 2025–2034, (USD MILLION)
FIGURE 102 SINGAPORE DIMETHYL TEREPHTHALATE CURRENT AND FUTURE END USER ANALYSIS, 2025–2034, (USD MILLION)
FIGURE 103 THAILAND DIMETHYL TEREPHTHALATE CURRENT AND FUTURE TYPE ANALYSIS, 2025–2034, (USD MILLION)
FIGURE 104 THAILAND DIMETHYL TEREPHTHALATE CURRENT AND FUTURE END USER ANALYSIS, 2025–2034, (USD MILLION)
FIGURE 105 TAIWAN DIMETHYL TEREPHTHALATE CURRENT AND FUTURE TYPE ANALYSIS, 2025–2034, (USD MILLION)
FIGURE 106 TAIWAN DIMETHYL TEREPHTHALATE CURRENT AND FUTURE END USER ANALYSIS, 2025–2034, (USD MILLION)
FIGURE 107 MALAYSIA DIMETHYL TEREPHTHALATE CURRENT AND FUTURE TYPE ANALYSIS, 2025–2034, (USD MILLION)
FIGURE 108 MALAYSIA DIMETHYL TEREPHTHALATE CURRENT AND FUTURE END USER ANALYSIS, 2025–2034, (USD MILLION)
FIGURE 109 REST OF SEA AND SOUTH ASIA DIMETHYL TEREPHTHALATE CURRENT AND FUTURE TYPE ANALYSIS, 2025–2034, (USD MILLION)
FIGURE 110 REST OF SEA AND SOUTH ASIA DIMETHYL TEREPHTHALATE CURRENT AND FUTURE END USER ANALYSIS, 2025–2034, (USD MILLION)
FIGURE 111 MIDDLE EAST AND AFRICA DIMETHYL TEREPHTHALATE CURRENT AND FUTURE MARKET VOLUME SHARE REGIONAL ANALYSIS, 2025–2034, (USD MILLION)
FIGURE 112 GCC COUNTRIES DIMETHYL TEREPHTHALATE CURRENT AND FUTURE TYPE ANALYSIS, 2025–2034, (USD MILLION)
FIGURE 113 GCC COUNTRIES DIMETHYL TEREPHTHALATE CURRENT AND FUTURE END USER ANALYSIS, 2025–2034, (USD MILLION)
FIGURE 114 SAUDI ARABIA DIMETHYL TEREPHTHALATE CURRENT AND FUTURE TYPE ANALYSIS, 2025–2034, (USD MILLION)
FIGURE 115 SAUDI ARABIA DIMETHYL TEREPHTHALATE CURRENT AND FUTURE END USER ANALYSIS, 2025–2034, (USD MILLION)
FIGURE 116 UAE DIMETHYL TEREPHTHALATE CURRENT AND FUTURE TYPE ANALYSIS, 2025–2034, (USD MILLION)
FIGURE 117 UAE DIMETHYL TEREPHTHALATE CURRENT AND FUTURE END USER ANALYSIS, 2025–2034, (USD MILLION)
FIGURE 118 BAHRAIN DIMETHYL TEREPHTHALATE CURRENT AND FUTURE TYPE ANALYSIS, 2025–2034, (USD MILLION)
FIGURE 119 BAHRAIN DIMETHYL TEREPHTHALATE CURRENT AND FUTURE END USER ANALYSIS, 2025–2034, (USD MILLION)
FIGURE 120 KUWAIT DIMETHYL TEREPHTHALATE CURRENT AND FUTURE TYPE ANALYSIS, 2025–2034, (USD MILLION)
FIGURE 121 KUWAIT DIMETHYL TEREPHTHALATE CURRENT AND FUTURE END USER ANALYSIS, 2025–2034, (USD MILLION)
FIGURE 122 OMAN DIMETHYL TEREPHTHALATE CURRENT AND FUTURE TYPE ANALYSIS, 2025–2034, (USD MILLION)
FIGURE 123 OMAN DIMETHYL TEREPHTHALATE CURRENT AND FUTURE END USER ANALYSIS, 2025–2034, (USD MILLION)
FIGURE 124 QATAR DIMETHYL TEREPHTHALATE CURRENT AND FUTURE TYPE ANALYSIS, 2025–2034, (USD MILLION)
FIGURE 125 QATAR DIMETHYL TEREPHTHALATE CURRENT AND FUTURE END USER ANALYSIS, 2025–2034, (USD MILLION)
FIGURE 126 EGYPT DIMETHYL TEREPHTHALATE CURRENT AND FUTURE TYPE ANALYSIS, 2025–2034, (USD MILLION)
FIGURE 127 EGYPT DIMETHYL TEREPHTHALATE CURRENT AND FUTURE END USER ANALYSIS, 2025–2034, (USD MILLION)
FIGURE 128 NIGERIA DIMETHYL TEREPHTHALATE CURRENT AND FUTURE TYPE ANALYSIS, 2025–2034, (USD MILLION)
FIGURE 129 NIGERIA DIMETHYL TEREPHTHALATE CURRENT AND FUTURE END USER ANALYSIS, 2025–2034, (USD MILLION)
FIGURE 130 SOUTH AFRICA DIMETHYL TEREPHTHALATE CURRENT AND FUTURE TYPE ANALYSIS, 2025–2034, (USD MILLION)
FIGURE 131 SOUTH AFRICA DIMETHYL TEREPHTHALATE CURRENT AND FUTURE END USER ANALYSIS, 2025–2034, (USD MILLION)
FIGURE 132 ISRAEL DIMETHYL TEREPHTHALATE CURRENT AND FUTURE TYPE ANALYSIS, 2025–2034, (USD MILLION)
FIGURE 133 ISRAEL DIMETHYL TEREPHTHALATE CURRENT AND FUTURE END USER ANALYSIS, 2025–2034, (USD MILLION)
FIGURE 134 REST OF MEA DIMETHYL TEREPHTHALATE CURRENT AND FUTURE TYPE ANALYSIS, 2025–2034, (USD MILLION)
FIGURE 135 REST OF MEA DIMETHYL TEREPHTHALATE CURRENT AND FUTURE END USER ANALYSIS, 2025–2034, (USD MILLION)
FIGURE 136 U. S. MARKET SHARE ANALYSIS BY TYPE (2024)
FIGURE 137 U. S. MARKET SHARE ANALYSIS BY END USER (2024)
FIGURE 138 CANADA MARKET SHARE ANALYSIS BY TYPE (2024)
FIGURE 139 CANADA MARKET SHARE ANALYSIS BY END USER (2024)
FIGURE 140 MEXICO MARKET SHARE ANALYSIS BY TYPE (2024)
FIGURE 141 MEXICO MARKET SHARE ANALYSIS BY END USER (2024)
FIGURE 142 CHINA MARKET SHARE ANALYSIS BY TYPE (2024)
FIGURE 143 CHINA MARKET SHARE ANALYSIS BY END USER (2024)
FIGURE 144 JAPAN MARKET SHARE ANALYSIS BY TYPE (2024)
FIGURE 145 JAPAN MARKET SHARE ANALYSIS BY END USER (2024)
FIGURE 146 INDIA MARKET SHARE ANALYSIS BY TYPE (2024)
FIGURE 147 INDIA MARKET SHARE ANALYSIS BY END USER (2024)
FIGURE 148 SOUTH KOREA MARKET SHARE ANALYSIS BY TYPE (2024)
FIGURE 149 SOUTH KOREA MARKET SHARE ANALYSIS BY END USER (2024)
FIGURE 150 SAUDI ARABIA MARKET SHARE ANALYSIS BY TYPE (2024)
FIGURE 151 SAUDI ARABIA MARKET SHARE ANALYSIS BY END USER (2024)
FIGURE 152 UAE MARKET SHARE ANALYSIS BY TYPE (2024)
FIGURE 153 UAE MARKET SHARE ANALYSIS BY END USER (2024)
FIGURE 154 EGYPT MARKET SHARE ANALYSIS BY TYPE (2024)
FIGURE 155 EGYPT MARKET SHARE ANALYSIS BY END USER (2024)
FIGURE 156 NIGERIA MARKET SHARE ANALYSIS BY TYPE (2024)
FIGURE 157 NIGERIA MARKET SHARE ANALYSIS BY END USER (2024)
FIGURE 158 SOUTH AFRICA MARKET SHARE ANALYSIS BY TYPE (2024)
FIGURE 159 SOUTH AFRICA MARKET SHARE ANALYSIS BY END USER (2024)
FIGURE 160 GERMANY MARKET SHARE ANALYSIS BY TYPE (2024)
FIGURE 161 GERMANY MARKET SHARE ANALYSIS BY END USER (2024)
FIGURE 162 FRANCE MARKET SHARE ANALYSIS BY TYPE (2024)
FIGURE 163 FRANCE MARKET SHARE ANALYSIS BY END USER (2024)
FIGURE 164 UK MARKET SHARE ANALYSIS BY TYPE (2024)
FIGURE 165 UK MARKET SHARE ANALYSIS BY END USER (2024)
FIGURE 166 SPAIN MARKET SHARE ANALYSIS BY TYPE (2024)
FIGURE 167 SPAIN MARKET SHARE ANALYSIS BY END USER (2024)
FIGURE 168 ITALY MARKET SHARE ANALYSIS BY TYPE (2024)
FIGURE 169 ITALY MARKET SHARE ANALYSIS BY END USER (2024)
FIGURE 170 BRAZIL MARKET SHARE ANALYSIS BY TYPE (2024)
FIGURE 171 BRAZIL MARKET SHARE ANALYSIS BY END USER (2024)
FIGURE 172 ARGENTINA MARKET SHARE ANALYSIS BY TYPE (2024)
FIGURE 173 ARGENTINA MARKET SHARE ANALYSIS BY END USER (2024)
FIGURE 174 COLUMBIA MARKET SHARE ANALYSIS BY TYPE (2024)
FIGURE 175 COLUMBIA MARKET SHARE ANALYSIS BY END USER (2024)
FIGURE 176 GLOBAL DIMETHYL TEREPHTHALATE CURRENT AND FUTURE MARKET KEY COUNTRY LEVEL ANALYSIS, 2024–2034, (USD MILLION)
FIGURE 177 FINANCIAL OVERVIEW:
Key Player Analysis
Eastman Chemical Company: Eastman Chemical Company remains a leading producer in the global Dimethyl Terephthalate (DMT) market, with integrated operations spanning from paraxylene feedstock to downstream polyester applications. The company leverages its strong supply chain infrastructure and vertically integrated production to maintain cost efficiency and consistent quality. In 2025, Eastman continues to prioritize investments in sustainable chemical processes, particularly around closed-loop PET recycling and circular feedstocks. Its Tennessee-based production facility, upgraded in 2024, now includes a chemical recycling unit capable of processing over 100,000 metric tons of post-consumer plastic annually. This positions Eastman as a strategic supplier to clients focused on reducing Scope 3 emissions in packaging and consumer goods.
SK chemicals: SK chemicals has positioned itself as an innovator in the specialty DMT segment, with a strong focus on bio-based alternatives and eco-friendly polyester materials. Headquartered in South Korea, the company benefits from close proximity to major electronics and textile manufacturers across Asia. In 2025, SK chemicals expanded its Green Chemicals Division, launching a bio-DMT line using plant-based feedstocks. This product line targets demand from electronics, packaging, and apparel brands seeking lower-carbon raw materials. With regulatory tailwinds from Korea’s Green New Deal and export incentives for sustainable materials, SK chemicals is securing long-term procurement contracts with multinational firms looking to align with regional sustainability mandates.
OXXYNOVA GmbH: OXXYNOVA GmbH operates as a niche player specializing in recycled DMT through chemical depolymerization of PET waste. Based in Germany, the company has carved out a strong position in the European market by supplying high-purity DMT for applications in fiber, film, and engineering plastics. Its proprietary methanolysis process allows for closed-loop recycling and aligns with the EU’s 2030 plastics directive. In 2025, OXXYNOVA entered a joint development agreement with a leading packaging firm to scale its recycled DMT capacity by 40% over the next two years. This move reinforces its role in the circular economy and positions it as a key supplier to sustainability-driven manufacturers.
SASA: SASA, one of Turkey’s largest petrochemical producers, plays a challenger role in the global DMT market with aggressive capacity expansion strategies. The company benefits from favorable access to feedstocks and a growing domestic market in polyester-based applications. In 2024, SASA commissioned a new DMT production unit with an annual capacity of 160,000 tons, aimed at meeting rising demand from textiles and packaging sectors in Europe and the Middle East. The company is also investing in integrated PET and fiber production, reducing reliance on external suppliers and increasing downstream value capture. SASA’s pricing advantage and export reach are key differentiators in a cost-sensitive market.
Market Key Players
SK chemicals
Kishida Chemical Co., Ltd
OAO Mogilevkhimvolokno
Eastman Chemical Company
Sarna Chemicals PVT. LTD
KANTO CHEMICAL CO., INC.
OXXYNOVA GmbH
Fiber Intermediate Products Company
Connect Chemicals
SASA
Other Key Players
Driver:
Rising Plastics Consumption and PET Demand Accelerate DMT Market Growth
As of 2025, the global Dimethyl Terephthalate (DMT) market is closely tied to the broader expansion of plastics consumption across industrial sectors. DMT is a critical intermediate in the production of PET resins and polyester fibers—materials heavily used in packaging, textiles, construction, and automotive components. With the global plastics market projected to exceed USD 800 billion by 2027, demand for key inputs like DMT continues to rise. Automotive manufacturers are integrating more PET-based components to reduce vehicle weight and improve energy efficiency, particularly in electric vehicle platforms. Simultaneously, the packaging sector is expanding due to e-commerce growth and stricter hygiene requirements, which reinforce the need for high-performance, lightweight plastics.
Recyclability Push and Circular Polymer Systems Reinforce Long-Term DMT Demand
The growing emphasis on recyclability and circular supply chains also places DMT at the center of polymer production strategies. PET-based materials derived from DMT are increasingly selected for closed-loop systems, enhancing product lifecycle value. This sustained demand across multiple end-use sectors continues to support steady investment in DMT capacity, particularly in Asia and the Middle East.
Restraint:
High Feedstock Volatility and Capital Costs Create Margin Pressure for DMT Producers
The DMT industry faces margin pressure due to elevated production costs and raw material volatility. Paraxylene, the key feedstock in DMT synthesis, remains subject to global price swings driven by crude oil fluctuations and refining capacity constraints. As of early 2025, average paraxylene prices have increased by nearly 11% year-over-year, directly impacting input costs for DMT producers. Capital requirements for DMT manufacturing facilities remain high, often limiting entry for smaller players and delaying expansion in emerging markets.
Environmental Regulations and Compliance Burdens Limit Production Scalability
In addition, regulatory scrutiny over plastic production and environmental compliance is tightening. New limits on single-use plastic content and extended producer responsibility (EPR) schemes in markets such as the European Union and North America are raising compliance costs. These factors collectively restrict production scalability and make long-term planning more complex for manufacturers reliant on fossil-based raw materials.
Opportunity:
Bio-Based DMT Emerges as a High-Growth Pathway for Sustainable Polymer Production
The shift toward bio-based alternatives presents a significant opening for producers of sustainable dimethyl terephthalate. Bio-DMT, derived from renewable sources such as biomass and citrus-based terpenes, offers comparable performance to conventional DMT with a lower environmental footprint. By 2030, bio-based polymers are expected to account for at least 10% of total global plastic production, creating a clear pathway for alternative feedstocks in PET and polyester manufacturing.
Global Sustainability Policies and Procurement Incentives Boost Bio-DMT Adoption
Initiatives such as the EU’s Green Deal and the U.S. BioPreferred Program are driving early adoption through policy mandates and procurement incentives. These frameworks not only accelerate market penetration but also support long-term demand from consumer goods, packaging, and electronics sectors. As sustainability targets become standard within supply chains, DMT producers investing in bio-based R&D and conversion capacity stand to capture high-margin growth from brand-aligned buyers and institutional procurement channels.
Trend:
Rising Use of DMT-Derived Polymers in Consumer Electronics Reshapes Demand Patterns
The adoption of DMT-derived polymers in consumer electronics is reshaping demand patterns. Polyester films and PET resins, both made using DMT, are now widely used in electronic displays, thermal insulation layers, and casing materials. Their low weight, thermal resistance, and durability make them suitable for use in smartphones, wearables, and smart home devices. In 2025, electronics accounted for approximately 8–10% of total polyester film consumption, a share that is expected to increase with the rising popularity of flexible and foldable devices.
Growth of Sustainable Electronics Drives Adoption of Recyclable and Bio-Based DMT Materials
Bio-based DMT compounds are also gaining traction in sustainable electronics design. Leading electronics manufacturers are experimenting with recyclable and biodegradable PET materials for internal components and packaging. This shift aligns with stricter ESG compliance standards across the electronics value chain. As electronics brands pursue greener product portfolios, DMT’s role in durable, high-specification polymer applications is set to expand, reinforcing its strategic importance beyond traditional industrial use.
Recent Developments
Dec 2024 – SASA: SASA commissioned a new DMT production facility in Adana, Turkey, with an annual capacity of 160,000 metric tons. The USD 350 million project is aimed at serving polyester fiber and PET resin demand in Europe and the Middle East. This expansion strengthens SASA’s cost position and regional export footprint.
Feb 2025 – SK chemicals: SK chemicals launched its first commercial-scale production line for bio-based dimethyl terephthalate at its Ulsan plant. The unit, with an initial capacity of 25,000 tons per year, targets electronics and packaging sectors seeking renewable feedstocks. This move positions SK as a key supplier in the growing bio-polyester value chain.
Apr 2025 – Eastman Chemical Company: Eastman completed a USD 120 million upgrade to its Tennessee facility, adding advanced methanolysis technology to boost chemical recycling of PET waste into DMT. The upgrade is expected to raise recycled DMT output by 30% annually. It enhances Eastman’s ability to meet circular economy targets and secure long-term contracts with sustainability-focused clients.
Jul 2025 – OXXYNOVA GmbH: OXXYNOVA announced a joint venture with a European packaging company to scale its recycled DMT operations by 40% over two years. The partnership includes co-investment in methanolysis infrastructure in Belgium. The agreement expands OXXYNOVA’s recycled DMT capacity and deepens access to downstream packaging markets.
Sep 2025 – Indorama Ventures: Indorama Ventures disclosed plans to enter the European DMT market through the acquisition of a mid-sized chemical producer in Spain, valued at approximately USD 280 million. The deal includes two production lines with a combined capacity of 90,000 metric tons. This acquisition provides Indorama with immediate entry into Western Europe and supports its backward integration strategy in PET production.