Disposables Packaging Market Size, Growth Trends | CAGR of 7.6%
Global Disposables Packaging Market Size, Share & Materials Analysis By Product Type (Plastics, Paper, Biodegradable), By End Use (Foodservice, Healthcare, E-commerce), Sustainability Regulations, Smart Packaging Trends & Forecast 2025–2034
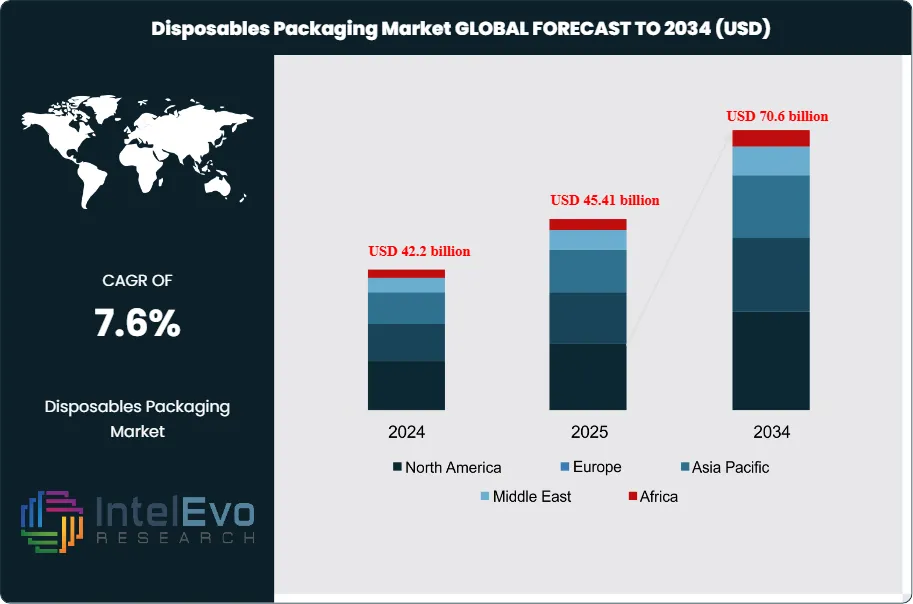
The Disposables Packaging Market is estimated at USD 42.2 billion in 2024 and is on track to reach roughly USD 70.6 billion by 2034, implying a compound annual growth rate of 7.6% over 2025–2034. This growth is driven by the rapid expansion of food delivery, e-commerce, and healthcare services, where hygiene, convenience, and safety are non-negotiable requirements. Increasing adoption of sustainable, biodegradable, and recyclable packaging materials is further accelerating market momentum. In parallel, smart packaging features such as QR codes and tamper-evident designs are enhancing consumer trust and regulatory compliance, positioning disposable packaging as a critical enabler of modern consumption patterns.
Disposables Packaging Market Global Forecast to 2034 (USD)
CAGR OF
7.6%
Disposables Packaging Market
USD 42.2 BUSD 45.41 BUSD 70.6 B
Get more details on this report -
This steady expansion reflects the growing role of single-use packaging across food, healthcare, retail, and e-commerce supply chains. Historically, the market has expanded in line with urbanization and rising hygiene standards. Over the past decade, the surge in online retail has accelerated demand, with global e-commerce sales reaching USD 5.9 trillion in 2023 and projected to surpass USD 8 trillion by 2027. This structural shift has made protective, lightweight, and disposable packaging a critical enabler of logistics efficiency.
Demand-side growth is driven by consumer preference for convenience, safety, and hygiene. Food delivery platforms and healthcare providers rely heavily on disposable formats to ensure compliance and reduce contamination risks. On the supply side, manufacturers face rising costs of raw materials and increasing competition, which has intensified price pressures. Market saturation is evident, with many suppliers offering similar solutions. To differentiate, companies are investing in recyclable paper, compostable bioplastics, and lightweight aluminum formats that balance durability with sustainability.
Regulatory frameworks are reshaping the industry. In the United States, Extended Producer Responsibility laws are gaining momentum, with Minnesota mandating packaging waste management by 2031. Similar policies in Europe and parts of Asia are accelerating the transition toward recyclable and biodegradable materials. Compliance is no longer optional; it is becoming a prerequisite for market access. For investors, this regulatory shift signals both risk and opportunity. Firms that adapt early by redesigning packaging systems will capture share, while laggards may face penalties and reputational setbacks.
Technological progress is also influencing adoption. Automation in packaging lines, AI-driven material optimization, and digital tracking of supply chains are improving efficiency and reducing waste. For example, industry best practices recommend three inches of internal packaging for fragile shipments, a standard increasingly supported by automated design tools. These advances not only reduce product returns—estimated at 20% to 30% of shipments during peak seasons—but also strengthen brand reliability.
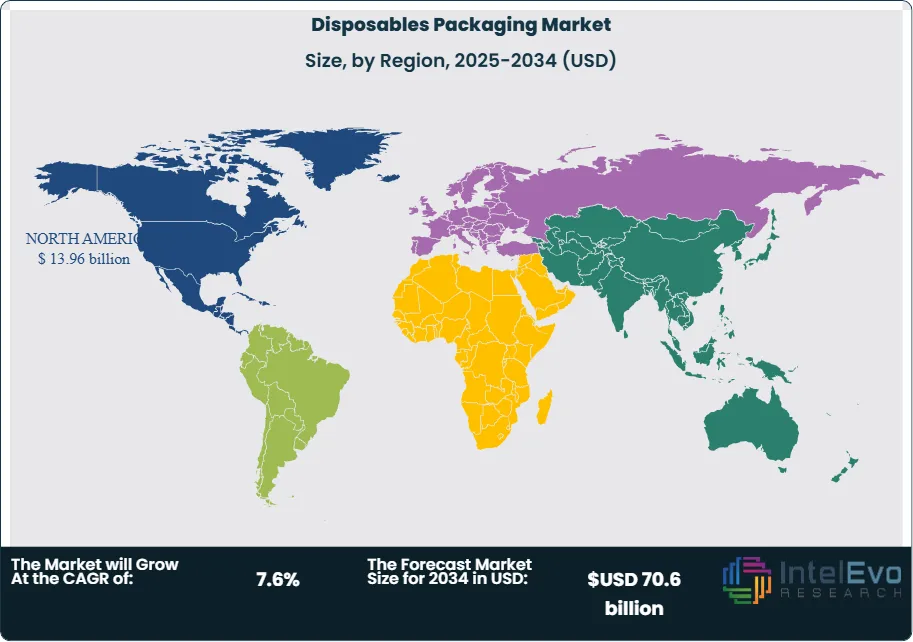
Regionally, North America and Western Europe remain mature markets with strong regulatory oversight and high consumer expectations. Asia-Pacific is emerging as the fastest-growing region, supported by rapid e-commerce penetration in China, India, and Southeast Asia. For investors, the most attractive opportunities lie in markets where sustainability mandates intersect with rising consumer demand, creating a clear pathway for growth.
Key Takeaways
Market Growth: The global disposables packaging market was valued at USD 40.2 billion in 2024 and is projected to reach USD 70.6 billion by 2034, expanding at a CAGR of 7.6%. Growth is supported by rising e-commerce volumes, food delivery expansion, and heightened hygiene standards in healthcare and retail.
Material: Plastic accounted for 41.8% of the market in 2024, driven by its low cost, versatility, and widespread use across foodservice and medical applications. Despite regulatory pressure, its dominance persists due to established supply chains and performance advantages.
Packaging Type: Flexible packaging led with 52.7% share in 2024, supported by its lightweight properties, reduced logistics costs, and suitability for high-volume food and beverage shipments. Its adoption is expected to remain strong as companies seek cost-efficient formats.
Product Type: Containers represented 38.9% of the market in 2024, reflecting their critical role in food and beverage packaging. Their durability and ability to preserve freshness make them the preferred choice for quick-service restaurants and delivery platforms.
End Use: The food and beverage sector held 60.1% share in 2024, underpinned by rising demand for packaged meals, ready-to-eat products, and online food delivery. This segment will remain the largest consumer of disposables packaging through 2034.
Driver: Global e-commerce sales reached USD 5.9 trillion in 2023 and are forecast to exceed USD 8 trillion by 2027. This surge directly fuels demand for protective disposable packaging to reduce product damage and returns.
Restraint: Market saturation and price competition are intensifying, with multiple suppliers offering similar solutions. This has compressed margins and limited differentiation, particularly in mature markets.
Opportunity: Asia-Pacific is expected to record the fastest CAGR through 2034, supported by rapid e-commerce penetration in China, India, and Southeast Asia. Rising consumer demand for sustainable packaging creates a high-growth investment window.
Trend: Sustainability regulations are reshaping product design. Extended Producer Responsibility laws in the U.S. and Europe are accelerating the shift toward recyclable and compostable materials, with early adopters gaining competitive advantage.
Regional Analysis: North America led with 35.6% share and USD 13.96 billion in 2024, supported by strong foodservice and healthcare demand. Asia-Pacific is emerging as the key growth hub, while Europe remains a regulatory leader driving sustainable packaging adoption.
Material Type Analysis
Plastic continues to dominate the disposables packaging market, accounting for 41.8% of global share in 2024 and maintaining its lead into 2025. Its low cost, durability, and adaptability across multiple industries make it the preferred choice for food containers, trays, wraps, and medical packaging. Quick-service restaurants and delivery platforms rely heavily on plastic cups, lids, and utensils, while the expansion of online food delivery and convenience retail further sustains demand. Despite regulatory pressure, plastic remains entrenched due to its cost efficiency and ability to preserve freshness and prevent leakage.
Paper and paperboard are gaining traction as sustainability concerns reshape consumer and regulatory priorities. Their recyclability and alignment with corporate sustainability goals have positioned them as the fastest-growing material segment, with adoption rising in retail and foodservice packaging. Aluminum retains a strong presence in beverage cans and foil trays, particularly where extended shelf life is critical. Glass, while niche, is favored in premium and reusable packaging formats. Emerging biodegradable polymers and compostable materials are also entering the market, supported by regulatory incentives and consumer demand for eco-friendly alternatives.
Packaging Type Analysis
Flexible packaging accounted for 52.7% of the market in 2024 and is projected to expand further through 2030. Its lightweight structure, lower material use, and reduced logistics costs make it the preferred choice for snacks, condiments, frozen foods, and single-use consumer products. Flexible formats such as pouches, sachets, and films also extend shelf life by protecting against moisture and oxygen, making them attractive to both manufacturers and retailers. Rising demand for resealable and portable packaging continues to reinforce this segment’s growth trajectory.
Rigid packaging, which includes bottles, containers, and trays, remains essential for products requiring structural integrity and protection. It is widely used in beverages, fragile goods, and heavy items where stacking and durability are critical. While rigid formats face competition from flexible alternatives, their role in foodservice, healthcare, and industrial applications ensures steady demand. Companies are increasingly adopting recyclable rigid materials to align with sustainability regulations, particularly in North America and Europe.
By Product Type
Containers held the largest share at 38.9% in 2024, reflecting their widespread use in foodservice, takeout, and delivery platforms. Their ability to maintain temperature, prevent contamination, and offer portion control makes them indispensable across quick-service restaurants and meal delivery services. The rise of home-delivered meals and ready-to-eat products has further accelerated demand for leak-proof and stackable container formats.
Trays are widely used for bakery items and ready meals, while cups and lids remain essential in cafes and beverage outlets. Bottles continue to dominate in beverages, sauces, and personal care packaging. Pouches and sachets are gaining share due to their convenience in condiments, wipes, and sample packaging. Wraps and films are heavily used in supermarkets for fresh produce and meat. Other formats, including clamshells and hybrid packaging, are expanding as companies experiment with sustainable and compostable designs.
End-Use Industry Analysis
The food and beverage sector accounted for 60.1% of the market in 2024 and remains the largest consumer of disposable packaging in 2025. Rising urbanization, changing dietary habits, and the growth of online food delivery platforms such as Uber Eats and DoorDash continue to drive demand. Disposable packaging ensures hygiene, portability, and convenience, making it indispensable for quick-service restaurants, cafes, and supermarkets.
Healthcare is another critical end-use sector, with disposable packaging used extensively for medicines, diagnostic kits, and sterile instruments. Personal care and cosmetics rely on sachets, bottles, and wipes for portability and consumer convenience. Industrial applications include protective packaging for components, chemicals, and spare parts. Other sectors such as hospitality, education, and events also contribute to demand, particularly for single-use items that support hygiene and efficiency.
Regional Analysis
North America led the global market with a 35.6% share in 2024, valued at USD 13.96 billion, and continues to hold a strong position in 2025. The region’s dominance is supported by high consumption of packaged food, widespread adoption of food delivery services, and strong healthcare demand. Quick-service restaurants and supermarkets remain major contributors, while regulatory pressure is accelerating the shift toward recyclable and biodegradable packaging.
Europe follows closely, driven by stringent sustainability regulations and consumer preference for eco-friendly packaging. The European Union’s circular economy policies are pushing companies to redesign packaging systems and adopt recyclable materials. Asia Pacific is the fastest-growing region, supported by rapid e-commerce expansion in China, India, and Southeast Asia. Latin America and the Middle East & Africa are emerging markets, where rising urban populations and expanding retail networks are creating new opportunities for disposable packaging adoption.
This segmentation highlights a market in transition, where cost efficiency and convenience continue to drive demand, but sustainability and regulatory compliance are increasingly shaping investment priorities.
By Material Type (Plastic, Paper & Paperboard, Aluminum, Glass, Others), By Packaging Type (Rigid Packaging, Flexible Packaging), By Product Type (Trays, Containers, Cups & Lids, Bottles, Pouches & Sachets, Wraps & Films, Others), By End-Use Industry (Food & Beverage, Healthcare, Personal Care & Cosmetics, Industrial, Others)
Research Methodology
Primary Research- 100 Interviews of Stakeholders
Secondary Research
Desk Research
Regional scope
North America (United States, Canada, Mexico)
Latin America (Brazil, Argentina, Columbia)
East Asia And Pacific (China, Japan, South Korea, Australia, Cambodia, Fiji, Indonesia)
Sea And South Asia (India, Singapore, Thailand, Taiwan, Malaysia)
Eastern Europe (Poland, Russia, Czech Republic, Romania)
Western Europe (Germany, U.K., France, Spain, Itlay)
Middle East & Africa (GCC Countries, Egypt, Nigeria, South Africa, Israel)
Competitive Landscape
Constantia Flexibles Group GmbH, WestRock Company, Novolex Holdings, Inc., Amcor plc, Huhtamaki Oyj, Sealed Air Corporation, Printpack, Inc., Reynolds Group Holdings Limited, Tetra Pak International S.A., Berry Global Inc., Sonoco Products Company, Mondi Group, Bemis Company, Inc. (now part of Amcor)
Customization Scope
Customization for segments, region/country-level will be provided. Moreover, additional customization can be done based on the requirements.
Pricing and Purchase Options
Avail customized purchase options to meet your exact research needs. We have three licenses to opt for: Single User License, Multi-User License (Up to 5 Users), Corporate Use License (Unlimited User and Printable PDF).
TABLE OF CONTENTS
1. EXECUTIVE SUMMARY
1.1. MARKET SNAPSHOT
1.2. KEY FINDINGS & INSIGHTS
1.3. ANALYST RECOMMENDATIONS
1.4. FUTURE OUTLOOK
2. RESEARCH METHODOLOGY
2.1. MARKET DEFINITION & SCOPE
2.2. RESEARCH OBJECTIVES: PRIMARY & SECONDARY DATA SOURCES
2.3. DATA COLLECTION SOURCES
2.3.1. COVERAGE OF 100+ PRIMARY RESEARCH/CONSULTATION CALLS WITH INDUSTRY STAKEHOLDERS
FIGURE 17 NORTH AMERICA DISPOSABLES PACKAGING CURRENT AND FUTURE TYPE ANALYSIS, 2025–2034, (USD MILLION)
FIGURE 18 NORTH AMERICA DISPOSABLES PACKAGING CURRENT AND FUTURE END USER ANALYSIS, 2025–2034, (USD MILLION)
FIGURE 19 MARKET SHARE BY COUNTRY
FIGURE 20 LATIN AMERICA DISPOSABLES PACKAGING CURRENT AND FUTURE TYPE ANALYSIS, 2025–2034, (USD MILLION)
FIGURE 21 LATIN AMERICA DISPOSABLES PACKAGING CURRENT AND FUTURE END USER ANALYSIS, 2025–2034, (USD MILLION)
FIGURE 22 MARKET SHARE BY COUNTRY
FIGURE 23 EASTERN EUROPE DISPOSABLES PACKAGING CURRENT AND FUTURE TYPE ANALYSIS, 2025–2034, (USD MILLION)
FIGURE 24 EASTERN EUROPE DISPOSABLES PACKAGING CURRENT AND FUTURE END USER ANALYSIS, 2025–2034, (USD MILLION)
FIGURE 25 MARKET SHARE BY COUNTRY
FIGURE 26 WESTERN EUROPE DISPOSABLES PACKAGING CURRENT AND FUTURE TYPE ANALYSIS, 2025–2034, (USD MILLION)
FIGURE 27 WESTERN EUROPE DISPOSABLES PACKAGING CURRENT AND FUTURE END USER ANALYSIS, 2025–2034, (USD MILLION)
FIGURE 28 MARKET SHARE BY COUNTRY
FIGURE 29 EAST ASIA AND PACIFIC DISPOSABLES PACKAGING CURRENT AND FUTURE TYPE ANALYSIS, 2025–2034, (USD MILLION)
FIGURE 30 EAST ASIA AND PACIFIC DISPOSABLES PACKAGING CURRENT AND FUTURE END USER ANALYSIS, 2025–2034, (USD MILLION)
FIGURE 31 MARKET SHARE BY COUNTRY
FIGURE 32 SEA AND SOUTH ASIA DISPOSABLES PACKAGING CURRENT AND FUTURE TYPE ANALYSIS, 2025–2034, (USD MILLION)
FIGURE 33 SEA AND SOUTH ASIA DISPOSABLES PACKAGING CURRENT AND FUTURE END USER ANALYSIS, 2025–2034, (USD MILLION)
FIGURE 34 MARKET SHARE BY COUNTRY
FIGURE 35 MIDDLE EAST AND AFRICA DISPOSABLES PACKAGING CURRENT AND FUTURE TYPE ANALYSIS, 2025–2034, (USD MILLION)
FIGURE 36 MIDDLE EAST AND AFRICA DISPOSABLES PACKAGING CURRENT AND FUTURE END USER ANALYSIS, 2025–2034, (USD MILLION)
FIGURE 37 NORTH AMERICA DISPOSABLES PACKAGING CURRENT AND FUTURE MARKET VOLUME SHARE REGIONAL ANALYSIS, 2025–2034, (USD MILLION)
FIGURE 38 U.S. DISPOSABLES PACKAGING CURRENT AND FUTURE TYPE ANALYSIS, 2025–2034, (USD MILLION)
FIGURE 39 U.S. DISPOSABLES PACKAGING CURRENT AND FUTURE END USER ANALYSIS, 2025–2034, (USD MILLION)
FIGURE 40 CANADA DISPOSABLES PACKAGING CURRENT AND FUTURE TYPE ANALYSIS, 2025–2034, (USD MILLION)
FIGURE 41 CANADA DISPOSABLES PACKAGING CURRENT AND FUTURE END USER ANALYSIS, 2025–2034, (USD MILLION)
FIGURE 42 LATIN AMERICA DISPOSABLES PACKAGING CURRENT AND FUTURE MARKET VOLUME SHARE REGIONAL ANALYSIS, 2025–2034, (USD MILLION)
FIGURE 43 MEXICO DISPOSABLES PACKAGING CURRENT AND FUTURE TYPE ANALYSIS, 2025–2034, (USD MILLION)
FIGURE 44 MEXICO DISPOSABLES PACKAGING CURRENT AND FUTURE END USER ANALYSIS, 2025–2034, (USD MILLION)
FIGURE 45 BRAZIL DISPOSABLES PACKAGING CURRENT AND FUTURE TYPE ANALYSIS, 2025–2034, (USD MILLION)
FIGURE 46 BRAZIL DISPOSABLES PACKAGING CURRENT AND FUTURE END USER ANALYSIS, 2025–2034, (USD MILLION)
FIGURE 47 ARGENTINA DISPOSABLES PACKAGING CURRENT AND FUTURE TYPE ANALYSIS, 2025–2034, (USD MILLION)
FIGURE 48 ARGENTINA DISPOSABLES PACKAGING CURRENT AND FUTURE END USER ANALYSIS, 2025–2034, (USD MILLION)
FIGURE 49 COLUMBIA DISPOSABLES PACKAGING CURRENT AND FUTURE TYPE ANALYSIS, 2025–2034, (USD MILLION)
FIGURE 50 COLUMBIA DISPOSABLES PACKAGING CURRENT AND FUTURE END USER ANALYSIS, 2025–2034, (USD MILLION)
FIGURE 51 REST OF LATIN AMERICA DISPOSABLES PACKAGING CURRENT AND FUTURE TYPE ANALYSIS, 2025–2034, (USD MILLION)
FIGURE 52 REST OF LATIN AMERICA DISPOSABLES PACKAGING CURRENT AND FUTURE END USER ANALYSIS, 2025–2034, (USD MILLION)
FIGURE 53 EASTERN EUROPE DISPOSABLES PACKAGING CURRENT AND FUTURE MARKET VOLUME SHARE REGIONAL ANALYSIS, 2025–2034, (USD MILLION)
FIGURE 54 POLAND DISPOSABLES PACKAGING CURRENT AND FUTURE TYPE ANALYSIS, 2025–2034, (USD MILLION)
FIGURE 55 POLAND DISPOSABLES PACKAGING CURRENT AND FUTURE END USER ANALYSIS, 2025–2034, (USD MILLION)
FIGURE 56 RUSSIA DISPOSABLES PACKAGING CURRENT AND FUTURE TYPE ANALYSIS, 2025–2034, (USD MILLION)
FIGURE 57 RUSSIA DISPOSABLES PACKAGING CURRENT AND FUTURE END USER ANALYSIS, 2025–2034, (USD MILLION)
FIGURE 58 CZECH REPUBLIC DISPOSABLES PACKAGING CURRENT AND FUTURE TYPE ANALYSIS, 2025–2034, (USD MILLION)
FIGURE 59 CZECH REPUBLIC DISPOSABLES PACKAGING CURRENT AND FUTURE END USER ANALYSIS, 2025–2034, (USD MILLION)
FIGURE 60 ROMANIA DISPOSABLES PACKAGING CURRENT AND FUTURE TYPE ANALYSIS, 2025–2034, (USD MILLION)
FIGURE 61 ROMANIA DISPOSABLES PACKAGING CURRENT AND FUTURE END USER ANALYSIS, 2025–2034, (USD MILLION)
FIGURE 62 REST OF EASTERN EUROPE DISPOSABLES PACKAGING CURRENT AND FUTURE TYPE ANALYSIS, 2025–2034, (USD MILLION)
FIGURE 63 REST OF EASTERN EUROPE DISPOSABLES PACKAGING CURRENT AND FUTURE END USER ANALYSIS, 2025–2034, (USD MILLION)
FIGURE 64 WESTERN EUROPE DISPOSABLES PACKAGING CURRENT AND FUTURE MARKET VOLUME SHARE REGIONAL ANALYSIS, 2025–2034, (USD MILLION)
FIGURE 65 GERMANY DISPOSABLES PACKAGING CURRENT AND FUTURE TYPE ANALYSIS, 2025–2034, (USD MILLION)
FIGURE 66 GERMANY DISPOSABLES PACKAGING CURRENT AND FUTURE END USER ANALYSIS, 2025–2034, (USD MILLION)
FIGURE 67 FRANCE DISPOSABLES PACKAGING CURRENT AND FUTURE TYPE ANALYSIS, 2025–2034, (USD MILLION)
FIGURE 68 FRANCE DISPOSABLES PACKAGING CURRENT AND FUTURE END USER ANALYSIS, 2025–2034, (USD MILLION)
FIGURE 69 UK DISPOSABLES PACKAGING CURRENT AND FUTURE TYPE ANALYSIS, 2025–2034, (USD MILLION)
FIGURE 70 UK DISPOSABLES PACKAGING CURRENT AND FUTURE END USER ANALYSIS, 2025–2034, (USD MILLION)
FIGURE 71 SPAIN DISPOSABLES PACKAGING CURRENT AND FUTURE TYPE ANALYSIS, 2025–2034, (USD MILLION)
FIGURE 72 SPAIN DISPOSABLES PACKAGING CURRENT AND FUTURE END USER ANALYSIS, 2025–2034, (USD MILLION)
FIGURE 73 ITALY DISPOSABLES PACKAGING CURRENT AND FUTURE TYPE ANALYSIS, 2025–2034, (USD MILLION)
FIGURE 74 ITALY DISPOSABLES PACKAGING CURRENT AND FUTURE END USER ANALYSIS, 2025–2034, (USD MILLION)
FIGURE 75 REST OF WESTERN EUROPE DISPOSABLES PACKAGING CURRENT AND FUTURE TYPE ANALYSIS, 2025–2034, (USD MILLION)
FIGURE 76 REST OF WESTERN EUROPE DISPOSABLES PACKAGING CURRENT AND FUTURE END USER ANALYSIS, 2025–2034, (USD MILLION)
FIGURE 77 EAST ASIA AND PACIFIC DISPOSABLES PACKAGING CURRENT AND FUTURE MARKET VOLUME SHARE REGIONAL ANALYSIS, 2025–2034, (USD MILLION)
FIGURE 78 CHINA DISPOSABLES PACKAGING CURRENT AND FUTURE TYPE ANALYSIS, 2025–2034, (USD MILLION)
FIGURE 79 CHINA DISPOSABLES PACKAGING CURRENT AND FUTURE END USER ANALYSIS, 2025–2034, (USD MILLION)
FIGURE 80 JAPAN DISPOSABLES PACKAGING CURRENT AND FUTURE TYPE ANALYSIS, 2025–2034, (USD MILLION)
FIGURE 81 JAPAN DISPOSABLES PACKAGING CURRENT AND FUTURE END USER ANALYSIS, 2025–2034, (USD MILLION)
FIGURE 82 AUSTRALIA DISPOSABLES PACKAGING CURRENT AND FUTURE TYPE ANALYSIS, 2025–2034, (USD MILLION)
FIGURE 83 AUSTRALIA DISPOSABLES PACKAGING CURRENT AND FUTURE END USER ANALYSIS, 2025–2034, (USD MILLION)
FIGURE 84 CAMBODIA DISPOSABLES PACKAGING CURRENT AND FUTURE TYPE ANALYSIS, 2025–2034, (USD MILLION)
FIGURE 85 CAMBODIA DISPOSABLES PACKAGING CURRENT AND FUTURE END USER ANALYSIS, 2025–2034, (USD MILLION)
FIGURE 86 FIJI DISPOSABLES PACKAGING CURRENT AND FUTURE TYPE ANALYSIS, 2025–2034, (USD MILLION)
FIGURE 87 FIJI DISPOSABLES PACKAGING CURRENT AND FUTURE END USER ANALYSIS, 2025–2034, (USD MILLION)
FIGURE 88 INDONESIA DISPOSABLES PACKAGING CURRENT AND FUTURE TYPE ANALYSIS, 2025–2034, (USD MILLION)
FIGURE 89 INDONESIA DISPOSABLES PACKAGING CURRENT AND FUTURE END USER ANALYSIS, 2025–2034, (USD MILLION)
FIGURE 90 SOUTH KOREA DISPOSABLES PACKAGING CURRENT AND FUTURE TYPE ANALYSIS, 2025–2034, (USD MILLION)
FIGURE 91 SOUTH KOREA DISPOSABLES PACKAGING CURRENT AND FUTURE END USER ANALYSIS, 2025–2034, (USD MILLION)
FIGURE 92 REST OF EAST ASIA AND PACIFIC DISPOSABLES PACKAGING CURRENT AND FUTURE TYPE ANALYSIS, 2025–2034, (USD MILLION)
FIGURE 93 REST OF EAST ASIA AND PACIFIC DISPOSABLES PACKAGING CURRENT AND FUTURE END USER ANALYSIS, 2025–2034, (USD MILLION)
FIGURE 94 SEA AND SOUTH ASIA DISPOSABLES PACKAGING CURRENT AND FUTURE MARKET VOLUME SHARE REGIONAL ANALYSIS, 2025–2034, (USD MILLION)
FIGURE 95 BANGLADESH DISPOSABLES PACKAGING CURRENT AND FUTURE TYPE ANALYSIS, 2025–2034, (USD MILLION)
FIGURE 96 BANGLADESH DISPOSABLES PACKAGING CURRENT AND FUTURE END USER ANALYSIS, 2025–2034, (USD MILLION)
FIGURE 97 NEW ZEALAND DISPOSABLES PACKAGING CURRENT AND FUTURE TYPE ANALYSIS, 2025–2034, (USD MILLION)
FIGURE 98 NEW ZEALAND DISPOSABLES PACKAGING CURRENT AND FUTURE END USER ANALYSIS, 2025–2034, (USD MILLION)
FIGURE 99 INDIA DISPOSABLES PACKAGING CURRENT AND FUTURE TYPE ANALYSIS, 2025–2034, (USD MILLION)
FIGURE 100 INDIA DISPOSABLES PACKAGING CURRENT AND FUTURE END USER ANALYSIS, 2025–2034, (USD MILLION)
FIGURE 101 SINGAPORE DISPOSABLES PACKAGING CURRENT AND FUTURE TYPE ANALYSIS, 2025–2034, (USD MILLION)
FIGURE 102 SINGAPORE DISPOSABLES PACKAGING CURRENT AND FUTURE END USER ANALYSIS, 2025–2034, (USD MILLION)
FIGURE 103 THAILAND DISPOSABLES PACKAGING CURRENT AND FUTURE TYPE ANALYSIS, 2025–2034, (USD MILLION)
FIGURE 104 THAILAND DISPOSABLES PACKAGING CURRENT AND FUTURE END USER ANALYSIS, 2025–2034, (USD MILLION)
FIGURE 105 TAIWAN DISPOSABLES PACKAGING CURRENT AND FUTURE TYPE ANALYSIS, 2025–2034, (USD MILLION)
FIGURE 106 TAIWAN DISPOSABLES PACKAGING CURRENT AND FUTURE END USER ANALYSIS, 2025–2034, (USD MILLION)
FIGURE 107 MALAYSIA DISPOSABLES PACKAGING CURRENT AND FUTURE TYPE ANALYSIS, 2025–2034, (USD MILLION)
FIGURE 108 MALAYSIA DISPOSABLES PACKAGING CURRENT AND FUTURE END USER ANALYSIS, 2025–2034, (USD MILLION)
FIGURE 109 REST OF SEA AND SOUTH ASIA DISPOSABLES PACKAGING CURRENT AND FUTURE TYPE ANALYSIS, 2025–2034, (USD MILLION)
FIGURE 110 REST OF SEA AND SOUTH ASIA DISPOSABLES PACKAGING CURRENT AND FUTURE END USER ANALYSIS, 2025–2034, (USD MILLION)
FIGURE 111 MIDDLE EAST AND AFRICA DISPOSABLES PACKAGING CURRENT AND FUTURE MARKET VOLUME SHARE REGIONAL ANALYSIS, 2025–2034, (USD MILLION)
FIGURE 112 GCC COUNTRIES DISPOSABLES PACKAGING CURRENT AND FUTURE TYPE ANALYSIS, 2025–2034, (USD MILLION)
FIGURE 113 GCC COUNTRIES DISPOSABLES PACKAGING CURRENT AND FUTURE END USER ANALYSIS, 2025–2034, (USD MILLION)
FIGURE 114 SAUDI ARABIA DISPOSABLES PACKAGING CURRENT AND FUTURE TYPE ANALYSIS, 2025–2034, (USD MILLION)
FIGURE 115 SAUDI ARABIA DISPOSABLES PACKAGING CURRENT AND FUTURE END USER ANALYSIS, 2025–2034, (USD MILLION)
FIGURE 116 UAE DISPOSABLES PACKAGING CURRENT AND FUTURE TYPE ANALYSIS, 2025–2034, (USD MILLION)
FIGURE 117 UAE DISPOSABLES PACKAGING CURRENT AND FUTURE END USER ANALYSIS, 2025–2034, (USD MILLION)
FIGURE 118 BAHRAIN DISPOSABLES PACKAGING CURRENT AND FUTURE TYPE ANALYSIS, 2025–2034, (USD MILLION)
FIGURE 119 BAHRAIN DISPOSABLES PACKAGING CURRENT AND FUTURE END USER ANALYSIS, 2025–2034, (USD MILLION)
FIGURE 120 KUWAIT DISPOSABLES PACKAGING CURRENT AND FUTURE TYPE ANALYSIS, 2025–2034, (USD MILLION)
FIGURE 121 KUWAIT DISPOSABLES PACKAGING CURRENT AND FUTURE END USER ANALYSIS, 2025–2034, (USD MILLION)
FIGURE 122 OMAN DISPOSABLES PACKAGING CURRENT AND FUTURE TYPE ANALYSIS, 2025–2034, (USD MILLION)
FIGURE 123 OMAN DISPOSABLES PACKAGING CURRENT AND FUTURE END USER ANALYSIS, 2025–2034, (USD MILLION)
FIGURE 124 QATAR DISPOSABLES PACKAGING CURRENT AND FUTURE TYPE ANALYSIS, 2025–2034, (USD MILLION)
FIGURE 125 QATAR DISPOSABLES PACKAGING CURRENT AND FUTURE END USER ANALYSIS, 2025–2034, (USD MILLION)
FIGURE 126 EGYPT DISPOSABLES PACKAGING CURRENT AND FUTURE TYPE ANALYSIS, 2025–2034, (USD MILLION)
FIGURE 127 EGYPT DISPOSABLES PACKAGING CURRENT AND FUTURE END USER ANALYSIS, 2025–2034, (USD MILLION)
FIGURE 128 NIGERIA DISPOSABLES PACKAGING CURRENT AND FUTURE TYPE ANALYSIS, 2025–2034, (USD MILLION)
FIGURE 129 NIGERIA DISPOSABLES PACKAGING CURRENT AND FUTURE END USER ANALYSIS, 2025–2034, (USD MILLION)
FIGURE 130 SOUTH AFRICA DISPOSABLES PACKAGING CURRENT AND FUTURE TYPE ANALYSIS, 2025–2034, (USD MILLION)
FIGURE 131 SOUTH AFRICA DISPOSABLES PACKAGING CURRENT AND FUTURE END USER ANALYSIS, 2025–2034, (USD MILLION)
FIGURE 132 ISRAEL DISPOSABLES PACKAGING CURRENT AND FUTURE TYPE ANALYSIS, 2025–2034, (USD MILLION)
FIGURE 133 ISRAEL DISPOSABLES PACKAGING CURRENT AND FUTURE END USER ANALYSIS, 2025–2034, (USD MILLION)
FIGURE 134 REST OF MEA DISPOSABLES PACKAGING CURRENT AND FUTURE TYPE ANALYSIS, 2025–2034, (USD MILLION)
FIGURE 135 REST OF MEA DISPOSABLES PACKAGING CURRENT AND FUTURE END USER ANALYSIS, 2025–2034, (USD MILLION)
FIGURE 136 U. S. MARKET SHARE ANALYSIS BY TYPE (2024)
FIGURE 137 U. S. MARKET SHARE ANALYSIS BY END USER (2024)
FIGURE 138 CANADA MARKET SHARE ANALYSIS BY TYPE (2024)
FIGURE 139 CANADA MARKET SHARE ANALYSIS BY END USER (2024)
FIGURE 140 MEXICO MARKET SHARE ANALYSIS BY TYPE (2024)
FIGURE 141 MEXICO MARKET SHARE ANALYSIS BY END USER (2024)
FIGURE 142 CHINA MARKET SHARE ANALYSIS BY TYPE (2024)
FIGURE 143 CHINA MARKET SHARE ANALYSIS BY END USER (2024)
FIGURE 144 JAPAN MARKET SHARE ANALYSIS BY TYPE (2024)
FIGURE 145 JAPAN MARKET SHARE ANALYSIS BY END USER (2024)
FIGURE 146 INDIA MARKET SHARE ANALYSIS BY TYPE (2024)
FIGURE 147 INDIA MARKET SHARE ANALYSIS BY END USER (2024)
FIGURE 148 SOUTH KOREA MARKET SHARE ANALYSIS BY TYPE (2024)
FIGURE 149 SOUTH KOREA MARKET SHARE ANALYSIS BY END USER (2024)
FIGURE 150 SAUDI ARABIA MARKET SHARE ANALYSIS BY TYPE (2024)
FIGURE 151 SAUDI ARABIA MARKET SHARE ANALYSIS BY END USER (2024)
FIGURE 152 UAE MARKET SHARE ANALYSIS BY TYPE (2024)
FIGURE 153 UAE MARKET SHARE ANALYSIS BY END USER (2024)
FIGURE 154 EGYPT MARKET SHARE ANALYSIS BY TYPE (2024)
FIGURE 155 EGYPT MARKET SHARE ANALYSIS BY END USER (2024)
FIGURE 156 NIGERIA MARKET SHARE ANALYSIS BY TYPE (2024)
FIGURE 157 NIGERIA MARKET SHARE ANALYSIS BY END USER (2024)
FIGURE 158 SOUTH AFRICA MARKET SHARE ANALYSIS BY TYPE (2024)
FIGURE 159 SOUTH AFRICA MARKET SHARE ANALYSIS BY END USER (2024)
FIGURE 160 GERMANY MARKET SHARE ANALYSIS BY TYPE (2024)
FIGURE 161 GERMANY MARKET SHARE ANALYSIS BY END USER (2024)
FIGURE 162 FRANCE MARKET SHARE ANALYSIS BY TYPE (2024)
FIGURE 163 FRANCE MARKET SHARE ANALYSIS BY END USER (2024)
FIGURE 164 UK MARKET SHARE ANALYSIS BY TYPE (2024)
FIGURE 165 UK MARKET SHARE ANALYSIS BY END USER (2024)
FIGURE 166 SPAIN MARKET SHARE ANALYSIS BY TYPE (2024)
FIGURE 167 SPAIN MARKET SHARE ANALYSIS BY END USER (2024)
FIGURE 168 ITALY MARKET SHARE ANALYSIS BY TYPE (2024)
FIGURE 169 ITALY MARKET SHARE ANALYSIS BY END USER (2024)
FIGURE 170 BRAZIL MARKET SHARE ANALYSIS BY TYPE (2024)
FIGURE 171 BRAZIL MARKET SHARE ANALYSIS BY END USER (2024)
FIGURE 172 ARGENTINA MARKET SHARE ANALYSIS BY TYPE (2024)
FIGURE 173 ARGENTINA MARKET SHARE ANALYSIS BY END USER (2024)
FIGURE 174 COLUMBIA MARKET SHARE ANALYSIS BY TYPE (2024)
FIGURE 175 COLUMBIA MARKET SHARE ANALYSIS BY END USER (2024)
FIGURE 176 GLOBAL DISPOSABLES PACKAGING CURRENT AND FUTURE MARKET KEY COUNTRY LEVEL ANALYSIS, 2024–2034, (USD MILLION)
FIGURE 177 FINANCIAL OVERVIEW:
Key Player Analysis
Huhtamaki Oyj: Huhtamaki anchors foodservice and consumer packaging with paper cups, lids, molded fiber, and flexible solutions, supported by global manufacturing and a sustainability-first portfolio. In 2025, the company continues to expand fiber-based and recyclable formats, backed by steady investor communications and reporting cadence that signal operational discipline and margin focus. Strategic priorities include capacity additions in molded fiber, partnerships with QSRs for compostable products, and design-for-recyclability across flexible lines. Differentiators include scale in fiber packaging, EU alignment on circularity, and strong customer penetration in North America and Europe.
Reynolds Group Holdings Limited: Reynolds holds share in disposable foodservice packaging with aluminum trays, foil, paper, and plastic foodservice lines across retail and institutional buyers. The company targets growth in private label and cost-focused formats that fit high-volume food delivery and supermarket prepared foods. In 2025, Reynolds emphasizes product robustness and supply dependability in the face of e-commerce logistics needs, with market commentary placing it among key vendors in the booming disposable food packaging segment. Differentiation rests on procurement efficiency, shelf presence in North America, and breadth across aluminum and paper substrates.
Constantia Flexibles Group GmbH: Constantia is a major flexible packaging manufacturer serving consumer and pharmaceutical markets, with pouches, blister, strip packs, and barrier films central to the portfolio. In 2025, the company advances mono-material and recyclable laminates for EU compliance and pharma-grade barriers for sterility and shelf life. Strategic moves include targeted capex in high-barrier lines, customer co-development on recyclability claims, and qualification programs aligned with Europe’s 2025–2030 circular frameworks. Its differentiators are pharma certifications, high-barrier expertise, and a stronger footprint in Europe, which positions it well for regulated demand.
Novolex Holdings, Inc.: Novolex spans paper and plastic solutions with carryout bags, foodservice containers, and films, strengthened by U.S. manufacturing and in-house recycling operations. In 2025, the company highlights bags with up to 100 percent recycled content and film reclamation at two centers, aligning with retail and foodservice ESG goals. Market notes point to recent portfolio expansion and strategy centered on sustainable materials and customer service levels. Differentiators include vertical recycling capability, wide distribution in North America, and institutional relationships in foodservice. Integration of digital insights into merchandising and delivery packaging supports resilience as food delivery and office-return trends lift on-the-go consumption.
MarketKey Players
Constantia Flexibles Group GmbH
WestRock Company
Novolex Holdings, Inc.
Amcor plc
Huhtamaki Oyj
Sealed Air Corporation
Printpack, Inc.
Reynolds Group Holdings Limited
Tetra Pak International S.A.
Berry Global Inc.
Sonoco Products Company
Mondi Group
Bemis Company, Inc. (now part of Amcor)
Driver:
Expansion of Food Delivery and E-commerce Consumption
By 2025, the disposable packaging market is growing alongside the rapid rise of food delivery and e-commerce services. Global online food delivery revenues are expected to exceed USD 500 billion by 2026. This growth creates ongoing demand for trays, cups, wraps, and containers that provide hygiene, portability, and convenience. Packaging formats that are leak-proof, stackable, and heat-resistant have become standard for delivery platforms and quick-service restaurants. This trend reinforces the high volume use of single-use solutions.
Rising Healthcare and Safety-Driven Packaging Needs
At the same time, healthcare services are boosting demand significantly. Hospitals, clinics, and pharmaceutical manufacturers rely on sterile, single-use packaging for medicines, syringes, and surgical tools to meet infection-control standards. Packaging that prevents tampering and is child-resistant is now required for pharmaceuticals, baby food, and household chemicals. This positions disposable packaging as essential for safety, compliance, and modern healthcare.
Restraint:
Regulatory Pressure on Single-Use Materials
Despite strong demand, environmental regulations are a major challenge. Governments in North America, Europe, and Asia Pacific are tightening rules on single-use plastics. This forces manufacturers to move quickly toward biodegradable and recyclable options. Meeting bans, fees, and extended producer responsibility (EPR) rules is increasing operational complexity and costs.
Cost Volatility and Changing Consumer Preferences
Fluctuating raw material prices are putting pressure on profit margins. Prices for plastic resins and paper pulp have varied by more than 15% in recent cycles. At the same time, urban consumers increasingly prefer reusable and refillable packaging, especially in premium retail and foodservice. Poor recycling infrastructure in many areas adds to public concern, increasing pressure from regulators and consumers.
Opportunity:
Growth in Sustainable and Biodegradable Packaging
The best growth prospects are in sustainable materials. Biodegradable and compostable packaging made from cornstarch, sugarcane, bamboo, and molded fiber is gaining popularity. This segment is expected to grow at a rate above 8% annually through 2030. Paper-based alternatives are rapidly increasing in fast-food chains, healthcare packaging, and retail, backed by supportive regulations and brand sustainability goals.
Emergence of Smart and Value-Added Packaging
Smart disposable packaging is becoming a key differentiator. Features like QR codes, freshness indicators, and temperature sensors are increasingly found in single-use formats. These enhancements improve transparency and build consumer trust. They also allow for brand engagement, traceability, and anti-counterfeiting. This creates new revenue opportunities and makes innovation-focused suppliers attractive investment targets.
Trend:
Shift Toward Minimalist and Circular Packaging Designs
In 2025, the market is moving toward simpler and more eco-friendly designs. Minimalist packaging that reduces material use is becoming popular with global brands for its cost efficiency and regulatory compliance. Monomaterial packaging formats are also growing quickly as they simplify recycling and support circular economy goals.
Integration of Digital and Interactive Features
Digital features are increasingly part of disposable packaging. QR codes and NFC tags enable consumers to verify product origins, track freshness, and access promotions using their mobile devices. Alongside the early commercial use of edible and plant-based packaging, these trends are changing how we see disposable packaging. It is not just a protective solution; it is also a strategic tool for sustainability, compliance, and consumer involvement.
Recent Developments
Dec 2024 – Berry Global: The company announced it would showcase its latest circular packaging advancements for the healthcare sector at Pharmapack 2025. This move signals a strategic focus on providing sustainable and compliant solutions for the high-value pharmaceutical industry.
Feb 2025 – Berry Global and Printpack: The two companies announced a collaboration to create a new sustainable flexible package. The solution incorporates Berry's Entour™ sealant film technology, combining expertise to advance the market availability of widely recyclable film-based packaging.
Apr 2025 – Novolex: The company’s new BPI-certified compostable butter wrap earned the 2025 Gold Award for Sustainability from the Flexible Packaging Association. This industry award reinforces the company's position in specialized compostable materials, supported by a reported 6% annual revenue growth from its portfolio of recyclable, compostable, or reusable products.
Jul 2025 – Huhtamaki: A new line of ice cream cups that are both recyclable and compostable was launched, featuring a bio-based coating that reduces plastic content to below 10%. This product launch directly addresses mounting consumer and regulatory pressure to decrease fossil-fuel-based materials in single-use food packaging.
Oct 2025 – Amcor: The company introduced AmSecure, a recyclable APET-based material for healthcare packaging, presenting a cost-effective alternative to the commonly used PETG. This material innovation provides pharmaceutical clients with a more sustainable packaging option that maintains performance standards, strengthening Amcor's eco-friendly HealthCare portfolio.