Global Drug-Induced Cardiotoxicity Market Size, Share & Clinical Research Analysis By Drug Class, By Diagnostic Method, By Indication (Oncology, Autoimmune, Infectious Diseases), By End User, Regulatory Landscape, R&D Trends & Forecast 2025–2034
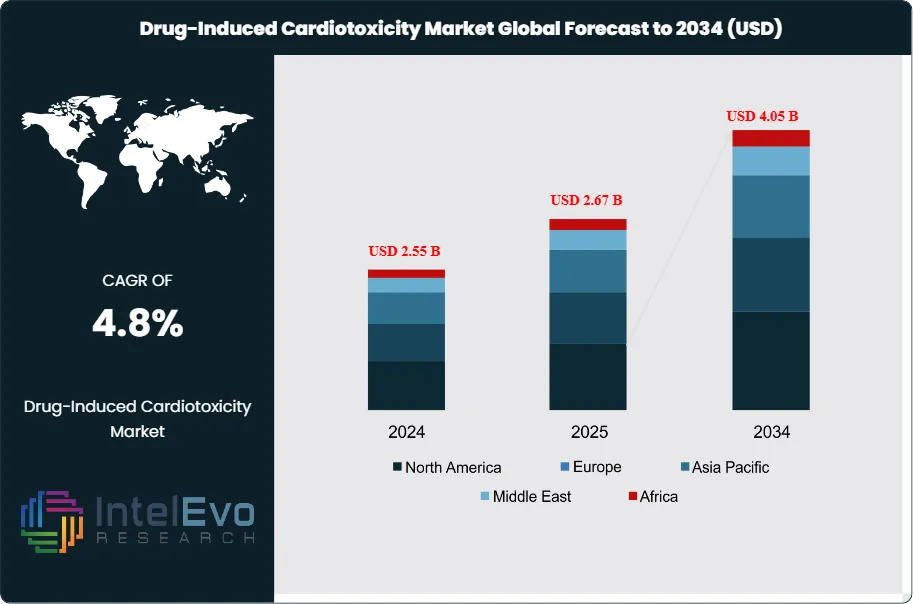
The Drug-Induced Cardiotoxicity Market is estimated at USD 2.55 billion in 2024 and is projected to reach approximately USD 4.05 billion by 2034, registering a CAGR of about 4.8% during 2025–2034. Market growth is driven by the rising use of oncology, immunotherapy, and targeted small-molecule drugs with known cardiovascular risk profiles, alongside stricter cardiac safety monitoring requirements in clinical development. Increasing adoption of early-stage cardiotoxicity screening, biomarker-based risk assessment, and advanced imaging is improving patient outcomes and reducing late-stage drug attrition. In parallel, closer collaboration between pharma sponsors, CROs, and cardio-oncology specialists is positioning cardiotoxicity evaluation as a standard component of modern drug development pipelines.
Demand reflects a larger oncology and specialty-drug pipeline, an aging patient base, and tighter safety expectations across regulators and payers. Historical recalls and label changes tied to QT prolongation, left ventricular dysfunction, and arrhythmias have kept cardiovascular safety at the center of clinical risk. Reported cardiotoxicity rates in breast cancer chemotherapy cohorts range from 6% to 28%. Chemotherapy exposure raises cardiovascular event incidence by about 30%. Cardiac adverse events remain a frequent cause of late-stage attrition and account for a meaningful share of post-market actions.
Growth will track earlier detection, safer regimens, and better risk stratification. You see broader uptake of structured cardiac monitoring in oncology protocols, with routine echocardiography, global longitudinal strain, and biomarker panels such as troponin and NT-proBNP. FDA and EMA require cardiovascular assessments from preclinical through Phase III under ICH E14 and S7B guidance; sponsors face higher evidence bars for HER2 therapies, anthracyclines, TKIs, and some antidepressants. Risks remain. Multi-drug regimens amplify exposure. Real-world polypharmacy can unmask QT liabilities. Cost and workflow burden constrain universal surveillance in lower-resource settings. Still, clinical practice is moving to standardized cardio-oncology pathways that link oncology, cardiology, and pharmacovigilance teams.
Technology is reshaping screening and prediction. iPSC-derived cardiomyocytes, organ-on-chip models, and automated patch-clamp platforms shift detection earlier and reduce false negatives. High-content imaging and machine learning models improve hazard classification from in vitro signals to in vivo risk. AI-enabled ECG analytics and predictive algorithms flag at-risk patients before symptomatic decline. Digital endpoints and remote monitoring shorten feedback loops between dose changes and cardiac response. These tools cut late failures and support safer label claims when paired with prospective validation.
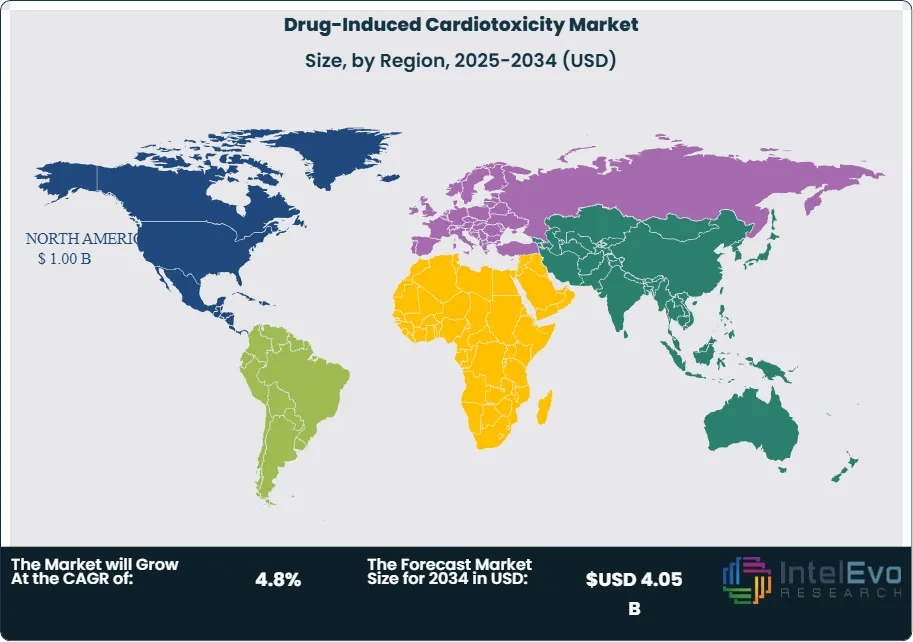
Regionally, North America leads on funding, trial density, and cardio-oncology networks. The NIH committed sizable grants to biomarker discovery and AI methods, reinforcing the U.S. evidence base. Europe benefits from EMA guidance, strong registries, and Horizon-backed consortia focused on safety pharmacology. Asia Pacific is the fastest growing on the back of rising oncology incidence, expanding biopharma R&D in China and Japan, and investment in contract research infrastructure. Investors should watch U.S. and EU hubs for platform advances, while Asia offers scale in trials and manufacturing for translational tools and monitoring solutions.
Key Takeaways
Market Growth: The market stands at USD 2.55 billion in 2024 and is projected to reach USD 4.05 billion by 2034 at a 4.8% CAGR, supported by rising oncology exposure and structured safety monitoring in trials and care pathways. Chemotherapy cohorts report cardiotoxicity rates of 6–28%, with roughly a 30% increase in cardiovascular events, sustaining demand for earlier detection and risk management.
Type: Chemotherapy-induced cardiotoxicity leads with over 67% share in 2023, driven by broad use of anthracyclines and targeted agents that require intensive surveillance and mitigation protocols. This concentration keeps sponsors and providers focused on cardio-oncology workflows and post-market vigilance.
Detection: Biomarkers hold 53% of the detection segment as of 2023, reflecting their integration into routine monitoring and trial endpoints for earlier signal capture. Biomarker-linked solutions also account for 39% within drug class analytics, reinforcing their role in decision-making and labeling support.
Driver: Expanding cancer therapy utilization and documented cardiotoxicity prevalence are lifting screening and monitoring adoption across care settings. Biomarker-centric workflows scale fastest, anchored by majority share in detection and growing incorporation into real-world protocols.
Restraint: Adoption is uneven across regions, with North America holding 39.4% share and USD 0.55 billion in 2023, signaling access and budget constraints in emerging markets. The modest global trajectory of 4.6% CAGR underscores cost sensitivity and workflow burden for universal surveillance.
Opportunity: AI-enabled cardiotoxicity screening is expanding, with the broader screening market projected to rise from USD 3.17 billion in 2025 to about USD 8.46 billion by 2034 at 11.54% CAGR, creating pull-through for predictive tools and integrated biomarker platforms. You can align portfolios to AI-assisted ECG analytics, image-based phenotyping, and risk scoring to capture faster-growing budgets adjacent to core monitoring.
Trend: The market is shifting toward biomarker-first detection and AI augmentation across research and clinical workflows, consolidating share in laboratory and software-driven solutions. AI adoption in screening is accelerating, with long-run double-digit growth reinforcing demand for predictive models that reduce late-stage attrition and adverse event burden.
Regional Analysis: North America leads at 39.4% share with USD 0.55 billion, supported by concentrated trial activity and established cardio-oncology networks. Across the 7 major markets, cardiotoxicity-related spending is projected to grow at about 4.37% CAGR through 2035, indicating steady but disciplined investment profiles in mature regions.
Type Analysis
Chemotherapy-induced cardiotoxicity remains the largest segment. It accounted for more than 67% of market revenue in 2023 and will hold leadership through 2030 as oncology regimens expand and survivorship rises. Anthracyclines, trastuzumab, and select TKIs drive most monitoring demand, prompting routine baselines, serial echocardiography, and biomarker panels in cancer centers. You should plan for sustained protocol adoption as health systems link oncology and cardiology teams to cut dose-limiting cardiac events.
Antipsychotic drug-induced cardiotoxicity is smaller but growing. Long-term exposure to antipsychotics with QT prolongation risks, combined with rising mental health prevalence, supports steady uptake of ECG and QTc surveillance. Expect mid-single-digit growth as payers formalize baseline and follow-up testing in high-risk patients and as hospitals embed risk scores into prescribing pathways.
Detection Analysis
Biomarkers lead detection with more than 53% share. High-sensitivity troponin and NT-proBNP have become the default early-warning tools in trials and routine care due to low incremental cost and rapid turnaround. Adoption accelerates when paired with order sets and reflex testing; you can expect 6–7% annual growth as labs integrate automated reporting and clinicians lean on serial delta thresholds for decision-making.
Imaging techniques are essential for confirmation and quantification. Global longitudinal strain echocardiography improves early detection of subclinical dysfunction, while cardiac MRI with T1/T2 mapping clarifies edema and fibrosis. Health systems increasingly combine biomarkers with strain or MRI to reduce false negatives and guide therapy adjustments. Machine learning tools that assist ECG and image interpretation are entering practice, improving triage and throughput in cardio-oncology clinics.
Drug Class Analysis
Tyrosine kinase inhibitors are the most consequential drug class for monitoring demand. Class effects include hypertension, QT prolongation, and left ventricular dysfunction, which trigger protocolized surveillance across HER2, BTK, VEGF, and ALK portfolios. As TKI indications expand, you will see higher test volumes per patient and earlier intervention thresholds to maintain dose intensity.
Antibiotics and NSAIDs add measurable risk in polypharmacy. Macrolides and fluoroquinolones carry QT concerns, while NSAIDs elevate heart failure and ischemic risks in susceptible patients. Hospitals respond with stewardship, ECG gating for high-risk antibiotics, and biomarker-first pathways in acute care. Biomarkers represent about 39% within drug-class analytics, reinforcing their role in triage and longitudinal monitoring.
Regional Analysis
North America leads with roughly 39.4% share and about USD 0.55 billion in 2023, supported by strong trial density, NIH-backed research, and mature cardio-oncology networks. Reimbursement for echocardiography, strain analysis, and key biomarkers sustains high utilization across academic and integrated delivery systems. Vendors gain from clear clinical guidelines and robust data infrastructure.
Europe ranks second on the strength of EMA guidance, national registries, and Horizon-funded consortia focused on safety pharmacology. Adoption is broad in Western Europe, with Central and Eastern Europe catching up as budgets improve. Asia Pacific is the fastest-growing region as oncology incidence rises and R&D scales in China and Japan; expect high single-digit growth as leading centers standardize biomarker–imaging protocols. Latin America and the Middle East & Africa are emerging with private hospital investment and selective payer coverage, though budgets and capacity remain the main constraints.
Type Analysis (Chemotherapy-Induced Cardiotoxicity, Antipsychotic Drug-Induced Cardiotoxicity), Detection Analysis (Biomarker-Based Detection, Imaging-Based Detection), Drug Class Analysis (Tyrosine Kinase Inhibitors (TKIs), Antibiotics and NSAIDs)
Research Methodology
Primary Research- 100 Interviews of Stakeholders
Secondary Research
Desk Research
Regional scope
North America (United States, Canada, Mexico)
Latin America (Brazil, Argentina, Columbia)
East Asia And Pacific (China, Japan, South Korea, Australia, Cambodia, Fiji, Indonesia)
Sea And South Asia (India, Singapore, Thailand, Taiwan, Malaysia)
Eastern Europe (Poland, Russia, Czech Republic, Romania)
Western Europe (Germany, U.K., France, Spain, Itlay)
Middle East & Africa (GCC Countries, Egypt, Nigeria, South Africa, Israel)
Competitive Landscape
Roche Diagnostics, Abbott Laboratories, Siemens Healthineers, QuidelOrtho, GE HealthCare, Philips Healthcare, Canon Medical Systems, Bruker, IQVIA, Labcorp Drug Development, Charles River Laboratories, ICON plc, Ultromics, Caption Health
Customization Scope
Customization for segments, region/country-level will be provided. Moreover, additional customization can be done based on the requirements.
Pricing and Purchase Options
Avail customized purchase options to meet your exact research needs. We have three licenses to opt for: Single User License, Multi-User License (Up to 5 Users), Corporate Use License (Unlimited User and Printable PDF).
TABLE OF CONTENTS
1. EXECUTIVE SUMMARY
1.1. MARKET SNAPSHOT
1.2. KEY FINDINGS & INSIGHTS
1.3. ANALYST RECOMMENDATIONS
1.4. FUTURE OUTLOOK
2. RESEARCH METHODOLOGY
2.1. MARKET DEFINITION & SCOPE
2.2. RESEARCH OBJECTIVES: PRIMARY & SECONDARY DATA SOURCES
2.3. DATA COLLECTION SOURCES
2.3.1. COVERAGE OF 100+ PRIMARY RESEARCH/CONSULTATION CALLS WITH INDUSTRY STAKEHOLDERS
FIGURE 17 NORTH AMERICA DRUG-INDUCED CARDIOTOXICITY MARKET CURRENT AND FUTURE TYPE ANALYSIS, 2025–2034, (USD MILLION)
FIGURE 18 NORTH AMERICA DRUG-INDUCED CARDIOTOXICITY MARKET CURRENT AND FUTURE END USER ANALYSIS, 2025–2034, (USD MILLION)
FIGURE 19 MARKET SHARE BY COUNTRY
FIGURE 20 LATIN AMERICA DRUG-INDUCED CARDIOTOXICITY MARKET CURRENT AND FUTURE TYPE ANALYSIS, 2025–2034, (USD MILLION)
FIGURE 21 LATIN AMERICA DRUG-INDUCED CARDIOTOXICITY MARKET CURRENT AND FUTURE END USER ANALYSIS, 2025–2034, (USD MILLION)
FIGURE 22 MARKET SHARE BY COUNTRY
FIGURE 23 EASTERN EUROPE DRUG-INDUCED CARDIOTOXICITY MARKET CURRENT AND FUTURE TYPE ANALYSIS, 2025–2034, (USD MILLION)
FIGURE 24 EASTERN EUROPE DRUG-INDUCED CARDIOTOXICITY MARKET CURRENT AND FUTURE END USER ANALYSIS, 2025–2034, (USD MILLION)
FIGURE 25 MARKET SHARE BY COUNTRY
FIGURE 26 WESTERN EUROPE DRUG-INDUCED CARDIOTOXICITY MARKET CURRENT AND FUTURE TYPE ANALYSIS, 2025–2034, (USD MILLION)
FIGURE 27 WESTERN EUROPE DRUG-INDUCED CARDIOTOXICITY MARKET CURRENT AND FUTURE END USER ANALYSIS, 2025–2034, (USD MILLION)
FIGURE 28 MARKET SHARE BY COUNTRY
FIGURE 29 EAST ASIA AND PACIFIC DRUG-INDUCED CARDIOTOXICITY MARKET CURRENT AND FUTURE TYPE ANALYSIS, 2025–2034, (USD MILLION)
FIGURE 30 EAST ASIA AND PACIFIC DRUG-INDUCED CARDIOTOXICITY MARKET CURRENT AND FUTURE END USER ANALYSIS, 2025–2034, (USD MILLION)
FIGURE 31 MARKET SHARE BY COUNTRY
FIGURE 32 SEA AND SOUTH ASIA DRUG-INDUCED CARDIOTOXICITY MARKET CURRENT AND FUTURE TYPE ANALYSIS, 2025–2034, (USD MILLION)
FIGURE 33 SEA AND SOUTH ASIA DRUG-INDUCED CARDIOTOXICITY MARKET CURRENT AND FUTURE END USER ANALYSIS, 2025–2034, (USD MILLION)
FIGURE 34 MARKET SHARE BY COUNTRY
FIGURE 35 MIDDLE EAST AND AFRICA DRUG-INDUCED CARDIOTOXICITY MARKET CURRENT AND FUTURE TYPE ANALYSIS, 2025–2034, (USD MILLION)
FIGURE 36 MIDDLE EAST AND AFRICA DRUG-INDUCED CARDIOTOXICITY MARKET CURRENT AND FUTURE END USER ANALYSIS, 2025–2034, (USD MILLION)
FIGURE 37 NORTH AMERICA DRUG-INDUCED CARDIOTOXICITY MARKET CURRENT AND FUTURE MARKET VOLUME SHARE REGIONAL ANALYSIS, 2025–2034, (USD MILLION)
FIGURE 38 U.S. DRUG-INDUCED CARDIOTOXICITY MARKET CURRENT AND FUTURE TYPE ANALYSIS, 2025–2034, (USD MILLION)
FIGURE 39 U.S. DRUG-INDUCED CARDIOTOXICITY MARKET CURRENT AND FUTURE END USER ANALYSIS, 2025–2034, (USD MILLION)
FIGURE 40 CANADA DRUG-INDUCED CARDIOTOXICITY MARKET CURRENT AND FUTURE TYPE ANALYSIS, 2025–2034, (USD MILLION)
FIGURE 41 CANADA DRUG-INDUCED CARDIOTOXICITY MARKET CURRENT AND FUTURE END USER ANALYSIS, 2025–2034, (USD MILLION)
FIGURE 42 LATIN AMERICA DRUG-INDUCED CARDIOTOXICITY MARKET CURRENT AND FUTURE MARKET VOLUME SHARE REGIONAL ANALYSIS, 2025–2034, (USD MILLION)
FIGURE 43 MEXICO DRUG-INDUCED CARDIOTOXICITY MARKET CURRENT AND FUTURE TYPE ANALYSIS, 2025–2034, (USD MILLION)
FIGURE 44 MEXICO DRUG-INDUCED CARDIOTOXICITY MARKET CURRENT AND FUTURE END USER ANALYSIS, 2025–2034, (USD MILLION)
FIGURE 45 BRAZIL DRUG-INDUCED CARDIOTOXICITY MARKET CURRENT AND FUTURE TYPE ANALYSIS, 2025–2034, (USD MILLION)
FIGURE 46 BRAZIL DRUG-INDUCED CARDIOTOXICITY MARKET CURRENT AND FUTURE END USER ANALYSIS, 2025–2034, (USD MILLION)
FIGURE 47 ARGENTINA DRUG-INDUCED CARDIOTOXICITY MARKET CURRENT AND FUTURE TYPE ANALYSIS, 2025–2034, (USD MILLION)
FIGURE 48 ARGENTINA DRUG-INDUCED CARDIOTOXICITY MARKET CURRENT AND FUTURE END USER ANALYSIS, 2025–2034, (USD MILLION)
FIGURE 49 COLUMBIA DRUG-INDUCED CARDIOTOXICITY MARKET CURRENT AND FUTURE TYPE ANALYSIS, 2025–2034, (USD MILLION)
FIGURE 50 COLUMBIA DRUG-INDUCED CARDIOTOXICITY MARKET CURRENT AND FUTURE END USER ANALYSIS, 2025–2034, (USD MILLION)
FIGURE 51 REST OF LATIN AMERICA DRUG-INDUCED CARDIOTOXICITY MARKET CURRENT AND FUTURE TYPE ANALYSIS, 2025–2034, (USD MILLION)
FIGURE 52 REST OF LATIN AMERICA DRUG-INDUCED CARDIOTOXICITY MARKET CURRENT AND FUTURE END USER ANALYSIS, 2025–2034, (USD MILLION)
FIGURE 53 EASTERN EUROPE DRUG-INDUCED CARDIOTOXICITY MARKET CURRENT AND FUTURE MARKET VOLUME SHARE REGIONAL ANALYSIS, 2025–2034, (USD MILLION)
FIGURE 54 POLAND DRUG-INDUCED CARDIOTOXICITY MARKET CURRENT AND FUTURE TYPE ANALYSIS, 2025–2034, (USD MILLION)
FIGURE 55 POLAND DRUG-INDUCED CARDIOTOXICITY MARKET CURRENT AND FUTURE END USER ANALYSIS, 2025–2034, (USD MILLION)
FIGURE 56 RUSSIA DRUG-INDUCED CARDIOTOXICITY MARKET CURRENT AND FUTURE TYPE ANALYSIS, 2025–2034, (USD MILLION)
FIGURE 57 RUSSIA DRUG-INDUCED CARDIOTOXICITY MARKET CURRENT AND FUTURE END USER ANALYSIS, 2025–2034, (USD MILLION)
FIGURE 58 CZECH REPUBLIC DRUG-INDUCED CARDIOTOXICITY MARKET CURRENT AND FUTURE TYPE ANALYSIS, 2025–2034, (USD MILLION)
FIGURE 59 CZECH REPUBLIC DRUG-INDUCED CARDIOTOXICITY MARKET CURRENT AND FUTURE END USER ANALYSIS, 2025–2034, (USD MILLION)
FIGURE 60 ROMANIA DRUG-INDUCED CARDIOTOXICITY MARKET CURRENT AND FUTURE TYPE ANALYSIS, 2025–2034, (USD MILLION)
FIGURE 61 ROMANIA DRUG-INDUCED CARDIOTOXICITY MARKET CURRENT AND FUTURE END USER ANALYSIS, 2025–2034, (USD MILLION)
FIGURE 62 REST OF EASTERN EUROPE DRUG-INDUCED CARDIOTOXICITY MARKET CURRENT AND FUTURE TYPE ANALYSIS, 2025–2034, (USD MILLION)
FIGURE 63 REST OF EASTERN EUROPE DRUG-INDUCED CARDIOTOXICITY MARKET CURRENT AND FUTURE END USER ANALYSIS, 2025–2034, (USD MILLION)
FIGURE 64 WESTERN EUROPE DRUG-INDUCED CARDIOTOXICITY MARKET CURRENT AND FUTURE MARKET VOLUME SHARE REGIONAL ANALYSIS, 2025–2034, (USD MILLION)
FIGURE 65 GERMANY DRUG-INDUCED CARDIOTOXICITY MARKET CURRENT AND FUTURE TYPE ANALYSIS, 2025–2034, (USD MILLION)
FIGURE 66 GERMANY DRUG-INDUCED CARDIOTOXICITY MARKET CURRENT AND FUTURE END USER ANALYSIS, 2025–2034, (USD MILLION)
FIGURE 67 FRANCE DRUG-INDUCED CARDIOTOXICITY MARKET CURRENT AND FUTURE TYPE ANALYSIS, 2025–2034, (USD MILLION)
FIGURE 68 FRANCE DRUG-INDUCED CARDIOTOXICITY MARKET CURRENT AND FUTURE END USER ANALYSIS, 2025–2034, (USD MILLION)
FIGURE 69 UK DRUG-INDUCED CARDIOTOXICITY MARKET CURRENT AND FUTURE TYPE ANALYSIS, 2025–2034, (USD MILLION)
FIGURE 70 UK DRUG-INDUCED CARDIOTOXICITY MARKET CURRENT AND FUTURE END USER ANALYSIS, 2025–2034, (USD MILLION)
FIGURE 71 SPAIN DRUG-INDUCED CARDIOTOXICITY MARKET CURRENT AND FUTURE TYPE ANALYSIS, 2025–2034, (USD MILLION)
FIGURE 72 SPAIN DRUG-INDUCED CARDIOTOXICITY MARKET CURRENT AND FUTURE END USER ANALYSIS, 2025–2034, (USD MILLION)
FIGURE 73 ITALY DRUG-INDUCED CARDIOTOXICITY MARKET CURRENT AND FUTURE TYPE ANALYSIS, 2025–2034, (USD MILLION)
FIGURE 74 ITALY DRUG-INDUCED CARDIOTOXICITY MARKET CURRENT AND FUTURE END USER ANALYSIS, 2025–2034, (USD MILLION)
FIGURE 75 REST OF WESTERN EUROPE DRUG-INDUCED CARDIOTOXICITY MARKET CURRENT AND FUTURE TYPE ANALYSIS, 2025–2034, (USD MILLION)
FIGURE 76 REST OF WESTERN EUROPE DRUG-INDUCED CARDIOTOXICITY MARKET CURRENT AND FUTURE END USER ANALYSIS, 2025–2034, (USD MILLION)
FIGURE 77 EAST ASIA AND PACIFIC DRUG-INDUCED CARDIOTOXICITY MARKET CURRENT AND FUTURE MARKET VOLUME SHARE REGIONAL ANALYSIS, 2025–2034, (USD MILLION)
FIGURE 78 CHINA DRUG-INDUCED CARDIOTOXICITY MARKET CURRENT AND FUTURE TYPE ANALYSIS, 2025–2034, (USD MILLION)
FIGURE 79 CHINA DRUG-INDUCED CARDIOTOXICITY MARKET CURRENT AND FUTURE END USER ANALYSIS, 2025–2034, (USD MILLION)
FIGURE 80 JAPAN DRUG-INDUCED CARDIOTOXICITY MARKET CURRENT AND FUTURE TYPE ANALYSIS, 2025–2034, (USD MILLION)
FIGURE 81 JAPAN DRUG-INDUCED CARDIOTOXICITY MARKET CURRENT AND FUTURE END USER ANALYSIS, 2025–2034, (USD MILLION)
FIGURE 82 AUSTRALIA DRUG-INDUCED CARDIOTOXICITY MARKET CURRENT AND FUTURE TYPE ANALYSIS, 2025–2034, (USD MILLION)
FIGURE 83 AUSTRALIA DRUG-INDUCED CARDIOTOXICITY MARKET CURRENT AND FUTURE END USER ANALYSIS, 2025–2034, (USD MILLION)
FIGURE 84 CAMBODIA DRUG-INDUCED CARDIOTOXICITY MARKET CURRENT AND FUTURE TYPE ANALYSIS, 2025–2034, (USD MILLION)
FIGURE 85 CAMBODIA DRUG-INDUCED CARDIOTOXICITY MARKET CURRENT AND FUTURE END USER ANALYSIS, 2025–2034, (USD MILLION)
FIGURE 86 FIJI DRUG-INDUCED CARDIOTOXICITY MARKET CURRENT AND FUTURE TYPE ANALYSIS, 2025–2034, (USD MILLION)
FIGURE 87 FIJI DRUG-INDUCED CARDIOTOXICITY MARKET CURRENT AND FUTURE END USER ANALYSIS, 2025–2034, (USD MILLION)
FIGURE 88 INDONESIA DRUG-INDUCED CARDIOTOXICITY MARKET CURRENT AND FUTURE TYPE ANALYSIS, 2025–2034, (USD MILLION)
FIGURE 89 INDONESIA DRUG-INDUCED CARDIOTOXICITY MARKET CURRENT AND FUTURE END USER ANALYSIS, 2025–2034, (USD MILLION)
FIGURE 90 SOUTH KOREA DRUG-INDUCED CARDIOTOXICITY MARKET CURRENT AND FUTURE TYPE ANALYSIS, 2025–2034, (USD MILLION)
FIGURE 91 SOUTH KOREA DRUG-INDUCED CARDIOTOXICITY MARKET CURRENT AND FUTURE END USER ANALYSIS, 2025–2034, (USD MILLION)
FIGURE 92 REST OF EAST ASIA AND PACIFIC DRUG-INDUCED CARDIOTOXICITY MARKET CURRENT AND FUTURE TYPE ANALYSIS, 2025–2034, (USD MILLION)
FIGURE 93 REST OF EAST ASIA AND PACIFIC DRUG-INDUCED CARDIOTOXICITY MARKET CURRENT AND FUTURE END USER ANALYSIS, 2025–2034, (USD MILLION)
FIGURE 94 SEA AND SOUTH ASIA DRUG-INDUCED CARDIOTOXICITY MARKET CURRENT AND FUTURE MARKET VOLUME SHARE REGIONAL ANALYSIS, 2025–2034, (USD MILLION)
FIGURE 95 BANGLADESH DRUG-INDUCED CARDIOTOXICITY MARKET CURRENT AND FUTURE TYPE ANALYSIS, 2025–2034, (USD MILLION)
FIGURE 96 BANGLADESH DRUG-INDUCED CARDIOTOXICITY MARKET CURRENT AND FUTURE END USER ANALYSIS, 2025–2034, (USD MILLION)
FIGURE 97 NEW ZEALAND DRUG-INDUCED CARDIOTOXICITY MARKET CURRENT AND FUTURE TYPE ANALYSIS, 2025–2034, (USD MILLION)
FIGURE 98 NEW ZEALAND DRUG-INDUCED CARDIOTOXICITY MARKET CURRENT AND FUTURE END USER ANALYSIS, 2025–2034, (USD MILLION)
FIGURE 99 INDIA DRUG-INDUCED CARDIOTOXICITY MARKET CURRENT AND FUTURE TYPE ANALYSIS, 2025–2034, (USD MILLION)
FIGURE 100 INDIA DRUG-INDUCED CARDIOTOXICITY MARKET CURRENT AND FUTURE END USER ANALYSIS, 2025–2034, (USD MILLION)
FIGURE 101 SINGAPORE DRUG-INDUCED CARDIOTOXICITY MARKET CURRENT AND FUTURE TYPE ANALYSIS, 2025–2034, (USD MILLION)
FIGURE 102 SINGAPORE DRUG-INDUCED CARDIOTOXICITY MARKET CURRENT AND FUTURE END USER ANALYSIS, 2025–2034, (USD MILLION)
FIGURE 103 THAILAND DRUG-INDUCED CARDIOTOXICITY MARKET CURRENT AND FUTURE TYPE ANALYSIS, 2025–2034, (USD MILLION)
FIGURE 104 THAILAND DRUG-INDUCED CARDIOTOXICITY MARKET CURRENT AND FUTURE END USER ANALYSIS, 2025–2034, (USD MILLION)
FIGURE 105 TAIWAN DRUG-INDUCED CARDIOTOXICITY MARKET CURRENT AND FUTURE TYPE ANALYSIS, 2025–2034, (USD MILLION)
FIGURE 106 TAIWAN DRUG-INDUCED CARDIOTOXICITY MARKET CURRENT AND FUTURE END USER ANALYSIS, 2025–2034, (USD MILLION)
FIGURE 107 MALAYSIA DRUG-INDUCED CARDIOTOXICITY MARKET CURRENT AND FUTURE TYPE ANALYSIS, 2025–2034, (USD MILLION)
FIGURE 108 MALAYSIA DRUG-INDUCED CARDIOTOXICITY MARKET CURRENT AND FUTURE END USER ANALYSIS, 2025–2034, (USD MILLION)
FIGURE 109 REST OF SEA AND SOUTH ASIA DRUG-INDUCED CARDIOTOXICITY MARKET CURRENT AND FUTURE TYPE ANALYSIS, 2025–2034, (USD MILLION)
FIGURE 110 REST OF SEA AND SOUTH ASIA DRUG-INDUCED CARDIOTOXICITY MARKET CURRENT AND FUTURE END USER ANALYSIS, 2025–2034, (USD MILLION)
FIGURE 111 MIDDLE EAST AND AFRICA DRUG-INDUCED CARDIOTOXICITY MARKET CURRENT AND FUTURE MARKET VOLUME SHARE REGIONAL ANALYSIS, 2025–2034, (USD MILLION)
FIGURE 112 GCC COUNTRIES DRUG-INDUCED CARDIOTOXICITY MARKET CURRENT AND FUTURE TYPE ANALYSIS, 2025–2034, (USD MILLION)
FIGURE 113 GCC COUNTRIES DRUG-INDUCED CARDIOTOXICITY MARKET CURRENT AND FUTURE END USER ANALYSIS, 2025–2034, (USD MILLION)
FIGURE 114 SAUDI ARABIA DRUG-INDUCED CARDIOTOXICITY MARKET CURRENT AND FUTURE TYPE ANALYSIS, 2025–2034, (USD MILLION)
FIGURE 115 SAUDI ARABIA DRUG-INDUCED CARDIOTOXICITY MARKET CURRENT AND FUTURE END USER ANALYSIS, 2025–2034, (USD MILLION)
FIGURE 116 UAE DRUG-INDUCED CARDIOTOXICITY MARKET CURRENT AND FUTURE TYPE ANALYSIS, 2025–2034, (USD MILLION)
FIGURE 117 UAE DRUG-INDUCED CARDIOTOXICITY MARKET CURRENT AND FUTURE END USER ANALYSIS, 2025–2034, (USD MILLION)
FIGURE 118 BAHRAIN DRUG-INDUCED CARDIOTOXICITY MARKET CURRENT AND FUTURE TYPE ANALYSIS, 2025–2034, (USD MILLION)
FIGURE 119 BAHRAIN DRUG-INDUCED CARDIOTOXICITY MARKET CURRENT AND FUTURE END USER ANALYSIS, 2025–2034, (USD MILLION)
FIGURE 120 KUWAIT DRUG-INDUCED CARDIOTOXICITY MARKET CURRENT AND FUTURE TYPE ANALYSIS, 2025–2034, (USD MILLION)
FIGURE 121 KUWAIT DRUG-INDUCED CARDIOTOXICITY MARKET CURRENT AND FUTURE END USER ANALYSIS, 2025–2034, (USD MILLION)
FIGURE 122 OMAN DRUG-INDUCED CARDIOTOXICITY MARKET CURRENT AND FUTURE TYPE ANALYSIS, 2025–2034, (USD MILLION)
FIGURE 123 OMAN DRUG-INDUCED CARDIOTOXICITY MARKET CURRENT AND FUTURE END USER ANALYSIS, 2025–2034, (USD MILLION)
FIGURE 124 QATAR DRUG-INDUCED CARDIOTOXICITY MARKET CURRENT AND FUTURE TYPE ANALYSIS, 2025–2034, (USD MILLION)
FIGURE 125 QATAR DRUG-INDUCED CARDIOTOXICITY MARKET CURRENT AND FUTURE END USER ANALYSIS, 2025–2034, (USD MILLION)
FIGURE 126 EGYPT DRUG-INDUCED CARDIOTOXICITY MARKET CURRENT AND FUTURE TYPE ANALYSIS, 2025–2034, (USD MILLION)
FIGURE 127 EGYPT DRUG-INDUCED CARDIOTOXICITY MARKET CURRENT AND FUTURE END USER ANALYSIS, 2025–2034, (USD MILLION)
FIGURE 128 NIGERIA DRUG-INDUCED CARDIOTOXICITY MARKET CURRENT AND FUTURE TYPE ANALYSIS, 2025–2034, (USD MILLION)
FIGURE 129 NIGERIA DRUG-INDUCED CARDIOTOXICITY MARKET CURRENT AND FUTURE END USER ANALYSIS, 2025–2034, (USD MILLION)
FIGURE 130 SOUTH AFRICA DRUG-INDUCED CARDIOTOXICITY MARKET CURRENT AND FUTURE TYPE ANALYSIS, 2025–2034, (USD MILLION)
FIGURE 131 SOUTH AFRICA DRUG-INDUCED CARDIOTOXICITY MARKET CURRENT AND FUTURE END USER ANALYSIS, 2025–2034, (USD MILLION)
FIGURE 132 ISRAEL DRUG-INDUCED CARDIOTOXICITY MARKET CURRENT AND FUTURE TYPE ANALYSIS, 2025–2034, (USD MILLION)
FIGURE 133 ISRAEL DRUG-INDUCED CARDIOTOXICITY MARKET CURRENT AND FUTURE END USER ANALYSIS, 2025–2034, (USD MILLION)
FIGURE 134 REST OF MEA DRUG-INDUCED CARDIOTOXICITY MARKET CURRENT AND FUTURE TYPE ANALYSIS, 2025–2034, (USD MILLION)
FIGURE 135 REST OF MEA DRUG-INDUCED CARDIOTOXICITY MARKET CURRENT AND FUTURE END USER ANALYSIS, 2025–2034, (USD MILLION)
FIGURE 136 U. S. MARKET SHARE ANALYSIS BY TYPE (2024)
FIGURE 137 U. S. MARKET SHARE ANALYSIS BY END USER (2024)
FIGURE 138 CANADA MARKET SHARE ANALYSIS BY TYPE (2024)
FIGURE 139 CANADA MARKET SHARE ANALYSIS BY END USER (2024)
FIGURE 140 MEXICO MARKET SHARE ANALYSIS BY TYPE (2024)
FIGURE 141 MEXICO MARKET SHARE ANALYSIS BY END USER (2024)
FIGURE 142 CHINA MARKET SHARE ANALYSIS BY TYPE (2024)
FIGURE 143 CHINA MARKET SHARE ANALYSIS BY END USER (2024)
FIGURE 144 JAPAN MARKET SHARE ANALYSIS BY TYPE (2024)
FIGURE 145 JAPAN MARKET SHARE ANALYSIS BY END USER (2024)
FIGURE 146 INDIA MARKET SHARE ANALYSIS BY TYPE (2024)
FIGURE 147 INDIA MARKET SHARE ANALYSIS BY END USER (2024)
FIGURE 148 SOUTH KOREA MARKET SHARE ANALYSIS BY TYPE (2024)
FIGURE 149 SOUTH KOREA MARKET SHARE ANALYSIS BY END USER (2024)
FIGURE 150 SAUDI ARABIA MARKET SHARE ANALYSIS BY TYPE (2024)
FIGURE 151 SAUDI ARABIA MARKET SHARE ANALYSIS BY END USER (2024)
FIGURE 152 UAE MARKET SHARE ANALYSIS BY TYPE (2024)
FIGURE 153 UAE MARKET SHARE ANALYSIS BY END USER (2024)
FIGURE 154 EGYPT MARKET SHARE ANALYSIS BY TYPE (2024)
FIGURE 155 EGYPT MARKET SHARE ANALYSIS BY END USER (2024)
FIGURE 156 NIGERIA MARKET SHARE ANALYSIS BY TYPE (2024)
FIGURE 157 NIGERIA MARKET SHARE ANALYSIS BY END USER (2024)
FIGURE 158 SOUTH AFRICA MARKET SHARE ANALYSIS BY TYPE (2024)
FIGURE 159 SOUTH AFRICA MARKET SHARE ANALYSIS BY END USER (2024)
FIGURE 160 GERMANY MARKET SHARE ANALYSIS BY TYPE (2024)
FIGURE 161 GERMANY MARKET SHARE ANALYSIS BY END USER (2024)
FIGURE 162 FRANCE MARKET SHARE ANALYSIS BY TYPE (2024)
FIGURE 163 FRANCE MARKET SHARE ANALYSIS BY END USER (2024)
FIGURE 164 UK MARKET SHARE ANALYSIS BY TYPE (2024)
FIGURE 165 UK MARKET SHARE ANALYSIS BY END USER (2024)
FIGURE 166 SPAIN MARKET SHARE ANALYSIS BY TYPE (2024)
FIGURE 167 SPAIN MARKET SHARE ANALYSIS BY END USER (2024)
FIGURE 168 ITALY MARKET SHARE ANALYSIS BY TYPE (2024)
FIGURE 169 ITALY MARKET SHARE ANALYSIS BY END USER (2024)
FIGURE 170 BRAZIL MARKET SHARE ANALYSIS BY TYPE (2024)
FIGURE 171 BRAZIL MARKET SHARE ANALYSIS BY END USER (2024)
FIGURE 172 ARGENTINA MARKET SHARE ANALYSIS BY TYPE (2024)
FIGURE 173 ARGENTINA MARKET SHARE ANALYSIS BY END USER (2024)
FIGURE 174 COLUMBIA MARKET SHARE ANALYSIS BY TYPE (2024)
FIGURE 175 COLUMBIA MARKET SHARE ANALYSIS BY END USER (2024)
FIGURE 176 GLOBAL DRUG-INDUCED CARDIOTOXICITY MARKET CURRENT AND FUTURE MARKET KEY COUNTRY LEVEL ANALYSIS, 2024–2034, (USD MILLION)
FIGURE 177 FINANCIAL OVERVIEW:
Key Player Analysis
Novartis AG: Innovator Novartis positions as an innovator by deploying AI-enabled ECG algorithms to detect left ventricular dysfunction and atherosclerotic cardiovascular disease through a multi-year collaboration with Anumana, supporting earlier risk identification in clinical and real-world settings. This approach aligns with cardio-oncology needs where subclinical dysfunction must be caught before dose reductions, reinforcing a pipeline strategy that reduces late-stage safety failures in a market growing at 4.6% CAGR to 2033. For you, the integration of ECG-AI into screening and monitoring broadens evidence generation and can compress timelines for safety signal resolution across oncology and specialty portfolios.
Pfizer Inc: Pfizer acts as a leader by embedding biomarker-led surveillance and structured cardiac assessments across oncology programs where cardiotoxicity rates can range from 6% to 28% in specific cohorts, sustaining demand for troponin, NT-proBNP, and echocardiographic metrics. The company benefits from the market’s steady 4.6% CAGR as health systems standardize risk-based monitoring and regulators maintain rigorous cardiovascular safety expectations from preclinical through Phase III. You should expect continued emphasis on protocolized monitoring and post-market vigilance to protect dose intensity and reduce adverse event burden in large-volume indications.
Siemens Healthineers: Siemens Healthineers leads in imaging-driven cardio-oncology workflows with strain echocardiography capabilities and integrated analysis that support early identification of subclinical dysfunction before left ventricular ejection fraction declines. Clinical guidance highlights a relative GLS decrease of more than 15% during therapy as a key threshold, and Siemens’ ecosystem integration with strain analysis platforms strengthens diagnostic consistency and throughput in oncology pathways. For you, this toolset enables earlier interventions, fewer treatment interruptions, and tighter linkage between imaging endpoints and therapeutic decision-making.
GE Healthcare: GE Healthcare anchors cardio-oncology imaging with Vivid echocardiography systems and EchoPAC software, including Automated Function Imaging for global longitudinal strain quantification used in chemotherapy surveillance. Prospective data show GLS changes correlate with higher risk of chemotherapy-induced cardiotoxicity, supporting EchoPAC-based monitoring strategies that flag dysfunction earlier than ejection fraction alone. You can translate these capabilities into standardized monitoring protocols that reduce false negatives and guide timely cardioprotective measures across cancer centers and integrated networks.
Key Market Players
Roche Diagnostics
Abbott Laboratories
Siemens Healthineers
QuidelOrtho
GE HealthCare
Philips Healthcare
Canon Medical Systems
Bruker
IQVIA
Labcorp Drug Development
Charles River Laboratories
ICON plc
Ultromics
Caption Health
Driver
Rising oncology exposure increases demand for cardiac safety assessments.
In 2025, the need for evaluating drug-induced cardiotoxicity is growing as oncology treatments expand and cardio-oncology practices become standard in high-income markets. Reports show that chemotherapies have cardiotoxicity rates between 6% and 28%. Some treatment regimens raise the risk of cardiovascular events by about 30%. These risks lead to the routine use of biomarkers like troponin and NT-proBNP, along with ECG and strain echocardiography, to spot early heart damage and ensure timely care.
Regulatory requirements now include cardiotoxicity evaluation in drug development.
Regulators are increasingly asking for cardiovascular risk assessments from early discovery to Phase III trials. This embeds cardiotoxicity reviews in the drug development process. Monitoring protocols that prioritize biomarkers, increased enrollment in clinical trials, and greater recognition from payers of risk-based checks are helping maintain market growth. Consequently, the market for drug-induced cardiotoxicity is expected to grow at about 4.6% annually through 2033, boosted by standardized testing methods and increased safety oversight.
Restraint
High monitoring expenses hinder wider clinical use.
Testing and workflow costs are significant obstacles, especially outside major medical centers. Serial imaging, global longitudinal strain (GLS) analysis, and cardiac MRI create substantial financial pressures. In many resource-limited healthcare systems, these expenses often exceed cost-effectiveness limits. Financial challenges restrict the broad implementation of comprehensive cardiotoxicity monitoring programs.
Operational difficulties and data fragmentation slow progress.
Smaller biopharma companies face higher costs for preclinical and clinical safety. The presence of multiple medications and fragmented data systems make detecting signals more complicated. Disconnected lab, imaging, and clinical data increase false positive rates and reduce trust in early results. These issues hinder consistent adoption across regions and keep overall market growth below double digits, despite a clear clinical need.
Opportunity
AI-driven analytics support high-growth screening areas.
AI-enabled screening tools and advanced in vitro platforms are creating faster-growing revenue opportunities next to traditional monitoring. The cardiotoxicity screening market, which includes AI-assisted ECG and imaging analytics, multi-biomarker panels, and predictive algorithms, is expected to grow at around 11–12% annually through 2034. This growth is fueled by the need for earlier and more scalable identification of cardiac risk.
Advanced models allow earlier and more profitable detection.
Organ-on-chip systems and iPSC-based cardiomyocyte models are moving cardiotoxicity detection earlier in the process, cutting down on late-stage dropouts. Market players can take advantage of higher-margin opportunities by bundling software-based risk scores with assay kits, validating models in prospective groups, and partnering with pharmaceutical sponsors on consistent monitoring linked to labeling strategies and outcomes-based contracts.
Trend
Biomarker-first and machine learning-enhanced workflows are gaining momentum.
Clinical processes are increasingly focusing on biomarker-first detection, supported by machine learning. Hospitals now use serial troponin or NT-proBNP tests alongside GLS strain imaging to detect subclinical injury sooner. Research groups report classifier performance close to AUC 0.80 in distinguishing higher-risk drugs from safer ones, boosting confidence in predictive methods.
Integrated risk platforms are shaping the future of cardio-oncology care.
Remote monitoring tools and electronic patient-reported outcomes (ePROs) provide real-world data that inform predictive models for dose adjustments and referral timing. Companies that merge laboratory biomarkers, ECG, echocardiographic strain, and medication context into comprehensive risk reports are establishing new standards for adoption. This merging is changing how cardiotoxicity is managed across cardio-oncology and other high-risk treatment areas.
Recent Developments
Dec 2024 – GE HealthCare: Expanded deployment of EchoPAC Connect with remote strain analysis and multi-vendor compatibility, enabling centralized GLS workflows across networked echo labs. The rollout increases throughput and standardization for cardio-oncology monitoring, supporting earlier detection and fewer treatment interruptions.
Feb 2025 – Pfizer Inc.: Announced expanded cardio-oncology safety surveillance across late-stage oncology programs, formalizing serial troponin and GLS protocols in high-risk regimens covering ~30–40% of active trials. The update strengthens risk management and reduces dose-limiting cardiac events, protecting program timelines in a market growing at 4.6% CAGR.
Apr 2025 – Novartis & Anumana: Reaffirmed and advanced their ECG-AI collaboration to detect left ventricular dysfunction and atherosclerotic disease, with 2025 program milestones tied to prospective validation and clinician workflows. The partnership accelerates AI-enabled screening at scale and deepens evidence for regulatory and payer engagement.
May 2025 – European Society of Cardiology (ESC) Study Team: Reported successful performance of an AI-enabled ECG algorithm for early heart failure detection in Kenya in a prospective multicenter study of nearly 6,000 participants. The result validates AI-ECG screening in resource-limited settings and supports wider adoption in population-scale cardiotoxicity surveillance.
Jul 2025 – GE HealthCare: Released updated EchoPAC modules with enhanced remote access and automated EF and strain tools to reduce analysis time and inter-operator variability by double-digit percentages. The enhancements improve reproducibility in chemotherapy surveillance and support enterprise-wide cardio-oncology protocols.
Sep 2025 – Hospital Networks (North America): Implemented enterprise cardio-oncology pathways that combine serial biomarkers with GLS triggers for MRI referral, targeting a ~15% reduction in missed subclinical dysfunction over 12 months. The integrated pathway creates a template for payers and providers to scale standardized cardiotoxicity management across oncology centers.