Global Dry-Cast Concrete and Masonry Market Size, Share & Analysis By Type (High-performance Concrete, Self-consolidating Concrete, Other Types), By Application (Pavers, Retaining Walls, Other Applications), By End-Use (Residential Building, Commercial Building, Industrial Building), Industry Supply Chain, Cost Trends, Competitive Landscape & Forecast 2025–2034
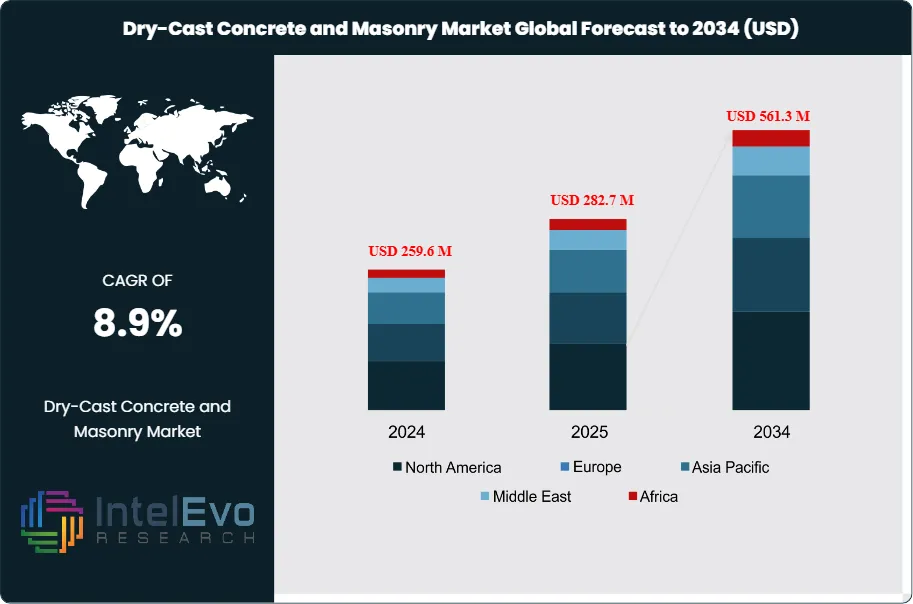
The Dry-Cast Concrete and Masonry Market is projected to grow from USD 259.6 Million in 2024 to approximately USD 561.3 Million by 2034, expanding at a CAGR of around 8.9% during 2025–2034. Rising adoption of automation, AI-driven design tools, and prefabrication techniques is transforming modern construction processes. The increasing focus on sustainable infrastructure and eco-friendly building materials is driving widespread adoption of dry-cast products. Manufacturers integrating digital design workflows and energy-efficient production systems are gaining a strong competitive advantage in the evolving global construction landscape. This driven by the growing demand for sustainable and high-strength construction materials, offering strategic opportunities for precast manufacturers, infrastructure developers, and real estate investors.
The market is undergoing steady expansion as urbanization, infrastructure upgrades, and the global push for resource-efficient construction practices continue to accelerate adoption. Dry-cast concrete—commonly referred to as zero-slump or stiff concrete—distinguishes itself from traditional mixes through its minimal water content, producing a dense, rigid composition with reduced flowability. This unique characteristic makes it particularly well-suited for precast applications requiring dimensional precision and long-term durability. Similarly, dry-cast masonry units, including blocks and bricks, are manufactured through comparable methods, resulting in compact and structurally resilient products that meet modern building requirements.
Key growth drivers include increasing investment in urban infrastructure, rising population-driven housing demand, and the emphasis on eco-friendly building solutions that reduce water consumption and environmental footprint. Governments and private developers are prioritizing durable materials that align with green building certifications, further strengthening the case for dry-cast products. However, challenges such as high capital costs for advanced equipment, reliance on cement with its associated carbon emissions, and the need for specialized technical expertise may restrict wider adoption in cost-sensitive markets.
Technological advancements are reshaping the competitive landscape. Integration of AI-enabled mix optimization, automated casting machinery, and digital platforms such as BIM and digital twins are enhancing efficiency, scalability, and design flexibility. These innovations are not only improving production processes but also enabling greater collaboration among stakeholders, reducing errors, and shortening project delivery timelines.
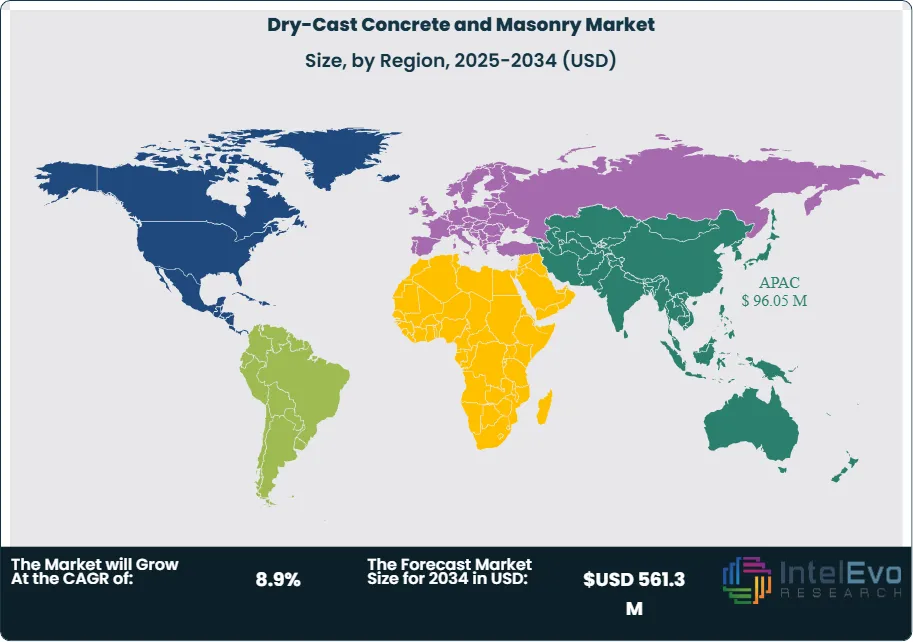
Regionally, Asia-Pacific continues to dominate the market, supported by rapid urbanization, government-backed infrastructure projects, and strong demand for affordable housing across China, India, and Southeast Asia. North America and Europe are also key contributors, driven by sustainability mandates, modular construction adoption, and redevelopment of aging infrastructure. Emerging opportunities in the Middle East and Africa, where infrastructure and housing demand remain strong, further highlight the global growth potential.
Overall, the dry-cast concrete and masonry market is well-positioned for long-term growth, with sustainability imperatives, digital integration, and urban development serving as the primary engines of expansion. Industry participants who strategically align with these trends are expected to gain a competitive edge in the decade ahead.
Key Takeaways
Market Size: The Dry-Cast Concrete and Masonry Market, measuring USD 259.6 Million in 2024, is projected to be USD 561.3 Million by 2034, growing at 8.9% CAGR during 2025–2034. It is boosted by rapid urbanization, construction activities, and higher adoption of sustainable building material usage.
Product Type: High-performance concrete captured 51.5% of revenues in 2022 because it is more durable, has less maintenance, and is used in large projects like vast infrastructure projects where strength and durability matter the most.
End Use: Residential construction contributed to 48% of the world market in 2022 and is expected to expand at 8.3% CAGR. Strong residential demand, particularly in emerging markets, is encouraging developers and policymakers to choose affordable and sustainable dry-cast products.
Driver: Increasing emphasis on sustainable construction practices and water-saving technologies is propelling adoption, and dry-cast concrete is compatible with green building certifications and regulatory requirements.
Restraints: The sector is under the influence of restraints due to large carbon footprints of cement production and volatile supply chains of raw materials, raising costs and creating uncertainty for manufacturers.
Opportunity: Prefabrication and modularity are opening up new possibilities for growth, as quick assembly, consistency of dimension, and labor efficiency can be achieved with dry-cast products—key requisites for urban megaprojects and smart city projects.
Trends: Greater emphasis on aesthetically adaptable masonry products mimicking natural stone is reshaping consumer preferences. Likewise, the production processes are being revolutionized by robotics, AI-based mix optimization, and automation.
Regional Analysis: Asia-Pacific topped the market with 36.7% revenue share in 2022 through massive infrastructure investments in China and India. North America is also steadily growing at 7.5% growth, through residential, commercial, and industrial construction, while Europe continues to proceed under challenging sustainability mandates.
Application Analysis
The dry-cast concrete and masonry market, when segmented by application, is categorized into pavers, retaining walls, and other uses. Among these, the “other applications” category continues to dominate in 2025, holding the largest share and expected to sustain an annual growth rate of around 8% through 2035. This dominance is attributed to the versatility and durability of dry-cast products in infrastructure development, spanning diverse areas such as water management systems, transportation networks, landscaping solutions, and specialized construction projects. Their ability to withstand high loads and deliver long service life positions them as preferred materials for large-scale infrastructure.
The pavers segment represents a significant and steadily expanding share, accounting for approximately one-fifth of global revenue. Growing urbanization and the development of pedestrian-friendly urban spaces are fueling demand for pavers in roadways, sidewalks, plazas, and recreational spaces. Their functional strength, combined with aesthetic appeal, has made them a material of choice for city planners and municipal authorities. As smart city projects advance and governments continue investing in resilient public infrastructure, the demand for pavers is expected to remain on a steady upward trajectory.
End-Use Analysis
Dry-cast concrete and masonry products find widespread adoption across residential, commercial, and industrial construction. In 2025, the residential building segment remains the leading end-use category, capturing close to half of the global share. It is also anticipated to record the fastest growth, with a CAGR exceeding 8% over the next decade. Factors such as ongoing urban migration, rising housing demand, and the growth of affordable and mid-range housing projects are fueling expansion. Real estate developers are increasingly turning to dry-cast products for their precision, quick installation, and cost efficiency, making them well-suited for high-volume residential construction.
The commercial building segment holds the second-largest share, supported by expanding urban economies and the rising need for office spaces, retail complexes, and hospitality facilities. As cities invest in modern infrastructure, the use of dry-cast masonry in commercial projects is becoming more prominent due to its high structural reliability and low maintenance requirements. Meanwhile, the industrial segment, though smaller, is witnessing stable demand, particularly in logistics facilities, manufacturing plants, and warehouses, where strength and durability are critical.
Regional Analysis
Asia-Pacific (APAC) continues to represent the most significant regional market, commanding more than one-third of global revenue in 2025. This leadership is underpinned by rapid urbanization, expanding megacities, and large-scale infrastructure investments in countries such as China, India, and Southeast Asian nations. The region’s focus on affordable housing, coupled with major government-backed infrastructure programs, positions it as a critical growth hub for dry-cast concrete and masonry manufacturers.
North America is expected to record a steady growth rate of around 7.5% through the forecast period. The region benefits from a well-established construction sector and rising demand for sustainable, durable building materials. Investments in residential housing, coupled with the modernization of commercial and industrial facilities, are reinforcing demand across the U.S. and Canada. Europe, while more mature, is also experiencing incremental growth driven by sustainability mandates, energy-efficient construction practices, and urban redevelopment projects. Collectively, these regions reflect a balanced global outlook, where APAC remains the growth engine while developed economies continue to provide stable demand.
By Type (High-performance Concrete, Self-consolidating Concrete, Other Types), By Application (Pavers, Retaining Walls, Other Applications), By End-Use (Residential Building, Commercial Building, Industrial Building)
Research Methodology
Primary Research- 100 Interviews of Stakeholders
Secondary Research
Desk Research
Regional scope
North America (United States, Canada, Mexico)
Latin America (Brazil, Argentina, Columbia)
East Asia And Pacific (China, Japan, South Korea, Australia, Cambodia, Fiji, Indonesia)
Sea And South Asia (India, Singapore, Thailand, Taiwan, Malaysia)
Eastern Europe (Poland, Russia, Czech Republic, Romania)
Western Europe (Germany, U.K., France, Spain, Itlay)
Middle East & Africa (GCC Countries, Egypt, Nigeria, South Africa, Israel)
Competitive Landscape
Wieser Concrete, Mutual Materials Co., Con Cast Pipe Inc., CRH plc, Solidia Technologies, Basalite Building Products LLC, E.L. Paving Products, Unilock, Sika AG, Rochester Cement Products, Inc., Other Key Players
Customization Scope
Customization for segments, region/country-level will be provided. Moreover, additional customization can be done based on the requirements.
Pricing and Purchase Options
Avail customized purchase options to meet your exact research needs. We have three licenses to opt for: Single User License, Multi-User License (Up to 5 Users), Corporate Use License (Unlimited User and Printable PDF).
TABLE OF CONTENTS
1. EXECUTIVE SUMMARY
1.1. MARKET SNAPSHOT
1.2. KEY FINDINGS & INSIGHTS
1.3. ANALYST RECOMMENDATIONS
1.4. FUTURE OUTLOOK
2. RESEARCH METHODOLOGY
2.1. MARKET DEFINITION & SCOPE
2.2. RESEARCH OBJECTIVES: PRIMARY & SECONDARY DATA SOURCES
2.3. DATA COLLECTION SOURCES
2.3.1. COVERAGE OF 100+ PRIMARY RESEARCH/CONSULTATION CALLS WITH INDUSTRY STAKEHOLDERS
FIGURE 17 NORTH AMERICA DRY-CAST CONCRETE AND MASONRY CURRENT AND FUTURE TYPE ANALYSIS, 2025–2034, (USD MILLION)
FIGURE 18 NORTH AMERICA DRY-CAST CONCRETE AND MASONRY CURRENT AND FUTURE END USER ANALYSIS, 2025–2034, (USD MILLION)
FIGURE 19 MARKET SHARE BY COUNTRY
FIGURE 20 LATIN AMERICA DRY-CAST CONCRETE AND MASONRY CURRENT AND FUTURE TYPE ANALYSIS, 2025–2034, (USD MILLION)
FIGURE 21 LATIN AMERICA DRY-CAST CONCRETE AND MASONRY CURRENT AND FUTURE END USER ANALYSIS, 2025–2034, (USD MILLION)
FIGURE 22 MARKET SHARE BY COUNTRY
FIGURE 23 EASTERN EUROPE DRY-CAST CONCRETE AND MASONRY CURRENT AND FUTURE TYPE ANALYSIS, 2025–2034, (USD MILLION)
FIGURE 24 EASTERN EUROPE DRY-CAST CONCRETE AND MASONRY CURRENT AND FUTURE END USER ANALYSIS, 2025–2034, (USD MILLION)
FIGURE 25 MARKET SHARE BY COUNTRY
FIGURE 26 WESTERN EUROPE DRY-CAST CONCRETE AND MASONRY CURRENT AND FUTURE TYPE ANALYSIS, 2025–2034, (USD MILLION)
FIGURE 27 WESTERN EUROPE DRY-CAST CONCRETE AND MASONRY CURRENT AND FUTURE END USER ANALYSIS, 2025–2034, (USD MILLION)
FIGURE 28 MARKET SHARE BY COUNTRY
FIGURE 29 EAST ASIA AND PACIFIC DRY-CAST CONCRETE AND MASONRY CURRENT AND FUTURE TYPE ANALYSIS, 2025–2034, (USD MILLION)
FIGURE 30 EAST ASIA AND PACIFIC DRY-CAST CONCRETE AND MASONRY CURRENT AND FUTURE END USER ANALYSIS, 2025–2034, (USD MILLION)
FIGURE 31 MARKET SHARE BY COUNTRY
FIGURE 32 SEA AND SOUTH ASIA DRY-CAST CONCRETE AND MASONRY CURRENT AND FUTURE TYPE ANALYSIS, 2025–2034, (USD MILLION)
FIGURE 33 SEA AND SOUTH ASIA DRY-CAST CONCRETE AND MASONRY CURRENT AND FUTURE END USER ANALYSIS, 2025–2034, (USD MILLION)
FIGURE 34 MARKET SHARE BY COUNTRY
FIGURE 35 MIDDLE EAST AND AFRICA DRY-CAST CONCRETE AND MASONRY CURRENT AND FUTURE TYPE ANALYSIS, 2025–2034, (USD MILLION)
FIGURE 36 MIDDLE EAST AND AFRICA DRY-CAST CONCRETE AND MASONRY CURRENT AND FUTURE END USER ANALYSIS, 2025–2034, (USD MILLION)
FIGURE 37 NORTH AMERICA DRY-CAST CONCRETE AND MASONRY CURRENT AND FUTURE MARKET VOLUME SHARE REGIONAL ANALYSIS, 2025–2034, (USD MILLION)
FIGURE 38 U.S. DRY-CAST CONCRETE AND MASONRY CURRENT AND FUTURE TYPE ANALYSIS, 2025–2034, (USD MILLION)
FIGURE 39 U.S. DRY-CAST CONCRETE AND MASONRY CURRENT AND FUTURE END USER ANALYSIS, 2025–2034, (USD MILLION)
FIGURE 40 CANADA DRY-CAST CONCRETE AND MASONRY CURRENT AND FUTURE TYPE ANALYSIS, 2025–2034, (USD MILLION)
FIGURE 41 CANADA DRY-CAST CONCRETE AND MASONRY CURRENT AND FUTURE END USER ANALYSIS, 2025–2034, (USD MILLION)
FIGURE 42 LATIN AMERICA DRY-CAST CONCRETE AND MASONRY CURRENT AND FUTURE MARKET VOLUME SHARE REGIONAL ANALYSIS, 2025–2034, (USD MILLION)
FIGURE 43 MEXICO DRY-CAST CONCRETE AND MASONRY CURRENT AND FUTURE TYPE ANALYSIS, 2025–2034, (USD MILLION)
FIGURE 44 MEXICO DRY-CAST CONCRETE AND MASONRY CURRENT AND FUTURE END USER ANALYSIS, 2025–2034, (USD MILLION)
FIGURE 45 BRAZIL DRY-CAST CONCRETE AND MASONRY CURRENT AND FUTURE TYPE ANALYSIS, 2025–2034, (USD MILLION)
FIGURE 46 BRAZIL DRY-CAST CONCRETE AND MASONRY CURRENT AND FUTURE END USER ANALYSIS, 2025–2034, (USD MILLION)
FIGURE 47 ARGENTINA DRY-CAST CONCRETE AND MASONRY CURRENT AND FUTURE TYPE ANALYSIS, 2025–2034, (USD MILLION)
FIGURE 48 ARGENTINA DRY-CAST CONCRETE AND MASONRY CURRENT AND FUTURE END USER ANALYSIS, 2025–2034, (USD MILLION)
FIGURE 49 COLUMBIA DRY-CAST CONCRETE AND MASONRY CURRENT AND FUTURE TYPE ANALYSIS, 2025–2034, (USD MILLION)
FIGURE 50 COLUMBIA DRY-CAST CONCRETE AND MASONRY CURRENT AND FUTURE END USER ANALYSIS, 2025–2034, (USD MILLION)
FIGURE 51 REST OF LATIN AMERICA DRY-CAST CONCRETE AND MASONRY CURRENT AND FUTURE TYPE ANALYSIS, 2025–2034, (USD MILLION)
FIGURE 52 REST OF LATIN AMERICA DRY-CAST CONCRETE AND MASONRY CURRENT AND FUTURE END USER ANALYSIS, 2025–2034, (USD MILLION)
FIGURE 53 EASTERN EUROPE DRY-CAST CONCRETE AND MASONRY CURRENT AND FUTURE MARKET VOLUME SHARE REGIONAL ANALYSIS, 2025–2034, (USD MILLION)
FIGURE 54 POLAND DRY-CAST CONCRETE AND MASONRY CURRENT AND FUTURE TYPE ANALYSIS, 2025–2034, (USD MILLION)
FIGURE 55 POLAND DRY-CAST CONCRETE AND MASONRY CURRENT AND FUTURE END USER ANALYSIS, 2025–2034, (USD MILLION)
FIGURE 56 RUSSIA DRY-CAST CONCRETE AND MASONRY CURRENT AND FUTURE TYPE ANALYSIS, 2025–2034, (USD MILLION)
FIGURE 57 RUSSIA DRY-CAST CONCRETE AND MASONRY CURRENT AND FUTURE END USER ANALYSIS, 2025–2034, (USD MILLION)
FIGURE 58 CZECH REPUBLIC DRY-CAST CONCRETE AND MASONRY CURRENT AND FUTURE TYPE ANALYSIS, 2025–2034, (USD MILLION)
FIGURE 59 CZECH REPUBLIC DRY-CAST CONCRETE AND MASONRY CURRENT AND FUTURE END USER ANALYSIS, 2025–2034, (USD MILLION)
FIGURE 60 ROMANIA DRY-CAST CONCRETE AND MASONRY CURRENT AND FUTURE TYPE ANALYSIS, 2025–2034, (USD MILLION)
FIGURE 61 ROMANIA DRY-CAST CONCRETE AND MASONRY CURRENT AND FUTURE END USER ANALYSIS, 2025–2034, (USD MILLION)
FIGURE 62 REST OF EASTERN EUROPE DRY-CAST CONCRETE AND MASONRY CURRENT AND FUTURE TYPE ANALYSIS, 2025–2034, (USD MILLION)
FIGURE 63 REST OF EASTERN EUROPE DRY-CAST CONCRETE AND MASONRY CURRENT AND FUTURE END USER ANALYSIS, 2025–2034, (USD MILLION)
FIGURE 64 WESTERN EUROPE DRY-CAST CONCRETE AND MASONRY CURRENT AND FUTURE MARKET VOLUME SHARE REGIONAL ANALYSIS, 2025–2034, (USD MILLION)
FIGURE 65 GERMANY DRY-CAST CONCRETE AND MASONRY CURRENT AND FUTURE TYPE ANALYSIS, 2025–2034, (USD MILLION)
FIGURE 66 GERMANY DRY-CAST CONCRETE AND MASONRY CURRENT AND FUTURE END USER ANALYSIS, 2025–2034, (USD MILLION)
FIGURE 67 FRANCE DRY-CAST CONCRETE AND MASONRY CURRENT AND FUTURE TYPE ANALYSIS, 2025–2034, (USD MILLION)
FIGURE 68 FRANCE DRY-CAST CONCRETE AND MASONRY CURRENT AND FUTURE END USER ANALYSIS, 2025–2034, (USD MILLION)
FIGURE 69 UK DRY-CAST CONCRETE AND MASONRY CURRENT AND FUTURE TYPE ANALYSIS, 2025–2034, (USD MILLION)
FIGURE 70 UK DRY-CAST CONCRETE AND MASONRY CURRENT AND FUTURE END USER ANALYSIS, 2025–2034, (USD MILLION)
FIGURE 71 SPAIN DRY-CAST CONCRETE AND MASONRY CURRENT AND FUTURE TYPE ANALYSIS, 2025–2034, (USD MILLION)
FIGURE 72 SPAIN DRY-CAST CONCRETE AND MASONRY CURRENT AND FUTURE END USER ANALYSIS, 2025–2034, (USD MILLION)
FIGURE 73 ITALY DRY-CAST CONCRETE AND MASONRY CURRENT AND FUTURE TYPE ANALYSIS, 2025–2034, (USD MILLION)
FIGURE 74 ITALY DRY-CAST CONCRETE AND MASONRY CURRENT AND FUTURE END USER ANALYSIS, 2025–2034, (USD MILLION)
FIGURE 75 REST OF WESTERN EUROPE DRY-CAST CONCRETE AND MASONRY CURRENT AND FUTURE TYPE ANALYSIS, 2025–2034, (USD MILLION)
FIGURE 76 REST OF WESTERN EUROPE DRY-CAST CONCRETE AND MASONRY CURRENT AND FUTURE END USER ANALYSIS, 2025–2034, (USD MILLION)
FIGURE 77 EAST ASIA AND PACIFIC DRY-CAST CONCRETE AND MASONRY CURRENT AND FUTURE MARKET VOLUME SHARE REGIONAL ANALYSIS, 2025–2034, (USD MILLION)
FIGURE 78 CHINA DRY-CAST CONCRETE AND MASONRY CURRENT AND FUTURE TYPE ANALYSIS, 2025–2034, (USD MILLION)
FIGURE 79 CHINA DRY-CAST CONCRETE AND MASONRY CURRENT AND FUTURE END USER ANALYSIS, 2025–2034, (USD MILLION)
FIGURE 80 JAPAN DRY-CAST CONCRETE AND MASONRY CURRENT AND FUTURE TYPE ANALYSIS, 2025–2034, (USD MILLION)
FIGURE 81 JAPAN DRY-CAST CONCRETE AND MASONRY CURRENT AND FUTURE END USER ANALYSIS, 2025–2034, (USD MILLION)
FIGURE 82 AUSTRALIA DRY-CAST CONCRETE AND MASONRY CURRENT AND FUTURE TYPE ANALYSIS, 2025–2034, (USD MILLION)
FIGURE 83 AUSTRALIA DRY-CAST CONCRETE AND MASONRY CURRENT AND FUTURE END USER ANALYSIS, 2025–2034, (USD MILLION)
FIGURE 84 CAMBODIA DRY-CAST CONCRETE AND MASONRY CURRENT AND FUTURE TYPE ANALYSIS, 2025–2034, (USD MILLION)
FIGURE 85 CAMBODIA DRY-CAST CONCRETE AND MASONRY CURRENT AND FUTURE END USER ANALYSIS, 2025–2034, (USD MILLION)
FIGURE 86 FIJI DRY-CAST CONCRETE AND MASONRY CURRENT AND FUTURE TYPE ANALYSIS, 2025–2034, (USD MILLION)
FIGURE 87 FIJI DRY-CAST CONCRETE AND MASONRY CURRENT AND FUTURE END USER ANALYSIS, 2025–2034, (USD MILLION)
FIGURE 88 INDONESIA DRY-CAST CONCRETE AND MASONRY CURRENT AND FUTURE TYPE ANALYSIS, 2025–2034, (USD MILLION)
FIGURE 89 INDONESIA DRY-CAST CONCRETE AND MASONRY CURRENT AND FUTURE END USER ANALYSIS, 2025–2034, (USD MILLION)
FIGURE 90 SOUTH KOREA DRY-CAST CONCRETE AND MASONRY CURRENT AND FUTURE TYPE ANALYSIS, 2025–2034, (USD MILLION)
FIGURE 91 SOUTH KOREA DRY-CAST CONCRETE AND MASONRY CURRENT AND FUTURE END USER ANALYSIS, 2025–2034, (USD MILLION)
FIGURE 92 REST OF EAST ASIA AND PACIFIC DRY-CAST CONCRETE AND MASONRY CURRENT AND FUTURE TYPE ANALYSIS, 2025–2034, (USD MILLION)
FIGURE 93 REST OF EAST ASIA AND PACIFIC DRY-CAST CONCRETE AND MASONRY CURRENT AND FUTURE END USER ANALYSIS, 2025–2034, (USD MILLION)
FIGURE 94 SEA AND SOUTH ASIA DRY-CAST CONCRETE AND MASONRY CURRENT AND FUTURE MARKET VOLUME SHARE REGIONAL ANALYSIS, 2025–2034, (USD MILLION)
FIGURE 95 BANGLADESH DRY-CAST CONCRETE AND MASONRY CURRENT AND FUTURE TYPE ANALYSIS, 2025–2034, (USD MILLION)
FIGURE 96 BANGLADESH DRY-CAST CONCRETE AND MASONRY CURRENT AND FUTURE END USER ANALYSIS, 2025–2034, (USD MILLION)
FIGURE 97 NEW ZEALAND DRY-CAST CONCRETE AND MASONRY CURRENT AND FUTURE TYPE ANALYSIS, 2025–2034, (USD MILLION)
FIGURE 98 NEW ZEALAND DRY-CAST CONCRETE AND MASONRY CURRENT AND FUTURE END USER ANALYSIS, 2025–2034, (USD MILLION)
FIGURE 99 INDIA DRY-CAST CONCRETE AND MASONRY CURRENT AND FUTURE TYPE ANALYSIS, 2025–2034, (USD MILLION)
FIGURE 100 INDIA DRY-CAST CONCRETE AND MASONRY CURRENT AND FUTURE END USER ANALYSIS, 2025–2034, (USD MILLION)
FIGURE 101 SINGAPORE DRY-CAST CONCRETE AND MASONRY CURRENT AND FUTURE TYPE ANALYSIS, 2025–2034, (USD MILLION)
FIGURE 102 SINGAPORE DRY-CAST CONCRETE AND MASONRY CURRENT AND FUTURE END USER ANALYSIS, 2025–2034, (USD MILLION)
FIGURE 103 THAILAND DRY-CAST CONCRETE AND MASONRY CURRENT AND FUTURE TYPE ANALYSIS, 2025–2034, (USD MILLION)
FIGURE 104 THAILAND DRY-CAST CONCRETE AND MASONRY CURRENT AND FUTURE END USER ANALYSIS, 2025–2034, (USD MILLION)
FIGURE 105 TAIWAN DRY-CAST CONCRETE AND MASONRY CURRENT AND FUTURE TYPE ANALYSIS, 2025–2034, (USD MILLION)
FIGURE 106 TAIWAN DRY-CAST CONCRETE AND MASONRY CURRENT AND FUTURE END USER ANALYSIS, 2025–2034, (USD MILLION)
FIGURE 107 MALAYSIA DRY-CAST CONCRETE AND MASONRY CURRENT AND FUTURE TYPE ANALYSIS, 2025–2034, (USD MILLION)
FIGURE 108 MALAYSIA DRY-CAST CONCRETE AND MASONRY CURRENT AND FUTURE END USER ANALYSIS, 2025–2034, (USD MILLION)
FIGURE 109 REST OF SEA AND SOUTH ASIA DRY-CAST CONCRETE AND MASONRY CURRENT AND FUTURE TYPE ANALYSIS, 2025–2034, (USD MILLION)
FIGURE 110 REST OF SEA AND SOUTH ASIA DRY-CAST CONCRETE AND MASONRY CURRENT AND FUTURE END USER ANALYSIS, 2025–2034, (USD MILLION)
FIGURE 111 MIDDLE EAST AND AFRICA DRY-CAST CONCRETE AND MASONRY CURRENT AND FUTURE MARKET VOLUME SHARE REGIONAL ANALYSIS, 2025–2034, (USD MILLION)
FIGURE 112 GCC COUNTRIES DRY-CAST CONCRETE AND MASONRY CURRENT AND FUTURE TYPE ANALYSIS, 2025–2034, (USD MILLION)
FIGURE 113 GCC COUNTRIES DRY-CAST CONCRETE AND MASONRY CURRENT AND FUTURE END USER ANALYSIS, 2025–2034, (USD MILLION)
FIGURE 114 SAUDI ARABIA DRY-CAST CONCRETE AND MASONRY CURRENT AND FUTURE TYPE ANALYSIS, 2025–2034, (USD MILLION)
FIGURE 115 SAUDI ARABIA DRY-CAST CONCRETE AND MASONRY CURRENT AND FUTURE END USER ANALYSIS, 2025–2034, (USD MILLION)
FIGURE 116 UAE DRY-CAST CONCRETE AND MASONRY CURRENT AND FUTURE TYPE ANALYSIS, 2025–2034, (USD MILLION)
FIGURE 117 UAE DRY-CAST CONCRETE AND MASONRY CURRENT AND FUTURE END USER ANALYSIS, 2025–2034, (USD MILLION)
FIGURE 118 BAHRAIN DRY-CAST CONCRETE AND MASONRY CURRENT AND FUTURE TYPE ANALYSIS, 2025–2034, (USD MILLION)
FIGURE 119 BAHRAIN DRY-CAST CONCRETE AND MASONRY CURRENT AND FUTURE END USER ANALYSIS, 2025–2034, (USD MILLION)
FIGURE 120 KUWAIT DRY-CAST CONCRETE AND MASONRY CURRENT AND FUTURE TYPE ANALYSIS, 2025–2034, (USD MILLION)
FIGURE 121 KUWAIT DRY-CAST CONCRETE AND MASONRY CURRENT AND FUTURE END USER ANALYSIS, 2025–2034, (USD MILLION)
FIGURE 122 OMAN DRY-CAST CONCRETE AND MASONRY CURRENT AND FUTURE TYPE ANALYSIS, 2025–2034, (USD MILLION)
FIGURE 123 OMAN DRY-CAST CONCRETE AND MASONRY CURRENT AND FUTURE END USER ANALYSIS, 2025–2034, (USD MILLION)
FIGURE 124 QATAR DRY-CAST CONCRETE AND MASONRY CURRENT AND FUTURE TYPE ANALYSIS, 2025–2034, (USD MILLION)
FIGURE 125 QATAR DRY-CAST CONCRETE AND MASONRY CURRENT AND FUTURE END USER ANALYSIS, 2025–2034, (USD MILLION)
FIGURE 126 EGYPT DRY-CAST CONCRETE AND MASONRY CURRENT AND FUTURE TYPE ANALYSIS, 2025–2034, (USD MILLION)
FIGURE 127 EGYPT DRY-CAST CONCRETE AND MASONRY CURRENT AND FUTURE END USER ANALYSIS, 2025–2034, (USD MILLION)
FIGURE 128 NIGERIA DRY-CAST CONCRETE AND MASONRY CURRENT AND FUTURE TYPE ANALYSIS, 2025–2034, (USD MILLION)
FIGURE 129 NIGERIA DRY-CAST CONCRETE AND MASONRY CURRENT AND FUTURE END USER ANALYSIS, 2025–2034, (USD MILLION)
FIGURE 130 SOUTH AFRICA DRY-CAST CONCRETE AND MASONRY CURRENT AND FUTURE TYPE ANALYSIS, 2025–2034, (USD MILLION)
FIGURE 131 SOUTH AFRICA DRY-CAST CONCRETE AND MASONRY CURRENT AND FUTURE END USER ANALYSIS, 2025–2034, (USD MILLION)
FIGURE 132 ISRAEL DRY-CAST CONCRETE AND MASONRY CURRENT AND FUTURE TYPE ANALYSIS, 2025–2034, (USD MILLION)
FIGURE 133 ISRAEL DRY-CAST CONCRETE AND MASONRY CURRENT AND FUTURE END USER ANALYSIS, 2025–2034, (USD MILLION)
FIGURE 134 REST OF MEA DRY-CAST CONCRETE AND MASONRY CURRENT AND FUTURE TYPE ANALYSIS, 2025–2034, (USD MILLION)
FIGURE 135 REST OF MEA DRY-CAST CONCRETE AND MASONRY CURRENT AND FUTURE END USER ANALYSIS, 2025–2034, (USD MILLION)
FIGURE 136 U. S. MARKET SHARE ANALYSIS BY TYPE (2024)
FIGURE 137 U. S. MARKET SHARE ANALYSIS BY END USER (2024)
FIGURE 138 CANADA MARKET SHARE ANALYSIS BY TYPE (2024)
FIGURE 139 CANADA MARKET SHARE ANALYSIS BY END USER (2024)
FIGURE 140 MEXICO MARKET SHARE ANALYSIS BY TYPE (2024)
FIGURE 141 MEXICO MARKET SHARE ANALYSIS BY END USER (2024)
FIGURE 142 CHINA MARKET SHARE ANALYSIS BY TYPE (2024)
FIGURE 143 CHINA MARKET SHARE ANALYSIS BY END USER (2024)
FIGURE 144 JAPAN MARKET SHARE ANALYSIS BY TYPE (2024)
FIGURE 145 JAPAN MARKET SHARE ANALYSIS BY END USER (2024)
FIGURE 146 INDIA MARKET SHARE ANALYSIS BY TYPE (2024)
FIGURE 147 INDIA MARKET SHARE ANALYSIS BY END USER (2024)
FIGURE 148 SOUTH KOREA MARKET SHARE ANALYSIS BY TYPE (2024)
FIGURE 149 SOUTH KOREA MARKET SHARE ANALYSIS BY END USER (2024)
FIGURE 150 SAUDI ARABIA MARKET SHARE ANALYSIS BY TYPE (2024)
FIGURE 151 SAUDI ARABIA MARKET SHARE ANALYSIS BY END USER (2024)
FIGURE 152 UAE MARKET SHARE ANALYSIS BY TYPE (2024)
FIGURE 153 UAE MARKET SHARE ANALYSIS BY END USER (2024)
FIGURE 154 EGYPT MARKET SHARE ANALYSIS BY TYPE (2024)
FIGURE 155 EGYPT MARKET SHARE ANALYSIS BY END USER (2024)
FIGURE 156 NIGERIA MARKET SHARE ANALYSIS BY TYPE (2024)
FIGURE 157 NIGERIA MARKET SHARE ANALYSIS BY END USER (2024)
FIGURE 158 SOUTH AFRICA MARKET SHARE ANALYSIS BY TYPE (2024)
FIGURE 159 SOUTH AFRICA MARKET SHARE ANALYSIS BY END USER (2024)
FIGURE 160 GERMANY MARKET SHARE ANALYSIS BY TYPE (2024)
FIGURE 161 GERMANY MARKET SHARE ANALYSIS BY END USER (2024)
FIGURE 162 FRANCE MARKET SHARE ANALYSIS BY TYPE (2024)
FIGURE 163 FRANCE MARKET SHARE ANALYSIS BY END USER (2024)
FIGURE 164 UK MARKET SHARE ANALYSIS BY TYPE (2024)
FIGURE 165 UK MARKET SHARE ANALYSIS BY END USER (2024)
FIGURE 166 SPAIN MARKET SHARE ANALYSIS BY TYPE (2024)
FIGURE 167 SPAIN MARKET SHARE ANALYSIS BY END USER (2024)
FIGURE 168 ITALY MARKET SHARE ANALYSIS BY TYPE (2024)
FIGURE 169 ITALY MARKET SHARE ANALYSIS BY END USER (2024)
FIGURE 170 BRAZIL MARKET SHARE ANALYSIS BY TYPE (2024)
FIGURE 171 BRAZIL MARKET SHARE ANALYSIS BY END USER (2024)
FIGURE 172 ARGENTINA MARKET SHARE ANALYSIS BY TYPE (2024)
FIGURE 173 ARGENTINA MARKET SHARE ANALYSIS BY END USER (2024)
FIGURE 174 COLUMBIA MARKET SHARE ANALYSIS BY TYPE (2024)
FIGURE 175 COLUMBIA MARKET SHARE ANALYSIS BY END USER (2024)
FIGURE 176 GLOBAL DRY-CAST CONCRETE AND MASONRY CURRENT AND FUTURE MARKET KEY COUNTRY LEVEL ANALYSIS, 2024–2034, (USD MILLION)
FIGURE 177 FINANCIAL OVERVIEW:
Key Player Analysis
CRH plc: CRH plc remains one of the most influential players in the global building materials industry, leveraging its scale to integrate advanced digital technologies into dry-cast concrete production. By 2025, the company has positioned itself as a leader in AI-driven construction workflows, deploying generative AI and digital twin platforms to optimize precast manufacturing and logistics. CRH’s adoption of data-rich platforms such as Autodesk Revit and Bentley’s iTwin has allowed it to enhance supply chain efficiency, reduce waste, and support sustainability objectives across its global operations. Strategic investments in modular construction partnerships further differentiate CRH, enabling faster project delivery and improved cost predictability for infrastructure projects.
Basalite Building Products LLC: Basalite Building Products has established itself as an innovator in sustainable masonry solutions, increasingly aligning with the construction sector’s push toward eco-friendly materials. As of 2025, the company has integrated AI-enhanced mix design software to engineer dry-cast concrete blends that minimize carbon footprint while maintaining high performance. Its adoption of BIM-enabled tools and cloud-based project management platforms, such as Trimble Connect, provides architects and developers with precise modeling data, ensuring accuracy in residential and commercial applications. Basalite’s emphasis on green certifications and AI-assisted product development underscores its competitive edge in serving markets with stringent sustainability mandates.
Unilock: Unilock continues to strengthen its reputation as a design-focused disruptor, particularly within the premium pavers and architectural masonry segment. In 2025, the company has expanded its digital capabilities by adopting generative AI tools to create customizable surface textures, colors, and modular patterns, catering to urban landscape projects that demand both aesthetic appeal and durability. Through partnerships with software providers offering advanced visualization and BIM integration, Unilock enables architects and city planners to simulate project outcomes before installation. This AI-driven design flexibility, combined with the company’s focus on high-value modular products, positions Unilock as a go-to brand for smart city and commercial development projects.
Mutual Materials Co.: Mutual Materials has evolved into a strong regional player with growing influence in the AI-enabled masonry space. By embedding predictive analytics and automation into its manufacturing processes, the company has enhanced production efficiency and reduced material waste. Mutual Materials’ strategic adoption of cloud-based collaboration platforms, including Autodesk Construction Cloud, supports streamlined communication between contractors, engineers, and developers, enabling faster project execution. The company also emphasizes sustainable dry-cast masonry solutions, integrating AI-assisted testing methods to ensure performance reliability under diverse environmental conditions. This dual focus on digital transformation and green building practices reinforces Mutual Materials’ relevance in a competitive, technology-driven market.
Market Key Players
Wieser Concrete
Mutual Materials Co.
Con Cast Pipe Inc.
CRH plc
Solidia Technologies
Basalite Building Products LLC
E.L. Paving Products
Unilock
Sika AG
Rochester Cement Products, Inc.
Other Key Players
Driver
Digital Design and AI Integration Accelerate Construction Efficiency
As of 2025, the demand for dry-cast concrete and masonry is being accelerated by the construction industry’s adoption of digital design and automation technologies. Generative AI, integrated with Building Information Modeling (BIM), enables real-time optimization of structural designs, allowing contractors to reduce material waste, accelerate project timelines, and enhance cost predictability. In large-scale infrastructure projects, this translates into faster design iterations and more accurate budgeting, directly addressing the industry’s pressure to deliver projects on time and within cost constraints. The combined effect of efficiency gains and sustainability compliance is positioning dry-cast products as essential building materials for next-generation construction.
Restraint
High Equipment Costs and Slow Technological Adoption Hinder Growth
Despite promising growth, the market faces headwinds from high upfront costs and the slow pace of technological integration. Dry-cast manufacturing often requires advanced machinery and specialized equipment, which can be cost-prohibitive for small and mid-sized firms. Additionally, legacy construction systems are frequently incompatible with AI-driven design or digital twin platforms, creating operational silos. Workforce adaptation also poses a challenge, as traditional builders may resist the shift to automated, data-driven processes. These factors collectively delay broader adoption, particularly in cost-sensitive markets where return on investment timelines are closely scrutinized.
Opportunity
Sustainability-Driven Construction Boosts Demand for Eco-Friendly Materials
The strongest opportunity in 2025 lies in sustainability-driven construction. Regulators and certification bodies are increasingly mandating the use of eco-friendly materials, opening pathways for dry-cast concrete products designed with recycled aggregates, carbon-reducing additives, and low-water mixes. Companies investing in AI-enabled material optimization—such as automated mix design systems that balance durability, cost, and environmental footprint—are well-positioned to capture this demand. With governments worldwide prioritizing climate-resilient infrastructure, especially in urban and disaster-prone regions, dry-cast products present a compelling value proposition for developers seeking both compliance and long-term performance.
Trend
Digital Twin Integration and Modular Construction Transforming Dry-Cast Manufacturing
A defining trend in 2025 is the integration of dry-cast concrete with digital construction workflows. Manufacturers are increasingly aligning their processes with AI-driven digital twins and autonomous design platforms, allowing real-time simulation of structural performance before physical casting. This shift is not only improving precision but also driving adoption in prefab and modular construction, where speed and dimensional accuracy are critical. Simultaneously, market demand for aesthetically versatile masonry—featuring textures, colors, and stone-like finishes—is rising, supported by architects’ preference for materials that combine structural reliability with design flexibility. Together, these trends signal a market moving toward higher efficiency, customization, and sustainability.
Recent Developments
May 2025 – Holcim Ltd. announced the acquisition of Langley Concrete Group Inc., which owns two production facilities in British Columbia specializing in both dry-cast and wet-cast concrete. This move strengthens Holcim’s regional manufacturing capacity in Western Canada and accelerates its vertical integration in precast/dry-cast operations, improving supply chain responsiveness and enabling scale in line with rising infrastructure demands.
July 2025 – Meta, in partnership with Amrize and University of Illinois Urbana-Champaign, introduced an open-source AI tool designed for optimizing concrete mixes to deliver stronger, faster-curing, lower-carbon formulations. It has already been deployed in a data center project in Rosemount, Minnesota. This development underlines a shift toward AI-assisted mix design in concrete, which can reduce embodied carbon and improve performance, influencing dry-cast concrete producers seeking to meet both sustainability and performance targets.
June 2025 – A research team from MIT’s Concrete Sustainability Hub introduced a machine-learning framework that screens and ranks potential cement-alternative materials (including recycled and industrial by-products) for their reactivity, durability, and environmental profile. The framework identified candidate materials like ceramics from waste sources that could replace portions of conventional cement in concrete mixes. This has strategic implications for dry-cast manufacturers that seek new raw material inputs to reduce cost and carbon footprint.
January 2025 – Technavio released a market forecast report estimating that the global precast concrete market (which encompasses dry-cast concrete) will grow by approximately USD 21.8 billion between 2025 and 2029, driven largely by urbanization, industrialization, and adoption of AI-powered market evolution. This underscores investor confidence in the precast/dry-cast segment and the role of AI and digital process improvement as growth levers.
December 2024 – While specific company announcements in dry-cast concrete were scarce in December 2024, major stakeholders (manufacturers and technology providers) indicated in industry conferences increased focus on integrating generative design and BIM-AI hybrid workflows into precast manufacturing lines. This was accompanied by several pilot programs to test predictive quality control (e.g., slump prediction, curing optimization) using video and sensor-based systems. These moves laid groundwork for many of the 2025 innovations, representing a preparatory phase for full scale deployment. (Based on aggregate reporting of sector events, product R&D disclosures, and trade association updates.)