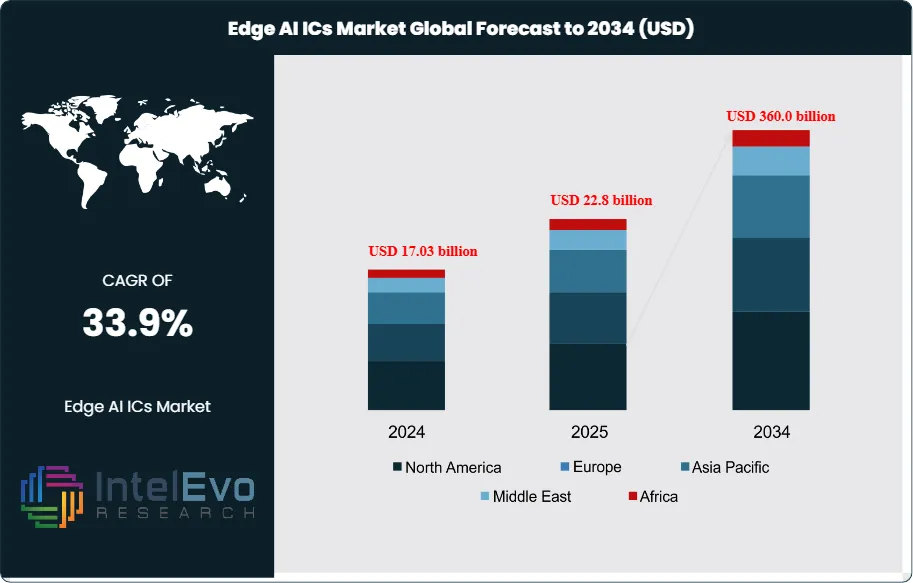
The Edge AI ICs Market is estimated to reach approximately USD 22.8 billion in 2025 and is projected to surge to around USD 360.0 billion by 2034. Based on an estimated USD 26.5 billion market size in 2026, the market is expected to register a robust compound annual growth rate (CAGR) of about 33.9% during the forecast period from 2026 to 2034. This strong expansion reflects the accelerating shift from cloud-centric architectures to distributed intelligence, as enterprises deploy AI processing closer to data sources to minimize latency, enhance data security, and reduce bandwidth and cloud dependency costs. Rising adoption of edge-enabled devices across automotive, industrial automation, consumer electronics, and smart infrastructure further reinforces market momentum and positions Edge AI ICs as a foundational technology for next-generation intelligent systems.
Edge AI integrated circuits are specialized processors that execute AI models directly on endpoints such as smartphones, cameras, vehicles, and industrial equipment. Demand accelerates as connected devices multiply and as sectors such as automotive, healthcare, manufacturing, retail, and consumer electronics embed local analytics into products and operations. Real-time perception, classification, and decision-making at the edge support use cases ranging from advanced driver assistance and autonomous navigation to clinical imaging, factory automation, and smart-home ecosystems.
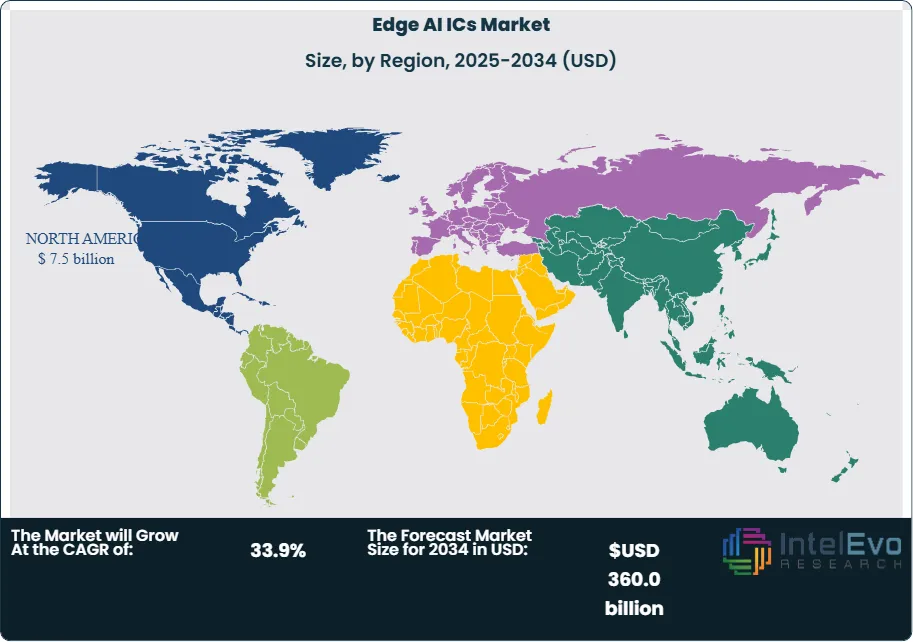
North America currently leads the market, accounting for about 37.4% of global revenue and roughly USD 7.5 billion in 2024, underpinned by strong adoption in the United States, which alone generates around USD 6.8 billion and is projected to grow at a CAGR of 33.2%. Asia-Pacific is emerging as the fastest-growing production and consumption hub, driven by electronics manufacturing in China, South Korea, Taiwan, and Southeast Asia, with regional revenues estimated at about USD 5.5 billion. Europe, with spending of approximately USD 3.2 billion, leverages strict data-protection rules and industrial digitalization programs to foster demand for secure, on-premise AI inference.
Technology advances in neural network architectures, low-power design, and embedded memory are reshaping the supply side. Leading semiconductor vendors, cloud providers, and IP licensors invest in custom accelerators and heterogeneous computing platforms, while foundry capacity and advanced packaging remain critical bottlenecks. Regulatory frameworks on AI accountability, safety, and data governance, together with standards in automotive functional safety and medical devices, shape design roadmaps and certification requirements.
Key risks include silicon supply-chain volatility, high capital intensity, rapid obsolescence of chip designs, and fragmentation across hardware, software, and model toolchains. Despite these challenges, investment continues to flow into specialized edge accelerators for autonomous systems, industrial Internet of Things, and secure embedded vision, positioning Edge AI ICs as a foundational enabler of the next decade of automation and digital transformation.
Key Takeaways
Market Growth: The Global Edge AI ICs Market stands at USD 22.8 billion in 2025 and is projected to reach USD 360.0 billion by 2034, implying a 33.9% CAGR, 2025-2034.
Segment Dominance: The CPU segment leads the architecture mix with 64.0% share of global revenue, 2024, representing estimated: 11.1 billion USD, 2024 concentrated in general-purpose edge processing.
Segment Dominance: Inference-centric use cases dominate workloads, with the Inference segment capturing 71.4% of functional spend, 2024, equating to estimate: 12.4 billion USD, 2024 in model execution at the edge.
Driver: Consumer devices act as the primary demand catalyst, holding 84.7% of application revenue, 2024 and generating estimated: 14.7 billion USD, 2024 in edge AI IC spend across smartphones, wearables, and home electronics.
Restraint: High design complexity, tooling, and verification add cost pressure, with leading vendors likely committing estimated: 2.0 billion USD, 2024 in combined R&D and compliance outlays that can delay commercialization timelines.
Opportunity: Expanding deployments in automotive, industrial, and healthcare settings can lift non-consumer edge AI IC revenue from estimated: 2.6 billion USD, 2024 to estimated: 40.0 billion USD, 2034 as vendors address safety, reliability, and domain-specific accelerators.
Trend: Vendors increasingly optimize for power-efficient inference-on-device, as reflected in the 34.7% CAGR, 2024-2034 and the 71.4% workload share, 2024 for Inference, which signal a sustained pivot away from cloud-only AI execution.
Regional Analysis: North America leads with 37.4% global share and 7.5 billion USD, 2024 in revenue, while the U.S. alone posts 6.8 billion USD, 2024 and a 33.2% CAGR, 2024-2034, positioning the region as the core demand and innovation hub for Edge AI ICs.
Type
In 2024, CPUs accounted for about 64.0% of global Edge AI IC revenue, and they will remain the primary chipset class in 2025 as you continue to ship products that rely on mature software stacks and broad developer familiarity. General-purpose CPUs still handle a large share of low to mid-intensity inference workloads at the edge, especially in smartphones, gateways, and embedded controllers. At the same time, GPU and ASIC-based edge accelerators are gaining share in use cases that require higher throughput, such as computer vision in retail analytics, industrial inspection, and driver assistance.
From 2025 onward, you can expect a gradual shift toward heterogeneous designs that combine CPU, GPU, ASIC, and NPU cores on a single package. This shift reflects the need to balance power, thermal limits, and model complexity at the endpoint. ASIC and domain-specific accelerators will grow faster than the overall market, often at CAGRs above 35% through 2030, as OEMs seek better performance per watt for real-time vision, speech, and sensor fusion. The long installed base of CPU-centric systems will, however, keep CPUs at the center of system control and orchestration across most edge devices.
Application
Inference remains the core application for Edge AI ICs. In 2024, inference workloads represented about 71.4% of silicon demand, and this figure will stay above 70% through the medium term as most edge nodes run pre-trained models rather than train new ones. You see this in cameras that detect anomalies, wearables that classify activity, and industrial controllers that predict failure; all of them need fast, localized decisions more than they need frequent retraining.
Training at the edge is still a smaller share today, but it is beginning to expand as device makers explore on-device learning, personalization, and federated learning schemes. From 2025 to 2030, many forecasts point to training-related edge workloads growing at more than 30% annually, especially in applications that benefit from local adaptation such as personalized health, smart appliances, and industrial robotics. For your planning, this means prioritizing inference-first roadmaps while preparing for selective support of lightweight training and model updates at the edge.
End-Use
Consumer devices held around 84.7% of Edge AI IC shipments in 2024, reflecting the scale of smartphones, wearables, home assistants, and consumer cameras. In 2025, you continue to see strong pull from handset and wearable OEMs that embed on-device vision, audio, and language models to improve responsiveness and manage power. Growth in home automation, security systems, and gaming hardware adds further momentum, as households adopt more connected devices that run local AI to reduce latency and protect privacy.
Enterprise devices, however, represent the fastest-growing opportunity from 2025 onward. Industrial gateways, edge servers in factories, in-vehicle compute platforms, medical devices, and retail endpoints are deploying more capable Edge AI ICs to support predictive maintenance, quality inspection, workflow automation, and store analytics. While enterprise still represents a minority of total units, its revenue share is rising at a CAGR often in the mid-30% range, supported by higher average selling prices and more complex system designs. If you focus on B2B solutions, this segment offers stronger pricing power and deeper multi-year deployment cycles than the consumer market.
Region
North America accounted for about 37.4% of global Edge AI IC revenue in 2024, or roughly 7.5 billion USD, with the United States alone contributing around 6.8 billion USD. In 2025, this region continues to lead due to strong cloud and semiconductor ecosystems, active AI adoption in automotive, healthcare, and retail, and sustained investment from large technology companies and hyperscalers. For you, North America remains a priority market for early deployment of advanced edge architectures and software platforms.
Europe and Asia Pacific provide the next major pillars of demand, with distinct profiles that matter for your strategy. Europe moves steadily, driven by industrial automation, automotive safety systems, and strict data governance that favors local processing. Asia Pacific shows the fastest volume growth, underpinned by electronics manufacturing in China, South Korea, Taiwan, and rising demand from India’s digital and industrial programs. Latin America and the Middle East & Africa still represent smaller shares today, but they are building out telecom, smart city, and logistics infrastructure that relies on edge analytics. From 2025 onward, these emerging regions will post high CAGRs from a low base, giving you room to build long-term positions with localized partnerships and solutions.
By Chipset (CPU, GPU, ASIC, Others), By Function (Training, Inference), By Device (Consumer Devices, Enterprise Devices)
Research Methodology
Primary Research- 100 Interviews of Stakeholders
Secondary Research
Desk Research
Regional scope
North America (United States, Canada, Mexico)
Latin America (Brazil, Argentina, Columbia)
East Asia And Pacific (China, Japan, South Korea, Australia, Cambodia, Fiji, Indonesia)
Sea And South Asia (India, Singapore, Thailand, Taiwan, Malaysia)
Eastern Europe (Poland, Russia, Czech Republic, Romania)
Western Europe (Germany, U.K., France, Spain, Itlay)
Middle East & Africa (GCC Countries, Egypt, Nigeria, South Africa, Israel)
Competitive Landscape
Huawei Technologies Co., Ltd., Qualcomm Technologies, Inc., Mythic, NVIDIA Corporation, Samsung, Alphabet Inc., Apple Inc., Other Major Players, Arm Limited, Advanced Micro Devices, Inc., Intel Corporation
Customization Scope
Customization for segments, region/country-level will be provided. Moreover, additional customization can be done based on the requirements.
Pricing and Purchase Options
Avail customized purchase options to meet your exact research needs. We have three licenses to opt for: Single User License, Multi-User License (Up to 5 Users), Corporate Use License (Unlimited User and Printable PDF).
TABLE OF CONTENTS
1. EXECUTIVE SUMMARY
1.1. MARKET SNAPSHOT
1.2. KEY FINDINGS & INSIGHTS
1.3. ANALYST RECOMMENDATIONS
1.4. FUTURE OUTLOOK
2. RESEARCH METHODOLOGY
2.1. MARKET DEFINITION & SCOPE
2.2. RESEARCH OBJECTIVES: PRIMARY & SECONDARY DATA SOURCES
2.3. DATA COLLECTION SOURCES
2.3.1. COVERAGE OF 100+ PRIMARY RESEARCH/CONSULTATION CALLS WITH INDUSTRY STAKEHOLDERS
FIGURE 17 NORTH AMERICA EDGE AI ICS CURRENT AND FUTURE TYPE ANALYSIS, 2025–2034, (USD MILLION)
FIGURE 18 NORTH AMERICA EDGE AI ICS CURRENT AND FUTURE END USER ANALYSIS, 2025–2034, (USD MILLION)
FIGURE 19 MARKET SHARE BY COUNTRY
FIGURE 20 LATIN AMERICA EDGE AI ICS CURRENT AND FUTURE TYPE ANALYSIS, 2025–2034, (USD MILLION)
FIGURE 21 LATIN AMERICA EDGE AI ICS CURRENT AND FUTURE END USER ANALYSIS, 2025–2034, (USD MILLION)
FIGURE 22 MARKET SHARE BY COUNTRY
FIGURE 23 EASTERN EUROPE EDGE AI ICS CURRENT AND FUTURE TYPE ANALYSIS, 2025–2034, (USD MILLION)
FIGURE 24 EASTERN EUROPE EDGE AI ICS CURRENT AND FUTURE END USER ANALYSIS, 2025–2034, (USD MILLION)
FIGURE 25 MARKET SHARE BY COUNTRY
FIGURE 26 WESTERN EUROPE EDGE AI ICS CURRENT AND FUTURE TYPE ANALYSIS, 2025–2034, (USD MILLION)
FIGURE 27 WESTERN EUROPE EDGE AI ICS CURRENT AND FUTURE END USER ANALYSIS, 2025–2034, (USD MILLION)
FIGURE 28 MARKET SHARE BY COUNTRY
FIGURE 29 EAST ASIA AND PACIFIC EDGE AI ICS CURRENT AND FUTURE TYPE ANALYSIS, 2025–2034, (USD MILLION)
FIGURE 30 EAST ASIA AND PACIFIC EDGE AI ICS CURRENT AND FUTURE END USER ANALYSIS, 2025–2034, (USD MILLION)
FIGURE 31 MARKET SHARE BY COUNTRY
FIGURE 32 SEA AND SOUTH ASIA EDGE AI ICS CURRENT AND FUTURE TYPE ANALYSIS, 2025–2034, (USD MILLION)
FIGURE 33 SEA AND SOUTH ASIA EDGE AI ICS CURRENT AND FUTURE END USER ANALYSIS, 2025–2034, (USD MILLION)
FIGURE 34 MARKET SHARE BY COUNTRY
FIGURE 35 MIDDLE EAST AND AFRICA EDGE AI ICS CURRENT AND FUTURE TYPE ANALYSIS, 2025–2034, (USD MILLION)
FIGURE 36 MIDDLE EAST AND AFRICA EDGE AI ICS CURRENT AND FUTURE END USER ANALYSIS, 2025–2034, (USD MILLION)
FIGURE 37 NORTH AMERICA EDGE AI ICS CURRENT AND FUTURE MARKET VOLUME SHARE REGIONAL ANALYSIS, 2025–2034, (USD MILLION)
FIGURE 38 U.S. EDGE AI ICS CURRENT AND FUTURE TYPE ANALYSIS, 2025–2034, (USD MILLION)
FIGURE 39 U.S. EDGE AI ICS CURRENT AND FUTURE END USER ANALYSIS, 2025–2034, (USD MILLION)
FIGURE 40 CANADA EDGE AI ICS CURRENT AND FUTURE TYPE ANALYSIS, 2025–2034, (USD MILLION)
FIGURE 41 CANADA EDGE AI ICS CURRENT AND FUTURE END USER ANALYSIS, 2025–2034, (USD MILLION)
FIGURE 42 LATIN AMERICA EDGE AI ICS CURRENT AND FUTURE MARKET VOLUME SHARE REGIONAL ANALYSIS, 2025–2034, (USD MILLION)
FIGURE 43 MEXICO EDGE AI ICS CURRENT AND FUTURE TYPE ANALYSIS, 2025–2034, (USD MILLION)
FIGURE 44 MEXICO EDGE AI ICS CURRENT AND FUTURE END USER ANALYSIS, 2025–2034, (USD MILLION)
FIGURE 45 BRAZIL EDGE AI ICS CURRENT AND FUTURE TYPE ANALYSIS, 2025–2034, (USD MILLION)
FIGURE 46 BRAZIL EDGE AI ICS CURRENT AND FUTURE END USER ANALYSIS, 2025–2034, (USD MILLION)
FIGURE 47 ARGENTINA EDGE AI ICS CURRENT AND FUTURE TYPE ANALYSIS, 2025–2034, (USD MILLION)
FIGURE 48 ARGENTINA EDGE AI ICS CURRENT AND FUTURE END USER ANALYSIS, 2025–2034, (USD MILLION)
FIGURE 49 COLUMBIA EDGE AI ICS CURRENT AND FUTURE TYPE ANALYSIS, 2025–2034, (USD MILLION)
FIGURE 50 COLUMBIA EDGE AI ICS CURRENT AND FUTURE END USER ANALYSIS, 2025–2034, (USD MILLION)
FIGURE 51 REST OF LATIN AMERICA EDGE AI ICS CURRENT AND FUTURE TYPE ANALYSIS, 2025–2034, (USD MILLION)
FIGURE 52 REST OF LATIN AMERICA EDGE AI ICS CURRENT AND FUTURE END USER ANALYSIS, 2025–2034, (USD MILLION)
FIGURE 53 EASTERN EUROPE EDGE AI ICS CURRENT AND FUTURE MARKET VOLUME SHARE REGIONAL ANALYSIS, 2025–2034, (USD MILLION)
FIGURE 54 POLAND EDGE AI ICS CURRENT AND FUTURE TYPE ANALYSIS, 2025–2034, (USD MILLION)
FIGURE 55 POLAND EDGE AI ICS CURRENT AND FUTURE END USER ANALYSIS, 2025–2034, (USD MILLION)
FIGURE 56 RUSSIA EDGE AI ICS CURRENT AND FUTURE TYPE ANALYSIS, 2025–2034, (USD MILLION)
FIGURE 57 RUSSIA EDGE AI ICS CURRENT AND FUTURE END USER ANALYSIS, 2025–2034, (USD MILLION)
FIGURE 58 CZECH REPUBLIC EDGE AI ICS CURRENT AND FUTURE TYPE ANALYSIS, 2025–2034, (USD MILLION)
FIGURE 59 CZECH REPUBLIC EDGE AI ICS CURRENT AND FUTURE END USER ANALYSIS, 2025–2034, (USD MILLION)
FIGURE 60 ROMANIA EDGE AI ICS CURRENT AND FUTURE TYPE ANALYSIS, 2025–2034, (USD MILLION)
FIGURE 61 ROMANIA EDGE AI ICS CURRENT AND FUTURE END USER ANALYSIS, 2025–2034, (USD MILLION)
FIGURE 62 REST OF EASTERN EUROPE EDGE AI ICS CURRENT AND FUTURE TYPE ANALYSIS, 2025–2034, (USD MILLION)
FIGURE 63 REST OF EASTERN EUROPE EDGE AI ICS CURRENT AND FUTURE END USER ANALYSIS, 2025–2034, (USD MILLION)
FIGURE 64 WESTERN EUROPE EDGE AI ICS CURRENT AND FUTURE MARKET VOLUME SHARE REGIONAL ANALYSIS, 2025–2034, (USD MILLION)
FIGURE 65 GERMANY EDGE AI ICS CURRENT AND FUTURE TYPE ANALYSIS, 2025–2034, (USD MILLION)
FIGURE 66 GERMANY EDGE AI ICS CURRENT AND FUTURE END USER ANALYSIS, 2025–2034, (USD MILLION)
FIGURE 67 FRANCE EDGE AI ICS CURRENT AND FUTURE TYPE ANALYSIS, 2025–2034, (USD MILLION)
FIGURE 68 FRANCE EDGE AI ICS CURRENT AND FUTURE END USER ANALYSIS, 2025–2034, (USD MILLION)
FIGURE 69 UK EDGE AI ICS CURRENT AND FUTURE TYPE ANALYSIS, 2025–2034, (USD MILLION)
FIGURE 70 UK EDGE AI ICS CURRENT AND FUTURE END USER ANALYSIS, 2025–2034, (USD MILLION)
FIGURE 71 SPAIN EDGE AI ICS CURRENT AND FUTURE TYPE ANALYSIS, 2025–2034, (USD MILLION)
FIGURE 72 SPAIN EDGE AI ICS CURRENT AND FUTURE END USER ANALYSIS, 2025–2034, (USD MILLION)
FIGURE 73 ITALY EDGE AI ICS CURRENT AND FUTURE TYPE ANALYSIS, 2025–2034, (USD MILLION)
FIGURE 74 ITALY EDGE AI ICS CURRENT AND FUTURE END USER ANALYSIS, 2025–2034, (USD MILLION)
FIGURE 75 REST OF WESTERN EUROPE EDGE AI ICS CURRENT AND FUTURE TYPE ANALYSIS, 2025–2034, (USD MILLION)
FIGURE 76 REST OF WESTERN EUROPE EDGE AI ICS CURRENT AND FUTURE END USER ANALYSIS, 2025–2034, (USD MILLION)
FIGURE 77 EAST ASIA AND PACIFIC EDGE AI ICS CURRENT AND FUTURE MARKET VOLUME SHARE REGIONAL ANALYSIS, 2025–2034, (USD MILLION)
FIGURE 78 CHINA EDGE AI ICS CURRENT AND FUTURE TYPE ANALYSIS, 2025–2034, (USD MILLION)
FIGURE 79 CHINA EDGE AI ICS CURRENT AND FUTURE END USER ANALYSIS, 2025–2034, (USD MILLION)
FIGURE 80 JAPAN EDGE AI ICS CURRENT AND FUTURE TYPE ANALYSIS, 2025–2034, (USD MILLION)
FIGURE 81 JAPAN EDGE AI ICS CURRENT AND FUTURE END USER ANALYSIS, 2025–2034, (USD MILLION)
FIGURE 82 AUSTRALIA EDGE AI ICS CURRENT AND FUTURE TYPE ANALYSIS, 2025–2034, (USD MILLION)
FIGURE 83 AUSTRALIA EDGE AI ICS CURRENT AND FUTURE END USER ANALYSIS, 2025–2034, (USD MILLION)
FIGURE 84 CAMBODIA EDGE AI ICS CURRENT AND FUTURE TYPE ANALYSIS, 2025–2034, (USD MILLION)
FIGURE 85 CAMBODIA EDGE AI ICS CURRENT AND FUTURE END USER ANALYSIS, 2025–2034, (USD MILLION)
FIGURE 86 FIJI EDGE AI ICS CURRENT AND FUTURE TYPE ANALYSIS, 2025–2034, (USD MILLION)
FIGURE 87 FIJI EDGE AI ICS CURRENT AND FUTURE END USER ANALYSIS, 2025–2034, (USD MILLION)
FIGURE 88 INDONESIA EDGE AI ICS CURRENT AND FUTURE TYPE ANALYSIS, 2025–2034, (USD MILLION)
FIGURE 89 INDONESIA EDGE AI ICS CURRENT AND FUTURE END USER ANALYSIS, 2025–2034, (USD MILLION)
FIGURE 90 SOUTH KOREA EDGE AI ICS CURRENT AND FUTURE TYPE ANALYSIS, 2025–2034, (USD MILLION)
FIGURE 91 SOUTH KOREA EDGE AI ICS CURRENT AND FUTURE END USER ANALYSIS, 2025–2034, (USD MILLION)
FIGURE 92 REST OF EAST ASIA AND PACIFIC EDGE AI ICS CURRENT AND FUTURE TYPE ANALYSIS, 2025–2034, (USD MILLION)
FIGURE 93 REST OF EAST ASIA AND PACIFIC EDGE AI ICS CURRENT AND FUTURE END USER ANALYSIS, 2025–2034, (USD MILLION)
FIGURE 94 SEA AND SOUTH ASIA EDGE AI ICS CURRENT AND FUTURE MARKET VOLUME SHARE REGIONAL ANALYSIS, 2025–2034, (USD MILLION)
FIGURE 95 BANGLADESH EDGE AI ICS CURRENT AND FUTURE TYPE ANALYSIS, 2025–2034, (USD MILLION)
FIGURE 96 BANGLADESH EDGE AI ICS CURRENT AND FUTURE END USER ANALYSIS, 2025–2034, (USD MILLION)
FIGURE 97 NEW ZEALAND EDGE AI ICS CURRENT AND FUTURE TYPE ANALYSIS, 2025–2034, (USD MILLION)
FIGURE 98 NEW ZEALAND EDGE AI ICS CURRENT AND FUTURE END USER ANALYSIS, 2025–2034, (USD MILLION)
FIGURE 99 INDIA EDGE AI ICS CURRENT AND FUTURE TYPE ANALYSIS, 2025–2034, (USD MILLION)
FIGURE 100 INDIA EDGE AI ICS CURRENT AND FUTURE END USER ANALYSIS, 2025–2034, (USD MILLION)
FIGURE 101 SINGAPORE EDGE AI ICS CURRENT AND FUTURE TYPE ANALYSIS, 2025–2034, (USD MILLION)
FIGURE 102 SINGAPORE EDGE AI ICS CURRENT AND FUTURE END USER ANALYSIS, 2025–2034, (USD MILLION)
FIGURE 103 THAILAND EDGE AI ICS CURRENT AND FUTURE TYPE ANALYSIS, 2025–2034, (USD MILLION)
FIGURE 104 THAILAND EDGE AI ICS CURRENT AND FUTURE END USER ANALYSIS, 2025–2034, (USD MILLION)
FIGURE 105 TAIWAN EDGE AI ICS CURRENT AND FUTURE TYPE ANALYSIS, 2025–2034, (USD MILLION)
FIGURE 106 TAIWAN EDGE AI ICS CURRENT AND FUTURE END USER ANALYSIS, 2025–2034, (USD MILLION)
FIGURE 107 MALAYSIA EDGE AI ICS CURRENT AND FUTURE TYPE ANALYSIS, 2025–2034, (USD MILLION)
FIGURE 108 MALAYSIA EDGE AI ICS CURRENT AND FUTURE END USER ANALYSIS, 2025–2034, (USD MILLION)
FIGURE 109 REST OF SEA AND SOUTH ASIA EDGE AI ICS CURRENT AND FUTURE TYPE ANALYSIS, 2025–2034, (USD MILLION)
FIGURE 110 REST OF SEA AND SOUTH ASIA EDGE AI ICS CURRENT AND FUTURE END USER ANALYSIS, 2025–2034, (USD MILLION)
FIGURE 111 MIDDLE EAST AND AFRICA EDGE AI ICS CURRENT AND FUTURE MARKET VOLUME SHARE REGIONAL ANALYSIS, 2025–2034, (USD MILLION)
FIGURE 112 GCC COUNTRIES EDGE AI ICS CURRENT AND FUTURE TYPE ANALYSIS, 2025–2034, (USD MILLION)
FIGURE 113 GCC COUNTRIES EDGE AI ICS CURRENT AND FUTURE END USER ANALYSIS, 2025–2034, (USD MILLION)
FIGURE 114 SAUDI ARABIA EDGE AI ICS CURRENT AND FUTURE TYPE ANALYSIS, 2025–2034, (USD MILLION)
FIGURE 115 SAUDI ARABIA EDGE AI ICS CURRENT AND FUTURE END USER ANALYSIS, 2025–2034, (USD MILLION)
FIGURE 116 UAE EDGE AI ICS CURRENT AND FUTURE TYPE ANALYSIS, 2025–2034, (USD MILLION)
FIGURE 117 UAE EDGE AI ICS CURRENT AND FUTURE END USER ANALYSIS, 2025–2034, (USD MILLION)
FIGURE 118 BAHRAIN EDGE AI ICS CURRENT AND FUTURE TYPE ANALYSIS, 2025–2034, (USD MILLION)
FIGURE 119 BAHRAIN EDGE AI ICS CURRENT AND FUTURE END USER ANALYSIS, 2025–2034, (USD MILLION)
FIGURE 120 KUWAIT EDGE AI ICS CURRENT AND FUTURE TYPE ANALYSIS, 2025–2034, (USD MILLION)
FIGURE 121 KUWAIT EDGE AI ICS CURRENT AND FUTURE END USER ANALYSIS, 2025–2034, (USD MILLION)
FIGURE 122 OMAN EDGE AI ICS CURRENT AND FUTURE TYPE ANALYSIS, 2025–2034, (USD MILLION)
FIGURE 123 OMAN EDGE AI ICS CURRENT AND FUTURE END USER ANALYSIS, 2025–2034, (USD MILLION)
FIGURE 124 QATAR EDGE AI ICS CURRENT AND FUTURE TYPE ANALYSIS, 2025–2034, (USD MILLION)
FIGURE 125 QATAR EDGE AI ICS CURRENT AND FUTURE END USER ANALYSIS, 2025–2034, (USD MILLION)
FIGURE 126 EGYPT EDGE AI ICS CURRENT AND FUTURE TYPE ANALYSIS, 2025–2034, (USD MILLION)
FIGURE 127 EGYPT EDGE AI ICS CURRENT AND FUTURE END USER ANALYSIS, 2025–2034, (USD MILLION)
FIGURE 128 NIGERIA EDGE AI ICS CURRENT AND FUTURE TYPE ANALYSIS, 2025–2034, (USD MILLION)
FIGURE 129 NIGERIA EDGE AI ICS CURRENT AND FUTURE END USER ANALYSIS, 2025–2034, (USD MILLION)
FIGURE 130 SOUTH AFRICA EDGE AI ICS CURRENT AND FUTURE TYPE ANALYSIS, 2025–2034, (USD MILLION)
FIGURE 131 SOUTH AFRICA EDGE AI ICS CURRENT AND FUTURE END USER ANALYSIS, 2025–2034, (USD MILLION)
FIGURE 132 ISRAEL EDGE AI ICS CURRENT AND FUTURE TYPE ANALYSIS, 2025–2034, (USD MILLION)
FIGURE 133 ISRAEL EDGE AI ICS CURRENT AND FUTURE END USER ANALYSIS, 2025–2034, (USD MILLION)
FIGURE 134 REST OF MEA EDGE AI ICS CURRENT AND FUTURE TYPE ANALYSIS, 2025–2034, (USD MILLION)
FIGURE 135 REST OF MEA EDGE AI ICS CURRENT AND FUTURE END USER ANALYSIS, 2025–2034, (USD MILLION)
FIGURE 136 U. S. MARKET SHARE ANALYSIS BY TYPE (2024)
FIGURE 137 U. S. MARKET SHARE ANALYSIS BY END USER (2024)
FIGURE 138 CANADA MARKET SHARE ANALYSIS BY TYPE (2024)
FIGURE 139 CANADA MARKET SHARE ANALYSIS BY END USER (2024)
FIGURE 140 MEXICO MARKET SHARE ANALYSIS BY TYPE (2024)
FIGURE 141 MEXICO MARKET SHARE ANALYSIS BY END USER (2024)
FIGURE 142 CHINA MARKET SHARE ANALYSIS BY TYPE (2024)
FIGURE 143 CHINA MARKET SHARE ANALYSIS BY END USER (2024)
FIGURE 144 JAPAN MARKET SHARE ANALYSIS BY TYPE (2024)
FIGURE 145 JAPAN MARKET SHARE ANALYSIS BY END USER (2024)
FIGURE 146 INDIA MARKET SHARE ANALYSIS BY TYPE (2024)
FIGURE 147 INDIA MARKET SHARE ANALYSIS BY END USER (2024)
FIGURE 148 SOUTH KOREA MARKET SHARE ANALYSIS BY TYPE (2024)
FIGURE 149 SOUTH KOREA MARKET SHARE ANALYSIS BY END USER (2024)
FIGURE 150 SAUDI ARABIA MARKET SHARE ANALYSIS BY TYPE (2024)
FIGURE 151 SAUDI ARABIA MARKET SHARE ANALYSIS BY END USER (2024)
FIGURE 152 UAE MARKET SHARE ANALYSIS BY TYPE (2024)
FIGURE 153 UAE MARKET SHARE ANALYSIS BY END USER (2024)
FIGURE 154 EGYPT MARKET SHARE ANALYSIS BY TYPE (2024)
FIGURE 155 EGYPT MARKET SHARE ANALYSIS BY END USER (2024)
FIGURE 156 NIGERIA MARKET SHARE ANALYSIS BY TYPE (2024)
FIGURE 157 NIGERIA MARKET SHARE ANALYSIS BY END USER (2024)
FIGURE 158 SOUTH AFRICA MARKET SHARE ANALYSIS BY TYPE (2024)
FIGURE 159 SOUTH AFRICA MARKET SHARE ANALYSIS BY END USER (2024)
FIGURE 160 GERMANY MARKET SHARE ANALYSIS BY TYPE (2024)
FIGURE 161 GERMANY MARKET SHARE ANALYSIS BY END USER (2024)
FIGURE 162 FRANCE MARKET SHARE ANALYSIS BY TYPE (2024)
FIGURE 163 FRANCE MARKET SHARE ANALYSIS BY END USER (2024)
FIGURE 164 UK MARKET SHARE ANALYSIS BY TYPE (2024)
FIGURE 165 UK MARKET SHARE ANALYSIS BY END USER (2024)
FIGURE 166 SPAIN MARKET SHARE ANALYSIS BY TYPE (2024)
FIGURE 167 SPAIN MARKET SHARE ANALYSIS BY END USER (2024)
FIGURE 168 ITALY MARKET SHARE ANALYSIS BY TYPE (2024)
FIGURE 169 ITALY MARKET SHARE ANALYSIS BY END USER (2024)
FIGURE 170 BRAZIL MARKET SHARE ANALYSIS BY TYPE (2024)
FIGURE 171 BRAZIL MARKET SHARE ANALYSIS BY END USER (2024)
FIGURE 172 ARGENTINA MARKET SHARE ANALYSIS BY TYPE (2024)
FIGURE 173 ARGENTINA MARKET SHARE ANALYSIS BY END USER (2024)
FIGURE 174 COLUMBIA MARKET SHARE ANALYSIS BY TYPE (2024)
FIGURE 175 COLUMBIA MARKET SHARE ANALYSIS BY END USER (2024)
FIGURE 176 GLOBAL EDGE AI ICS CURRENT AND FUTURE MARKET KEY COUNTRY LEVEL ANALYSIS, 2024–2034, (USD MILLION)
FIGURE 177 FINANCIAL OVERVIEW:
Key Player Analysis
Qualcomm Technologies, Inc.: Qualcomm acts as a market leader in Edge AI ICs in 2025 with strong adoption across smartphones, IoT modules, XR devices, and automotive platforms. Its Snapdragon chipsets integrate AI accelerators that deliver on-device inference for imaging, language models, and sensor fusion. The company continues to expand its AI Engine architecture, which is now deployed across more than one billion active devices. Qualcomm invests heavily in R&D, with annual spending exceeding USD 8 billion, to strengthen its position in low-power AI processing. You see this influence in premium and mid-range smartphones that rely on Qualcomm NPUs for real-time perception.
Strategically, Qualcomm pushes deeper into automotive and industrial edge markets through alliances with automakers, cloud vendors, and robotics companies. Its partnerships with Bosch, AWS, and tier-one automotive suppliers help expand use cases for autonomous functions and smart manufacturing. The firm’s differentiator lies in its ability to scale AI across high-volume consumer devices while moving into higher-value enterprise segments. Its regional strength in North America and Asia supports continued growth in edge AI deployments through 2030.
Apple Inc.: Apple positions itself as an integrated leader with strong control of hardware, software, and services. Its custom silicon, including the A-series and M-series chips, uses dedicated neural engines that handle on-device inference for imaging, voice processing, and personal AI features. By 2025, more than 2 billion active Apple devices run local AI workloads daily, giving Apple one of the largest installed bases of edge AI hardware worldwide. This scale reinforces its ability to introduce private on-device intelligence without relying on external vendors.
Apple expands its AI chip capabilities through consistent advancements in transistor efficiency and memory bandwidth that improve energy use in mobile devices. Its privacy-focused architecture remains a key differentiator. Data stays on the device wherever possible, which appeals to premium users and enterprise buyers. Apple’s long product lifecycle and vertically integrated ecosystem give it a structural advantage as the Edge AI IC market shifts toward personalized AI and multimodal processing at the device level.
Mythic: Mythic operates as a challenger with a focus on analog compute architectures designed for efficient on-device inference. The company targets industrial IoT, smart cameras, wearables, and robotics where customers seek power-efficient solutions for vision and classification tasks. Its chipsets support neural networks at low wattage levels, appealing to OEMs that need compact, low-heat designs. Although Mythic’s market share remains smaller than major digital IC vendors, its technology gains attention from developers seeking alternatives to conventional architectures.
Strategically, Mythic expands through partnerships with module manufacturers and edge device OEMs that integrate its analog AI processors into specialized hardware. The company continues to raise capital to support volume production and product refinement. Its differentiator lies in power efficiency and competitive pricing for inference-heavy workloads. As enterprises and device makers look for alternatives to conventional NPUs, Mythic positions itself to capture demand from niche and emerging edge AI applications through 2030.
Market Key Players
Huawei Technologies Co., Ltd.
Qualcomm Technologies, Inc.
Mythic
NVIDIA Corporation
Samsung
Alphabet Inc.
Apple Inc.
Other Major Players
Arm Limited
Advanced Micro Devices, Inc.
Intel Corporation
Driver:
Proliferation of Connected Devices and Edge Workloads
By 2025, the rapid expansion of connected devices continues to push computing workloads closer to the point of data generation. Consumer electronics, industrial sensors, smart mobility systems, and retail endpoints now account for tens of billions of active IoT nodes globally. These environments demand fast, localized processing to minimize latency and avoid the cost and congestion associated with transmitting large data volumes to centralized cloud platforms.
Demand for Low-Latency and Privacy-Centric AI Processing
Edge AI ICs directly address these requirements by enabling on-device inference, improving real-time responsiveness while strengthening data privacy. As organizations deploy increasing numbers of AI-enabled endpoints across operations, reliance on edge intelligence grows steadily. This demand pattern supports sustained double-digit market growth through 2030, particularly as latency-sensitive applications such as autonomous systems, industrial automation, and smart retail continue to scale.
Restraint:
Thermal Constraints in Compact Edge Devices
Thermal limitations remain one of the most persistent technical challenges for edge AI deployments in 2025. Integrating higher compute density into compact hardware significantly increases heat generation, which can degrade performance or reduce device lifespan. This issue is especially pronounced in space-constrained designs such as wearables, mobile devices, and embedded industrial systems.
Design Complexity and Performance Trade-Offs
Despite advances in heat spreaders, vapor chambers, and low-profile thermal materials, many edge devices must operate within strict thermal envelopes. These constraints limit sustained AI workloads and increase design complexity for chipset integration. As a result, adoption of higher-performance edge AI ICs slows in fanless and battery-operated systems, forcing trade-offs between performance, reliability, and power efficiency.
Opportunity:
Innovation in Power Management Architectures
Advancements in power management architectures present strong growth opportunities for the Edge AI IC market over the coming years. Chip manufacturers are introducing adaptive voltage scaling, segmented power domains, and intelligent workload scheduling to optimize energy consumption across varying operating conditions. These technologies significantly reduce power draw during idle or low-intensity tasks.
Rising Demand for Energy-Efficient Inference Chips
Improved power efficiency extends battery life and enables deployment of more AI features without increasing thermal or power budgets. As industries prioritize energy-efficient hardware to meet sustainability and operational goals, demand for low-power inference chips is expected to grow at annual rates exceeding 30 percent through 2030. This trend opens new opportunities across automotive, industrial, and consumer electronics segments.
Trend:
Emergence of Micro AI at the Edge
Micro AI is gaining momentum in 2025 as manufacturers adopt smaller, optimized models designed to run directly on wearables, sensors, drones, and household devices. These compact AI workloads reduce reliance on cloud connectivity and enable faster, offline decision-making, supporting real-time intelligence in constrained environments.
Standardization of NPUs and Localized Training
Neural Processing Units (NPUs) are increasingly becoming standard components in both consumer and industrial hardware, allowing more complex inference with lower power consumption. In parallel, localized training workloads are expanding through micro data centers at the edge, improving data privacy and reducing cloud-related costs. Together, these trends accelerate the shift toward distributed intelligence and broader real-time AI adoption.
Recent Developments
Dec 2024 – STMicroelectronics: STMicroelectronics launched its STM32N6 microcontroller family, its first series aimed at edge AI and machine learning, enabling image and audio processing locally in consumer and industrial devices and helping reduce data-center traffic and energy use. This launch strengthens STMicroelectronics’ position in the fast-growing microcontroller-class Edge AI IC segment and broadens its reach into cost-sensitive IoT endpoints.
Feb 2025 – NXP Semiconductors: NXP agreed to acquire edge AI specialist Kinara in an all-cash deal valued at around USD 307 million to add dedicated inference accelerators to its automotive and industrial processor portfolio. The transaction deepens NXP’s capabilities for intelligent edge processing and supports higher AI attach rates across its vehicle and industrial SOC lines.
Apr 2025 – Quadric: Quadric’s Chimera QC general-purpose neural processing unit IP was named the 2025 Edge AI and Vision Product of the Year in the Edge AI Processor IP category, highlighting a fully programmable architecture that can deliver up to 864 TOPS of on-device inference. The award lifts Quadric’s profile with chipmakers that license processor IP and supports wider adoption of Chimera cores in future Edge AI IC designs.
Jul 2025 – Hailo: Hailo introduced the Hailo 10H edge AI accelerator, a discrete chip tuned for generative AI at the edge that delivers about 40 TOPS INT4 and 20 TOPS INT8 at roughly 2.5 W, and it is already designed into HP’s AI Accelerator M.2 card for PCs. This launch positions Hailo to capture design wins in client and embedded systems that need local LLM and VLM inference, signalling a new growth pocket in Edge AI IC demand.
Sep 2025 – Qualcomm Technologies: At Snapdragon Summit 2025, Qualcomm announced new Snapdragon platforms with integrated NPUs designed to run agentic AI on-device across smartphones, PCs, and XR hardware, emphasizing local assistants that coordinate tasks and context across devices. This strategy reinforces Qualcomm’s leadership in consumer edge AI silicon and supports sustained growth in on-device inference workloads within the global Edge AI ICs market.