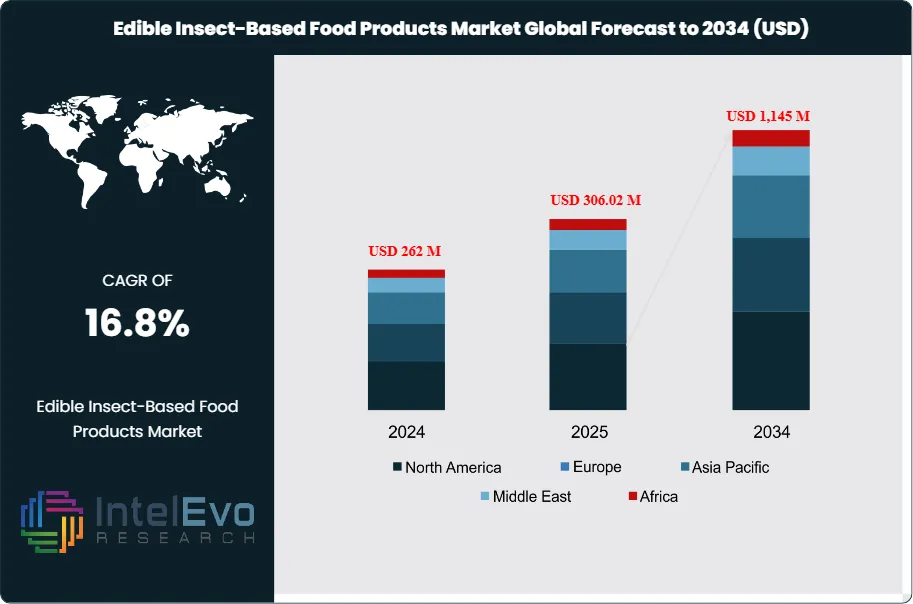
The Edible Insect-Based Food Products Market is projected to reach USD 1,145 Million by 2034, up from USD 262 Million in 2024, growing at a CAGR of 16.8% during the forecast period from 2024 to 2034. This rapid growth is fueled by the rising demand for sustainable protein alternatives, growing health awareness, and the reduced environmental impact of insect farming compared to traditional livestock. With increasing acceptance across Europe, North America, and Asia-Pacific, insect-based foods are emerging as a mainstream solution to global food security challenges.
The global edible insect-based food products market comprises food items derived from insects, such as crickets, mealworms, and grasshoppers. These products are recognized for their high nutritional value, being rich in protein, vitamins, and minerals. The current market is characterized by increasing consumer awareness regarding sustainability and health benefits, as insects require significantly fewer resources to produce compared to traditional livestock. This burgeoning market is driven by the rising popularity of alternative protein sources amid concerns over climate change, food security, and the environmental impact of conventional farming methods.
The growth dynamics of the edible insect market are influenced by several key factors. Firstly, the escalating demand for sustainable and environmentally friendly food sources is propelling market expansion. Consumers are increasingly seeking alternative protein sources that are efficient and less taxing on natural resources. Additionally, the food industry is innovating by incorporating insect protein into various products, such as protein bars, snacks, and animal feed. Furthermore, increased investments in insect farming technologies and processing facilities are improving supply chain efficiency and product availability. The combination of rising health consciousness and environmental concerns creates a robust growth trajectory, with projections indicating a significant CAGR throughout the forecast period.
The edible insect market is experiencing varied growth trends. Asia-Pacific is leading the market, particularly in countries like Thailand and China, where insects have been a traditional food source for centuries. The North American and European markets are witnessing increased interest in edible insects, driven by the growing trend of sustainable eating and rising acceptance of insect-based foods. As consumers become more adventurous and open to trying new food sources, opportunities for market penetration in these regions are expanding. Furthermore, emerging markets in Latin America and Africa are also beginning to adopt edible insects as a viable food option, presenting further growth opportunities.
The COVID-19 pandemic significantly impacted the edible insect market, highlighting the vulnerabilities of global food supply chains. Initially, production and distribution were disrupted due to lockdowns and restrictions. However, the pandemic also prompted a shift in consumer behavior, with increased interest in sustainable food sources and alternative proteins. The crisis underscored the need for resilient food systems, encouraging investments in insect farming and processing technologies. Consequently, the market is rebounding as consumers seek healthier and more sustainable food options in a post-pandemic world.
Key Takeaways
Market Growth: The global edible insect-based food products market is expected to reach USD 1,145 million by 2034, growing at a robust CAGR of approximately 16.8%, indicating strong market expansion fueled by sustainability trends and health consciousness.
Product Type Analysis: Whole insects are gaining popularity for human consumption, driven by their nutritional benefits and traditional culinary practices in regions like Asia. This segment represents a significant portion of the market, appealing to health-conscious consumers.
Application Analysis: The animal feed segment is anticipated to witness substantial growth due to the increasing demand for protein-rich feed alternatives. Insects offer a sustainable solution for livestock and aquaculture, promoting efficient food production.
Driver: Rising awareness of the environmental impact of livestock farming is a significant driver for the edible insect market. Consumers and producers alike are shifting toward sustainable protein sources, with edible insects emerging as a viable alternative.
Restraint: Regulatory challenges and consumer acceptance pose potential restraints. While edible insects are widely consumed in some cultures, gaining acceptance in Western markets remains a challenge, and stringent food safety regulations can hinder growth.
Opportunity: The growing interest in plant-based diets presents a unique opportunity for the edible insect market. By positioning insects as a complementary protein source in various food products, companies can tap into the expanding alternative protein market.
Trend: Increasing innovation in product development is a key trend, with manufacturers creating diverse edible insect-based snacks, protein bars, and baked goods to attract mainstream consumers.
Regional Analysis: The Asia-Pacific region leads the market, particularly in countries like Thailand and China, where insect consumption is culturally entrenched. North America and Europe are gradually adopting edible insects, driven by sustainability trends and health awareness.
Product Type
The edible insect-based food products market is segmented into whole insects, insect powder, insect meal, and insect oil. Whole insects, like crickets and mealworms, are often marketed as snacks or integrated into various dishes, benefiting from traditional acceptance in many cultures. Insect powder is widely used as a protein supplement in protein bars, smoothies, and baked goods, appealing to health-conscious consumers. Insect meal serves mainly in animal feed, providing a sustainable, protein-rich alternative to conventional feed. Additionally, insect oil is gaining recognition as a nutritious ingredient in cooking and food production, valued for its health properties and versatility.
Application
The application segment encompasses human consumption, animal feed, and pet food. Human consumption represents the largest share, driven by rising demand for sustainable protein sources among health-focused consumers. Insects are increasingly incorporated into snacks, protein bars, and gourmet dishes, enhancing their appeal. The animal feed application is experiencing significant growth in aquaculture and livestock sectors, as farmers seek efficient, protein-rich alternatives to reduce the environmental impact of traditional feed. Moreover, the pet food segment is leveraging this trend by offering insect-based formulations that promise enhanced nutrition and sustainability, catering to environmentally conscious pet owners.
Region Analysis
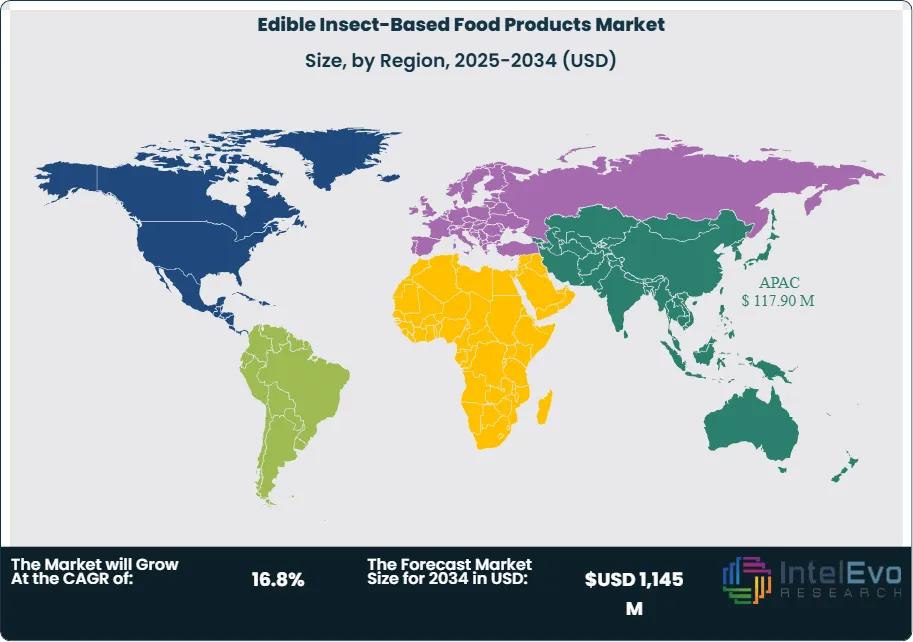
Asia-Pacific Dominates the Edible Insect-Based Food Products Market: Asia-Pacific holds the largest market share in the edible insect-based food products market, accounting for over 45% of the global market. This dominance is attributed to long-standing cultural acceptance of insect consumption in countries like Thailand, China, and Japan, where insects have been integrated into traditional diets for centuries. The region's infrastructure for insect farming is also well-established, facilitating a steady supply of various edible insects. Furthermore, increasing awareness of the nutritional benefits of insects, coupled with government support for sustainable food sources, is propelling market growth. In addition, innovative product offerings, including insect protein bars and snacks, are appealing to health-conscious consumers. The combination of cultural acceptance, robust infrastructure, and innovative product development positions Asia-Pacific as a leader in the market.
North America is the fastest-growing region in the edible insect-based food products market, driven by a significant shift in consumer attitudes towards sustainable protein sources. The rising awareness of environmental issues related to livestock farming, along with increasing interest in health and wellness, is propelling demand for insect-based foods. Innovative product launches, particularly in the snack and protein supplement categories, have captured consumer interest. The region also benefits from a growing number of startups focused on edible insect products, supported by venture capital investments. Europe is also witnessing notable growth, driven by a growing trend towards sustainable food systems and increasing regulations favoring alternative proteins. Meanwhile, regions like Latin America and the Middle East & Africa are gradually adopting edible insects as dietary options, although their market presence remains smaller compared to North America and Asia-Pacific, highlighting potential growth opportunities in these areas.
By Insect Type (Crickets, Mealworms, Grasshoppers, Black Soldier Fly, Others), By Product Type (Insect Protein Powder, Snacks & Bars, Baked Goods & Pasta, Pet Food & Animal Feed, Others), By Form (Whole Insects, Processed / Powdered, Extracts & Concentrates), By Distribution Channel (Online Retail, Supermarkets / Hypermarkets, Specialty Stores, Foodservice / Restaurants)
Research Methodology
Primary Research- 100 Interviews of Stakeholders
Secondary Research
Desk Research
Regional scope
North America (United States, Canada, Mexico)
Latin America (Brazil, Argentina, Columbia)
East Asia And Pacific (China, Japan, South Korea, Australia, Cambodia, Fiji, Indonesia)
Sea And South Asia (India, Singapore, Thailand, Taiwan, Malaysia)
Eastern Europe (Poland, Russia, Czech Republic, Romania)
Western Europe (Germany, U.K., France, Spain, Itlay)
Middle East & Africa (GCC Countries, Egypt, Nigeria, South Africa, Israel)
Customization for segments, region/country-level will be provided. Moreover, additional customization can be done based on the requirements.
Pricing and Purchase Options
Avail customized purchase options to meet your exact research needs. We have three licenses to opt for: Single User License, Multi-User License (Up to 5 Users), Corporate Use License (Unlimited User and Printable PDF).
TABLE OF CONTENTS
1. EXECUTIVE SUMMARY
1.1. MARKET SNAPSHOT
1.2. KEY FINDINGS & INSIGHTS
1.3. ANALYST RECOMMENDATIONS
1.4. FUTURE OUTLOOK
2. RESEARCH METHODOLOGY
2.1. MARKET DEFINITION & SCOPE
2.2. RESEARCH OBJECTIVES: PRIMARY & SECONDARY DATA SOURCES
2.3. DATA COLLECTION SOURCES
2.3.1. COVERAGE OF 100+ PRIMARY RESEARCH/CONSULTATION CALLS WITH INDUSTRY STAKEHOLDERS
FIGURE 17 NORTH AMERICA EDIBLE INSECT-BASED FOOD PRODUCTS CURRENT AND FUTURE TYPE ANALYSIS, 2025–2034, (USD MILLION)
FIGURE 18 NORTH AMERICA EDIBLE INSECT-BASED FOOD PRODUCTS CURRENT AND FUTURE END USER ANALYSIS, 2025–2034, (USD MILLION)
FIGURE 19 MARKET SHARE BY COUNTRY
FIGURE 20 LATIN AMERICA EDIBLE INSECT-BASED FOOD PRODUCTS CURRENT AND FUTURE TYPE ANALYSIS, 2025–2034, (USD MILLION)
FIGURE 21 LATIN AMERICA EDIBLE INSECT-BASED FOOD PRODUCTS CURRENT AND FUTURE END USER ANALYSIS, 2025–2034, (USD MILLION)
FIGURE 22 MARKET SHARE BY COUNTRY
FIGURE 23 EASTERN EUROPE EDIBLE INSECT-BASED FOOD PRODUCTS CURRENT AND FUTURE TYPE ANALYSIS, 2025–2034, (USD MILLION)
FIGURE 24 EASTERN EUROPE EDIBLE INSECT-BASED FOOD PRODUCTS CURRENT AND FUTURE END USER ANALYSIS, 2025–2034, (USD MILLION)
FIGURE 25 MARKET SHARE BY COUNTRY
FIGURE 26 WESTERN EUROPE EDIBLE INSECT-BASED FOOD PRODUCTS CURRENT AND FUTURE TYPE ANALYSIS, 2025–2034, (USD MILLION)
FIGURE 27 WESTERN EUROPE EDIBLE INSECT-BASED FOOD PRODUCTS CURRENT AND FUTURE END USER ANALYSIS, 2025–2034, (USD MILLION)
FIGURE 28 MARKET SHARE BY COUNTRY
FIGURE 29 EAST ASIA AND PACIFIC EDIBLE INSECT-BASED FOOD PRODUCTS CURRENT AND FUTURE TYPE ANALYSIS, 2025–2034, (USD MILLION)
FIGURE 30 EAST ASIA AND PACIFIC EDIBLE INSECT-BASED FOOD PRODUCTS CURRENT AND FUTURE END USER ANALYSIS, 2025–2034, (USD MILLION)
FIGURE 31 MARKET SHARE BY COUNTRY
FIGURE 32 SEA AND SOUTH ASIA EDIBLE INSECT-BASED FOOD PRODUCTS CURRENT AND FUTURE TYPE ANALYSIS, 2025–2034, (USD MILLION)
FIGURE 33 SEA AND SOUTH ASIA EDIBLE INSECT-BASED FOOD PRODUCTS CURRENT AND FUTURE END USER ANALYSIS, 2025–2034, (USD MILLION)
FIGURE 34 MARKET SHARE BY COUNTRY
FIGURE 35 MIDDLE EAST AND AFRICA EDIBLE INSECT-BASED FOOD PRODUCTS CURRENT AND FUTURE TYPE ANALYSIS, 2025–2034, (USD MILLION)
FIGURE 36 MIDDLE EAST AND AFRICA EDIBLE INSECT-BASED FOOD PRODUCTS CURRENT AND FUTURE END USER ANALYSIS, 2025–2034, (USD MILLION)
FIGURE 37 NORTH AMERICA EDIBLE INSECT-BASED FOOD PRODUCTS CURRENT AND FUTURE MARKET VOLUME SHARE REGIONAL ANALYSIS, 2025–2034, (USD MILLION)
FIGURE 38 U.S. EDIBLE INSECT-BASED FOOD PRODUCTS CURRENT AND FUTURE TYPE ANALYSIS, 2025–2034, (USD MILLION)
FIGURE 39 U.S. EDIBLE INSECT-BASED FOOD PRODUCTS CURRENT AND FUTURE END USER ANALYSIS, 2025–2034, (USD MILLION)
FIGURE 40 CANADA EDIBLE INSECT-BASED FOOD PRODUCTS CURRENT AND FUTURE TYPE ANALYSIS, 2025–2034, (USD MILLION)
FIGURE 41 CANADA EDIBLE INSECT-BASED FOOD PRODUCTS CURRENT AND FUTURE END USER ANALYSIS, 2025–2034, (USD MILLION)
FIGURE 42 LATIN AMERICA EDIBLE INSECT-BASED FOOD PRODUCTS CURRENT AND FUTURE MARKET VOLUME SHARE REGIONAL ANALYSIS, 2025–2034, (USD MILLION)
FIGURE 43 MEXICO EDIBLE INSECT-BASED FOOD PRODUCTS CURRENT AND FUTURE TYPE ANALYSIS, 2025–2034, (USD MILLION)
FIGURE 44 MEXICO EDIBLE INSECT-BASED FOOD PRODUCTS CURRENT AND FUTURE END USER ANALYSIS, 2025–2034, (USD MILLION)
FIGURE 45 BRAZIL EDIBLE INSECT-BASED FOOD PRODUCTS CURRENT AND FUTURE TYPE ANALYSIS, 2025–2034, (USD MILLION)
FIGURE 46 BRAZIL EDIBLE INSECT-BASED FOOD PRODUCTS CURRENT AND FUTURE END USER ANALYSIS, 2025–2034, (USD MILLION)
FIGURE 47 ARGENTINA EDIBLE INSECT-BASED FOOD PRODUCTS CURRENT AND FUTURE TYPE ANALYSIS, 2025–2034, (USD MILLION)
FIGURE 48 ARGENTINA EDIBLE INSECT-BASED FOOD PRODUCTS CURRENT AND FUTURE END USER ANALYSIS, 2025–2034, (USD MILLION)
FIGURE 49 COLUMBIA EDIBLE INSECT-BASED FOOD PRODUCTS CURRENT AND FUTURE TYPE ANALYSIS, 2025–2034, (USD MILLION)
FIGURE 50 COLUMBIA EDIBLE INSECT-BASED FOOD PRODUCTS CURRENT AND FUTURE END USER ANALYSIS, 2025–2034, (USD MILLION)
FIGURE 51 REST OF LATIN AMERICA EDIBLE INSECT-BASED FOOD PRODUCTS CURRENT AND FUTURE TYPE ANALYSIS, 2025–2034, (USD MILLION)
FIGURE 52 REST OF LATIN AMERICA EDIBLE INSECT-BASED FOOD PRODUCTS CURRENT AND FUTURE END USER ANALYSIS, 2025–2034, (USD MILLION)
FIGURE 53 EASTERN EUROPE EDIBLE INSECT-BASED FOOD PRODUCTS CURRENT AND FUTURE MARKET VOLUME SHARE REGIONAL ANALYSIS, 2025–2034, (USD MILLION)
FIGURE 54 POLAND EDIBLE INSECT-BASED FOOD PRODUCTS CURRENT AND FUTURE TYPE ANALYSIS, 2025–2034, (USD MILLION)
FIGURE 55 POLAND EDIBLE INSECT-BASED FOOD PRODUCTS CURRENT AND FUTURE END USER ANALYSIS, 2025–2034, (USD MILLION)
FIGURE 56 RUSSIA EDIBLE INSECT-BASED FOOD PRODUCTS CURRENT AND FUTURE TYPE ANALYSIS, 2025–2034, (USD MILLION)
FIGURE 57 RUSSIA EDIBLE INSECT-BASED FOOD PRODUCTS CURRENT AND FUTURE END USER ANALYSIS, 2025–2034, (USD MILLION)
FIGURE 58 CZECH REPUBLIC EDIBLE INSECT-BASED FOOD PRODUCTS CURRENT AND FUTURE TYPE ANALYSIS, 2025–2034, (USD MILLION)
FIGURE 59 CZECH REPUBLIC EDIBLE INSECT-BASED FOOD PRODUCTS CURRENT AND FUTURE END USER ANALYSIS, 2025–2034, (USD MILLION)
FIGURE 60 ROMANIA EDIBLE INSECT-BASED FOOD PRODUCTS CURRENT AND FUTURE TYPE ANALYSIS, 2025–2034, (USD MILLION)
FIGURE 61 ROMANIA EDIBLE INSECT-BASED FOOD PRODUCTS CURRENT AND FUTURE END USER ANALYSIS, 2025–2034, (USD MILLION)
FIGURE 62 REST OF EASTERN EUROPE EDIBLE INSECT-BASED FOOD PRODUCTS CURRENT AND FUTURE TYPE ANALYSIS, 2025–2034, (USD MILLION)
FIGURE 63 REST OF EASTERN EUROPE EDIBLE INSECT-BASED FOOD PRODUCTS CURRENT AND FUTURE END USER ANALYSIS, 2025–2034, (USD MILLION)
FIGURE 64 WESTERN EUROPE EDIBLE INSECT-BASED FOOD PRODUCTS CURRENT AND FUTURE MARKET VOLUME SHARE REGIONAL ANALYSIS, 2025–2034, (USD MILLION)
FIGURE 65 GERMANY EDIBLE INSECT-BASED FOOD PRODUCTS CURRENT AND FUTURE TYPE ANALYSIS, 2025–2034, (USD MILLION)
FIGURE 66 GERMANY EDIBLE INSECT-BASED FOOD PRODUCTS CURRENT AND FUTURE END USER ANALYSIS, 2025–2034, (USD MILLION)
FIGURE 67 FRANCE EDIBLE INSECT-BASED FOOD PRODUCTS CURRENT AND FUTURE TYPE ANALYSIS, 2025–2034, (USD MILLION)
FIGURE 68 FRANCE EDIBLE INSECT-BASED FOOD PRODUCTS CURRENT AND FUTURE END USER ANALYSIS, 2025–2034, (USD MILLION)
FIGURE 69 UK EDIBLE INSECT-BASED FOOD PRODUCTS CURRENT AND FUTURE TYPE ANALYSIS, 2025–2034, (USD MILLION)
FIGURE 70 UK EDIBLE INSECT-BASED FOOD PRODUCTS CURRENT AND FUTURE END USER ANALYSIS, 2025–2034, (USD MILLION)
FIGURE 71 SPAIN EDIBLE INSECT-BASED FOOD PRODUCTS CURRENT AND FUTURE TYPE ANALYSIS, 2025–2034, (USD MILLION)
FIGURE 72 SPAIN EDIBLE INSECT-BASED FOOD PRODUCTS CURRENT AND FUTURE END USER ANALYSIS, 2025–2034, (USD MILLION)
FIGURE 73 ITALY EDIBLE INSECT-BASED FOOD PRODUCTS CURRENT AND FUTURE TYPE ANALYSIS, 2025–2034, (USD MILLION)
FIGURE 74 ITALY EDIBLE INSECT-BASED FOOD PRODUCTS CURRENT AND FUTURE END USER ANALYSIS, 2025–2034, (USD MILLION)
FIGURE 75 REST OF WESTERN EUROPE EDIBLE INSECT-BASED FOOD PRODUCTS CURRENT AND FUTURE TYPE ANALYSIS, 2025–2034, (USD MILLION)
FIGURE 76 REST OF WESTERN EUROPE EDIBLE INSECT-BASED FOOD PRODUCTS CURRENT AND FUTURE END USER ANALYSIS, 2025–2034, (USD MILLION)
FIGURE 77 EAST ASIA AND PACIFIC EDIBLE INSECT-BASED FOOD PRODUCTS CURRENT AND FUTURE MARKET VOLUME SHARE REGIONAL ANALYSIS, 2025–2034, (USD MILLION)
FIGURE 78 CHINA EDIBLE INSECT-BASED FOOD PRODUCTS CURRENT AND FUTURE TYPE ANALYSIS, 2025–2034, (USD MILLION)
FIGURE 79 CHINA EDIBLE INSECT-BASED FOOD PRODUCTS CURRENT AND FUTURE END USER ANALYSIS, 2025–2034, (USD MILLION)
FIGURE 80 JAPAN EDIBLE INSECT-BASED FOOD PRODUCTS CURRENT AND FUTURE TYPE ANALYSIS, 2025–2034, (USD MILLION)
FIGURE 81 JAPAN EDIBLE INSECT-BASED FOOD PRODUCTS CURRENT AND FUTURE END USER ANALYSIS, 2025–2034, (USD MILLION)
FIGURE 82 AUSTRALIA EDIBLE INSECT-BASED FOOD PRODUCTS CURRENT AND FUTURE TYPE ANALYSIS, 2025–2034, (USD MILLION)
FIGURE 83 AUSTRALIA EDIBLE INSECT-BASED FOOD PRODUCTS CURRENT AND FUTURE END USER ANALYSIS, 2025–2034, (USD MILLION)
FIGURE 84 CAMBODIA EDIBLE INSECT-BASED FOOD PRODUCTS CURRENT AND FUTURE TYPE ANALYSIS, 2025–2034, (USD MILLION)
FIGURE 85 CAMBODIA EDIBLE INSECT-BASED FOOD PRODUCTS CURRENT AND FUTURE END USER ANALYSIS, 2025–2034, (USD MILLION)
FIGURE 86 FIJI EDIBLE INSECT-BASED FOOD PRODUCTS CURRENT AND FUTURE TYPE ANALYSIS, 2025–2034, (USD MILLION)
FIGURE 87 FIJI EDIBLE INSECT-BASED FOOD PRODUCTS CURRENT AND FUTURE END USER ANALYSIS, 2025–2034, (USD MILLION)
FIGURE 88 INDONESIA EDIBLE INSECT-BASED FOOD PRODUCTS CURRENT AND FUTURE TYPE ANALYSIS, 2025–2034, (USD MILLION)
FIGURE 89 INDONESIA EDIBLE INSECT-BASED FOOD PRODUCTS CURRENT AND FUTURE END USER ANALYSIS, 2025–2034, (USD MILLION)
FIGURE 90 SOUTH KOREA EDIBLE INSECT-BASED FOOD PRODUCTS CURRENT AND FUTURE TYPE ANALYSIS, 2025–2034, (USD MILLION)
FIGURE 91 SOUTH KOREA EDIBLE INSECT-BASED FOOD PRODUCTS CURRENT AND FUTURE END USER ANALYSIS, 2025–2034, (USD MILLION)
FIGURE 92 REST OF EAST ASIA AND PACIFIC EDIBLE INSECT-BASED FOOD PRODUCTS CURRENT AND FUTURE TYPE ANALYSIS, 2025–2034, (USD MILLION)
FIGURE 93 REST OF EAST ASIA AND PACIFIC EDIBLE INSECT-BASED FOOD PRODUCTS CURRENT AND FUTURE END USER ANALYSIS, 2025–2034, (USD MILLION)
FIGURE 94 SEA AND SOUTH ASIA EDIBLE INSECT-BASED FOOD PRODUCTS CURRENT AND FUTURE MARKET VOLUME SHARE REGIONAL ANALYSIS, 2025–2034, (USD MILLION)
FIGURE 95 BANGLADESH EDIBLE INSECT-BASED FOOD PRODUCTS CURRENT AND FUTURE TYPE ANALYSIS, 2025–2034, (USD MILLION)
FIGURE 96 BANGLADESH EDIBLE INSECT-BASED FOOD PRODUCTS CURRENT AND FUTURE END USER ANALYSIS, 2025–2034, (USD MILLION)
FIGURE 97 NEW ZEALAND EDIBLE INSECT-BASED FOOD PRODUCTS CURRENT AND FUTURE TYPE ANALYSIS, 2025–2034, (USD MILLION)
FIGURE 98 NEW ZEALAND EDIBLE INSECT-BASED FOOD PRODUCTS CURRENT AND FUTURE END USER ANALYSIS, 2025–2034, (USD MILLION)
FIGURE 99 INDIA EDIBLE INSECT-BASED FOOD PRODUCTS CURRENT AND FUTURE TYPE ANALYSIS, 2025–2034, (USD MILLION)
FIGURE 100 INDIA EDIBLE INSECT-BASED FOOD PRODUCTS CURRENT AND FUTURE END USER ANALYSIS, 2025–2034, (USD MILLION)
FIGURE 101 SINGAPORE EDIBLE INSECT-BASED FOOD PRODUCTS CURRENT AND FUTURE TYPE ANALYSIS, 2025–2034, (USD MILLION)
FIGURE 102 SINGAPORE EDIBLE INSECT-BASED FOOD PRODUCTS CURRENT AND FUTURE END USER ANALYSIS, 2025–2034, (USD MILLION)
FIGURE 103 THAILAND EDIBLE INSECT-BASED FOOD PRODUCTS CURRENT AND FUTURE TYPE ANALYSIS, 2025–2034, (USD MILLION)
FIGURE 104 THAILAND EDIBLE INSECT-BASED FOOD PRODUCTS CURRENT AND FUTURE END USER ANALYSIS, 2025–2034, (USD MILLION)
FIGURE 105 TAIWAN EDIBLE INSECT-BASED FOOD PRODUCTS CURRENT AND FUTURE TYPE ANALYSIS, 2025–2034, (USD MILLION)
FIGURE 106 TAIWAN EDIBLE INSECT-BASED FOOD PRODUCTS CURRENT AND FUTURE END USER ANALYSIS, 2025–2034, (USD MILLION)
FIGURE 107 MALAYSIA EDIBLE INSECT-BASED FOOD PRODUCTS CURRENT AND FUTURE TYPE ANALYSIS, 2025–2034, (USD MILLION)
FIGURE 108 MALAYSIA EDIBLE INSECT-BASED FOOD PRODUCTS CURRENT AND FUTURE END USER ANALYSIS, 2025–2034, (USD MILLION)
FIGURE 109 REST OF SEA AND SOUTH ASIA EDIBLE INSECT-BASED FOOD PRODUCTS CURRENT AND FUTURE TYPE ANALYSIS, 2025–2034, (USD MILLION)
FIGURE 110 REST OF SEA AND SOUTH ASIA EDIBLE INSECT-BASED FOOD PRODUCTS CURRENT AND FUTURE END USER ANALYSIS, 2025–2034, (USD MILLION)
FIGURE 111 MIDDLE EAST AND AFRICA EDIBLE INSECT-BASED FOOD PRODUCTS CURRENT AND FUTURE MARKET VOLUME SHARE REGIONAL ANALYSIS, 2025–2034, (USD MILLION)
FIGURE 112 GCC COUNTRIES EDIBLE INSECT-BASED FOOD PRODUCTS CURRENT AND FUTURE TYPE ANALYSIS, 2025–2034, (USD MILLION)
FIGURE 113 GCC COUNTRIES EDIBLE INSECT-BASED FOOD PRODUCTS CURRENT AND FUTURE END USER ANALYSIS, 2025–2034, (USD MILLION)
FIGURE 114 SAUDI ARABIA EDIBLE INSECT-BASED FOOD PRODUCTS CURRENT AND FUTURE TYPE ANALYSIS, 2025–2034, (USD MILLION)
FIGURE 115 SAUDI ARABIA EDIBLE INSECT-BASED FOOD PRODUCTS CURRENT AND FUTURE END USER ANALYSIS, 2025–2034, (USD MILLION)
FIGURE 116 UAE EDIBLE INSECT-BASED FOOD PRODUCTS CURRENT AND FUTURE TYPE ANALYSIS, 2025–2034, (USD MILLION)
FIGURE 117 UAE EDIBLE INSECT-BASED FOOD PRODUCTS CURRENT AND FUTURE END USER ANALYSIS, 2025–2034, (USD MILLION)
FIGURE 118 BAHRAIN EDIBLE INSECT-BASED FOOD PRODUCTS CURRENT AND FUTURE TYPE ANALYSIS, 2025–2034, (USD MILLION)
FIGURE 119 BAHRAIN EDIBLE INSECT-BASED FOOD PRODUCTS CURRENT AND FUTURE END USER ANALYSIS, 2025–2034, (USD MILLION)
FIGURE 120 KUWAIT EDIBLE INSECT-BASED FOOD PRODUCTS CURRENT AND FUTURE TYPE ANALYSIS, 2025–2034, (USD MILLION)
FIGURE 121 KUWAIT EDIBLE INSECT-BASED FOOD PRODUCTS CURRENT AND FUTURE END USER ANALYSIS, 2025–2034, (USD MILLION)
FIGURE 122 OMAN EDIBLE INSECT-BASED FOOD PRODUCTS CURRENT AND FUTURE TYPE ANALYSIS, 2025–2034, (USD MILLION)
FIGURE 123 OMAN EDIBLE INSECT-BASED FOOD PRODUCTS CURRENT AND FUTURE END USER ANALYSIS, 2025–2034, (USD MILLION)
FIGURE 124 QATAR EDIBLE INSECT-BASED FOOD PRODUCTS CURRENT AND FUTURE TYPE ANALYSIS, 2025–2034, (USD MILLION)
FIGURE 125 QATAR EDIBLE INSECT-BASED FOOD PRODUCTS CURRENT AND FUTURE END USER ANALYSIS, 2025–2034, (USD MILLION)
FIGURE 126 EGYPT EDIBLE INSECT-BASED FOOD PRODUCTS CURRENT AND FUTURE TYPE ANALYSIS, 2025–2034, (USD MILLION)
FIGURE 127 EGYPT EDIBLE INSECT-BASED FOOD PRODUCTS CURRENT AND FUTURE END USER ANALYSIS, 2025–2034, (USD MILLION)
FIGURE 128 NIGERIA EDIBLE INSECT-BASED FOOD PRODUCTS CURRENT AND FUTURE TYPE ANALYSIS, 2025–2034, (USD MILLION)
FIGURE 129 NIGERIA EDIBLE INSECT-BASED FOOD PRODUCTS CURRENT AND FUTURE END USER ANALYSIS, 2025–2034, (USD MILLION)
FIGURE 130 SOUTH AFRICA EDIBLE INSECT-BASED FOOD PRODUCTS CURRENT AND FUTURE TYPE ANALYSIS, 2025–2034, (USD MILLION)
FIGURE 131 SOUTH AFRICA EDIBLE INSECT-BASED FOOD PRODUCTS CURRENT AND FUTURE END USER ANALYSIS, 2025–2034, (USD MILLION)
FIGURE 132 ISRAEL EDIBLE INSECT-BASED FOOD PRODUCTS CURRENT AND FUTURE TYPE ANALYSIS, 2025–2034, (USD MILLION)
FIGURE 133 ISRAEL EDIBLE INSECT-BASED FOOD PRODUCTS CURRENT AND FUTURE END USER ANALYSIS, 2025–2034, (USD MILLION)
FIGURE 134 REST OF MEA EDIBLE INSECT-BASED FOOD PRODUCTS CURRENT AND FUTURE TYPE ANALYSIS, 2025–2034, (USD MILLION)
FIGURE 135 REST OF MEA EDIBLE INSECT-BASED FOOD PRODUCTS CURRENT AND FUTURE END USER ANALYSIS, 2025–2034, (USD MILLION)
FIGURE 136 U. S. MARKET SHARE ANALYSIS BY TYPE (2024)
FIGURE 137 U. S. MARKET SHARE ANALYSIS BY END USER (2024)
FIGURE 138 CANADA MARKET SHARE ANALYSIS BY TYPE (2024)
FIGURE 139 CANADA MARKET SHARE ANALYSIS BY END USER (2024)
FIGURE 140 MEXICO MARKET SHARE ANALYSIS BY TYPE (2024)
FIGURE 141 MEXICO MARKET SHARE ANALYSIS BY END USER (2024)
FIGURE 142 CHINA MARKET SHARE ANALYSIS BY TYPE (2024)
FIGURE 143 CHINA MARKET SHARE ANALYSIS BY END USER (2024)
FIGURE 144 JAPAN MARKET SHARE ANALYSIS BY TYPE (2024)
FIGURE 145 JAPAN MARKET SHARE ANALYSIS BY END USER (2024)
FIGURE 146 INDIA MARKET SHARE ANALYSIS BY TYPE (2024)
FIGURE 147 INDIA MARKET SHARE ANALYSIS BY END USER (2024)
FIGURE 148 SOUTH KOREA MARKET SHARE ANALYSIS BY TYPE (2024)
FIGURE 149 SOUTH KOREA MARKET SHARE ANALYSIS BY END USER (2024)
FIGURE 150 SAUDI ARABIA MARKET SHARE ANALYSIS BY TYPE (2024)
FIGURE 151 SAUDI ARABIA MARKET SHARE ANALYSIS BY END USER (2024)
FIGURE 152 UAE MARKET SHARE ANALYSIS BY TYPE (2024)
FIGURE 153 UAE MARKET SHARE ANALYSIS BY END USER (2024)
FIGURE 154 EGYPT MARKET SHARE ANALYSIS BY TYPE (2024)
FIGURE 155 EGYPT MARKET SHARE ANALYSIS BY END USER (2024)
FIGURE 156 NIGERIA MARKET SHARE ANALYSIS BY TYPE (2024)
FIGURE 157 NIGERIA MARKET SHARE ANALYSIS BY END USER (2024)
FIGURE 158 SOUTH AFRICA MARKET SHARE ANALYSIS BY TYPE (2024)
FIGURE 159 SOUTH AFRICA MARKET SHARE ANALYSIS BY END USER (2024)
FIGURE 160 GERMANY MARKET SHARE ANALYSIS BY TYPE (2024)
FIGURE 161 GERMANY MARKET SHARE ANALYSIS BY END USER (2024)
FIGURE 162 FRANCE MARKET SHARE ANALYSIS BY TYPE (2024)
FIGURE 163 FRANCE MARKET SHARE ANALYSIS BY END USER (2024)
FIGURE 164 UK MARKET SHARE ANALYSIS BY TYPE (2024)
FIGURE 165 UK MARKET SHARE ANALYSIS BY END USER (2024)
FIGURE 166 SPAIN MARKET SHARE ANALYSIS BY TYPE (2024)
FIGURE 167 SPAIN MARKET SHARE ANALYSIS BY END USER (2024)
FIGURE 168 ITALY MARKET SHARE ANALYSIS BY TYPE (2024)
FIGURE 169 ITALY MARKET SHARE ANALYSIS BY END USER (2024)
FIGURE 170 BRAZIL MARKET SHARE ANALYSIS BY TYPE (2024)
FIGURE 171 BRAZIL MARKET SHARE ANALYSIS BY END USER (2024)
FIGURE 172 ARGENTINA MARKET SHARE ANALYSIS BY TYPE (2024)
FIGURE 173 ARGENTINA MARKET SHARE ANALYSIS BY END USER (2024)
FIGURE 174 COLUMBIA MARKET SHARE ANALYSIS BY TYPE (2024)
FIGURE 175 COLUMBIA MARKET SHARE ANALYSIS BY END USER (2024)
FIGURE 176 GLOBAL EDIBLE INSECT-BASED FOOD PRODUCTS CURRENT AND FUTURE MARKET KEY COUNTRY LEVEL ANALYSIS, 2024–2034, (USD MILLION)
FIGURE 177 FINANCIAL OVERVIEW:
Key Players Analysis
Entomo Farms: Based in Canada, Entomo Farms specializes in producing crickets and mealworms for human consumption. They offer a variety of products, including whole roasted crickets, cricket flour, and protein bars. Their strategy emphasizes sustainability and nutrition, aiming to raise awareness about the benefits of insect protein while maintaining high standards of farming practices.
Kreca Ento-Food: Located in the Netherlands, Kreca Ento-Food is one of Europe’s leading producers of edible insects. They provide a range of products, from whole insects to insect-based ingredients for food manufacturers. Their business strategy focuses on innovation in food technology, sustainability, and promoting the nutritional advantages of edible insects.
Exo Protein: Exo Protein, based in the United States, is known for its cricket protein bars and snacks. The company targets health-conscious consumers by emphasizing the high protein content and eco-friendliness of its products. Exo aims to create a sustainable protein alternative through strategic partnerships and marketing campaigns that highlight the benefits of edible insects.
Proti-Farm Holding NV: Based in the Netherlands, Proti-Farm specializes in the production of mealworms and cricket-based products for both human and animal consumption. They focus on sustainable farming practices and aim to contribute to global food security. Their business strategy includes expanding their product range and entering new markets to increase their global footprint.
Thai Unique: Thai Unique, operating in Thailand, produces a variety of insect-based snacks, primarily crickets and silk worms. Their strategy is centered around leveraging Thailand's rich culinary tradition and promoting insects as a delicious, nutritious food source. They emphasize traditional recipes and sustainability, catering to both local and international markets.
Enviro Flight LLC: Based in the United States, Enviro Flight specializes in insect protein and sustainable agricultural practices. They utilize black soldier flies to convert organic waste into high-quality protein for animal feed and human consumption. Their business model focuses on waste reduction and circular economy principles.
Eat Grub Ltd: Located in the UK, Eat Grub offers a range of edible insect products, including snacks and protein powders made from crickets and mealworms. Their strategy focuses on educating consumers about the benefits of edible insects and positioning their products as a sustainable and healthy food option.
Deli Bugs Ltd: Deli Bugs, based in the Netherlands, produces various insect-based snacks and ingredients. They aim to make edible insects a mainstream food source through innovative marketing and product development. Their strategy includes focusing on health benefits and environmental sustainability to appeal to a broader audience.
Bugsy Bros: Based in the United States, Bugsy Bros produces cricket-based snacks and protein bars. Their business strategy emphasizes health and sustainability, targeting fitness enthusiasts and eco-conscious consumers. They focus on community engagement and education to promote insect consumption as a viable protein source.
Nordic Insect Economy Ltd: This Finnish Company is focused on producing high-quality edible insect products while promoting sustainable agriculture. They aim to create a local insect farming industry and offer a range of products, from whole insects to protein powders. Their strategy includes research and development to enhance product offerings and improve market acceptance.
Market Key Players
Entomo Farms
Kreca Ento-Food
Exo Protein
Proti-Farm Holding NV
Thai Unique
Enviro Flight LLC
Eat Grub Ltd
Deli Bugs Ltd
Bugsy Bros
Nordic Insect Economy Ltd
Aspire Food Group
Chapul
Mealworm Farming
Future Foods
Insect Protein
YS Foods
Protein Bites
Tiny Farms
Crik Nutrition
Biobites
Protix B.V.
Ynsect
Enterra Feed Corporation
Better Origin
Innovafeed
Hexafly
Beta Bugs
Cricket One
Agriprotein
EnviroFlight
Jimini’s
Drivers
Sustainability and Environmental Concerns
Growing concerns about environmental sustainability are a major driver for the edible insect-based food products market. Traditional livestock farming significantly contributes to greenhouse gas emissions, deforestation, and water depletion. Insects require significantly less land, water, and feed compared to conventional livestock, making them an eco-friendly alternative. The potential to produce high-quality protein with a lower environmental footprint is appealing to both consumers and manufacturers. As more people seek sustainable dietary choices, the demand for insect-based foods is expected to rise, aligning with global efforts to combat climate change and promote food security. Government initiatives and policies that support sustainable agriculture practices further bolster the growth of this market.
Nutritional Benefits
Edible insects are increasingly recognized for their nutritional value, serving as a rich source of protein, vitamins, and essential fatty acids. They contain high-quality protein with all essential amino acids, making them comparable to meat and fish. Insects are also rich in micronutrients such as iron, zinc, and B vitamins, which are crucial for maintaining a healthy diet. As consumers become more health-conscious, they are seeking alternative protein sources that offer not only sustainability but also superior nutritional profiles. The rise of fitness and wellness trends encourages the adoption of high-protein diets, which positions edible insects as a viable option for health-focused individuals. This growing awareness of their nutritional advantages drives the market further.
Innovative Product Development
Innovation in product development is transforming the edible insect market. Companies are creating diverse product offerings, such as protein bars, snacks, and supplements that incorporate insect protein in appealing and accessible formats. This innovation makes edible insects more palatable to a broader audience, especially among younger consumers. Additionally, advancements in food technology are enhancing processing methods, improving taste, texture, and shelf life. This diversification of products is essential for overcoming the initial reluctance some consumers may have towards consuming insects. The introduction of trendy and convenient products is attracting a new customer base, driving market growth. As manufacturers continue to innovate, the acceptance and popularity of edible insects are likely to increase.
Restraints
Regulatory Challenges
Regulatory hurdles pose significant challenges to the growth of the edible insect-based food products market. The approval process for new food products can be lengthy and complex, with various health and safety regulations to comply with. In many countries, insects are not yet recognized as a conventional food source, leading to uncertainties regarding their safety and labeling. This lack of regulatory clarity can deter potential investors and hinder product development. Additionally, manufacturers must navigate different regulatory frameworks across regions, making it difficult to scale operations globally. These challenges can slow market entry and innovation, ultimately affecting the overall growth potential of the industry.
Consumer Perception and Acceptance
Consumer perception remains a significant barrier to the widespread adoption of edible insects. While there is a growing trend towards sustainable and alternative protein sources, many consumers still view insects as unpalatable or culturally unacceptable. This reluctance is particularly pronounced in regions where insect consumption is not part of the traditional diet, such as North America and Europe. Overcoming these ingrained perceptions requires extensive education and marketing efforts to highlight the nutritional benefits and sustainability of insect-based foods. Until consumer acceptance improves, the market may struggle to reach its full potential. Continuous efforts to normalize insect consumption through culinary innovation and marketing campaigns are necessary to address this restraint.
Opportunities
Emerging Markets
Emerging markets present significant growth opportunities for the edible insect-based food products market. As economies in regions like Asia-Pacific, Latin America, and parts of Africa continue to develop, there is increasing demand for affordable and sustainable protein sources. Countries experiencing rapid urbanization and population growth face the challenge of ensuring food security, making insects an attractive solution. Moreover, rising disposable incomes in these regions allow consumers to explore diverse food options, including insect-based products. By targeting these markets with tailored products and educational initiatives, companies can tap into a burgeoning consumer base seeking sustainable dietary alternatives.
Expansion in Food Technology
The advancement of food technology offers substantial opportunities for innovation in the edible insect market. As processing techniques improve, manufacturers can develop new products that enhance taste, texture, and nutritional profiles, making insect-based foods more appealing to mainstream consumers. Technologies such as freeze-drying, powdering, and flavor enhancement can help integrate insects into various food items seamlessly. Furthermore, collaborations with food tech startups and research institutions can lead to breakthroughs in product development and marketing strategies. As technology continues to evolve, it can facilitate the creation of a wider range of insect-based products, catering to diverse consumer preferences and dietary needs.
Trend
Increased Focus on Sustainable Protein Sources
A significant trend in the edible insect-based food products market is the heightened focus on sustainable protein sources amid growing environmental concerns. As consumers become more aware of the ecological impact of traditional livestock farming, they are increasingly turning to alternative proteins that offer lower environmental footprints. Edible insects, which require minimal resources to produce, are gaining traction as a viable solution for sustainable food production. This trend is supported by endorsements from health and wellness influencers and sustainability advocates, promoting insects as a key component in future diets. As sustainability continues to shape consumer choices, the demand for insect-based foods is expected to grow, driving innovation and investment in this segment.
Recent Development
In September 2024: The Dutch company Kreca Ento-Food announced a partnership with Unilever to supply cricket powder for new protein-rich products. This collaboration aims to develop sustainable food options that align with increasing consumer demand for alternative protein sources. Unilever's commitment to sustainability enhances the market's focus on edible insects as a viable food ingredient.
In August 2024: Aspire Food Group, a prominent player in the edible insects industry, launched a new line of protein snacks made from crickets. This product is designed to cater to health-conscious consumers looking for high-protein, low-fat snack options. The launch reflects the growing trend towards incorporating insect protein into everyday diets and aims to promote awareness of its nutritional benefits.
Frequently Asked Questions
How big is the Edible Insect-Based Food Products Market?
The Edible Insect-Based Food Products Market is projected to grow from USD 262M in 2024 to USD 1,145M by 2034 at a CAGR of 16.8%. Rising demand for sustainable proteins, eco-friendly farming, and health-conscious diets is driving this fast-growing global market.
Who are the major players in the Edible Insect-Based Food Products Market?
Which segments covered the Edible Insect-Based Food Products Market?
By Insect Type (Crickets, Mealworms, Grasshoppers, Black Soldier Fly, Others), By Product Type (Insect Protein Powder, Snacks & Bars, Baked Goods & Pasta, Pet Food & Animal Feed, Others), By Form (Whole Insects, Processed / Powdered, Extracts & Concentrates), By Distribution Channel (Online Retail, Supermarkets / Hypermarkets, Specialty Stores, Foodservice / Restaurants)
How can this market research report help my business make strategic decisions?
Our market research reports provide actionable intelligence, including verified market size data, CAGR projections, competitive benchmarking, and segment-level opportunity analysis. These insights support strategic planning, investment decisions, product development, and market entry strategies for enterprises and startups alike.
How frequently is the data updated?
We continuously monitor industry developments and update our reports to reflect regulatory changes, technological advancements, and macroeconomic shifts. Updated editions ensure you receive the latest market intelligence.

 Aerospace And Defence
 Agriculture
 Automotive And Transportation
 Banking And Finance
 Business
 Chemicals And Materials
 Consumer And Retail
 Electronics And Semiconductors
 Food And Beverages
 Machinery & Equipments
 Manufacturing And Construction
 Medical Devices
 Others
 Pharmaceuticals And Healthcare
 Power And Energy
 Sports
 Technology

, Application (Human Consumption, Animal Feed, Pet Food), Distribution Channel (Online, Offline), Region and Key Players - Industry Segment Overview, Market Dynamics, Competitive Strategies, Trends and Forecast 2025-2034")
, Application (Human Consumption, Animal Feed, Pet Food), Distribution Channel (Online, Offline), Region and Key Players - Industry Segment Overview, Market Dynamics, Competitive Strategies, Trends and Forecast 2025-2034")
, Application (Human Consumption, Animal Feed, Pet Food), Distribution Channel (Online, Offline), Region and Key Players - Industry Segment Overview, Market Dynamics, Competitive Strategies, Trends and Forecast 2025-2034")
, Application (Human Consumption, Animal Feed, Pet Food), Distribution Channel (Online, Offline), Region and Key Players - Industry Segment Overview, Market Dynamics, Competitive Strategies, Trends and Forecast 2025-2034")

