EdTech for Early Childhood Market Size, Share & Forecast 2034
Global EdTech for Early Childhood Market Size, Share & Growth Analysis By Product Type (Learning Apps, Interactive Games, Digital Content, AI-Based Platforms), By Deployment Mode (Cloud-Based, On-Premise), By End User (Preschools, Daycare Centers, Parents & Home Learning), By Device Type (Tablets, Smartphones, PCs), By Region & Key Players – Industry Trends, Market Dynamics, Investment Opportunities & Forecast 2025–2034
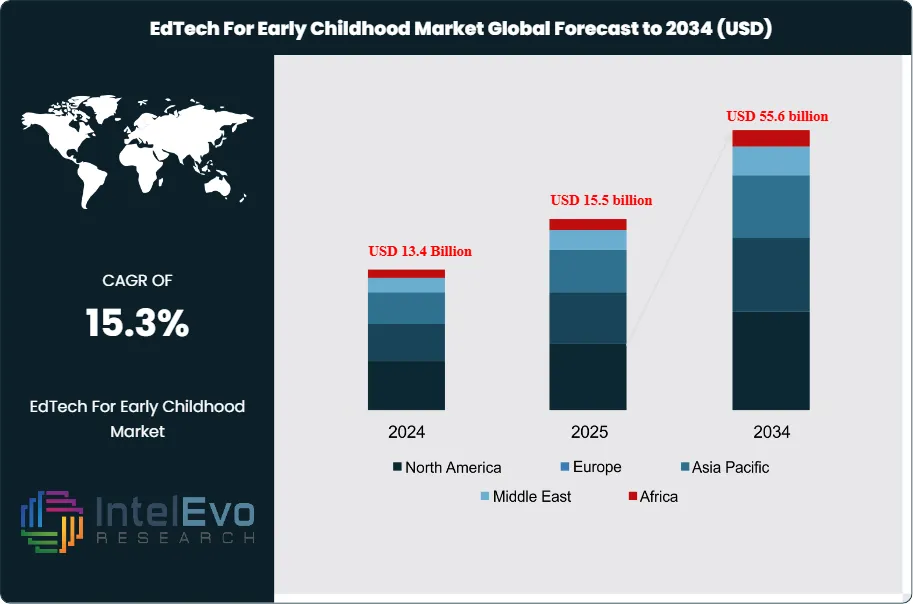
The EdTech for Early Childhood Market is estimated at USD 13.4 billion in 2024 and is on track to reach roughly USD 55.6 billion by 2034, implying a compound annual growth rate (CAGR) of 15.3% over 2025–2034. This strong growth is driven by rising adoption of digital learning tools in preschools and early-grade education, increasing parental focus on foundational skill development, and expanding access to tablets and smart devices among young learners. Government initiatives supporting early education digitization and the integration of AI-powered, gamified, and personalized learning platforms are further accelerating market momentum.
Educational technology for early learners integrates interactive applications, digital storytelling tools, and online games into structured curricula and home-based learning. These solutions target core skills in literacy, numeracy, problem-solving, and socio-emotional development, while enabling educators and parents to monitor progress in real time. The market spans content providers, platform operators, device manufacturers, and connectivity players that together create an increasingly data-rich learning ecosystem.
Demand accelerates as stakeholders recognize that high-quality early childhood education shapes long-term academic and economic outcomes. Parents in both developed and emerging economies show rising willingness to pay for premium digital content, while schools and preschools prioritize hybrid and blended learning models. The surge in connected devices and broadband penetration expands access, yet also intensifies competition, pushing vendors to differentiate through adaptive learning, language localization, and age-appropriate design. The broader EdTech environment reinforces this trajectory, with the corporate EdTech segment valued at about USD 27.5 billion and K–12 usage increasing by close to 99% since 2020, while more than 70% of higher education institutions plan new online undergraduate programs.
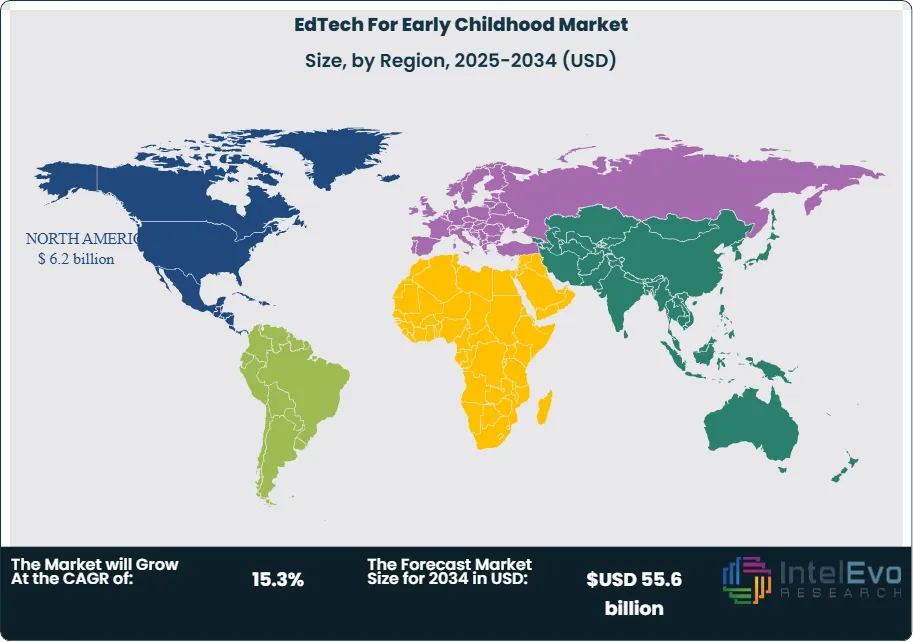
North America remains the largest regional market, generating about USD 6.2 billion in 2024 and accounting for roughly 46.7% of global revenue, supported by high digital infrastructure, strong household spending, and supportive public funding for early years programs. Europe follows with robust regulatory backing for digital inclusion, while Asia Pacific emerges as the fastest-growing region, with double-digit adoption rates in China, India, and Southeast Asia as governments expand connectivity and parents increase discretionary education spending. Emerging markets in Latin America and the Middle East also gain traction as mobile-first models lower entry barriers.
Technology acts as both a growth engine and a source of risk. Artificial intelligence and machine learning enable adaptive pathways that tailor content to the learner’s pace and provide analytics to teachers and caregivers. At the same time, regulators tighten oversight on child data privacy, screen time, and content quality, raising compliance costs and favoring scale players with robust governance frameworks. Market risk also includes widening digital divides, uneven purchasing power, and exposure to macroeconomic cycles that can delay institutional procurement.
Investment interest remains strong as digital products scale efficiently, carry high gross margins, and lend themselves to subscription and freemium models. Suppliers that combine rigorous pedagogy, AI-enabled personalization, and partnerships with schools and governments are positioned to capture share as penetration deepens across both mature and emerging markets.
Key Takeaways
Market Growth: The global EdTech for Early Childhood market stands at 13.4 billion USD, 2024 and is projected to reach 55.6 billion USD, 2034, reflecting a 15.3% CAGR over 2025-2034. This expansion signals sustained budget allocation toward digital tools for early learning across public and private channels.
Segment Dominance: The Nursery Schools segment leads the market with a 37.2% share, 2024, anchored in structured integration of digital content into early learning curricula. This share equates to estimated: 5.0 billion USD, 2024, underscoring its strategic priority for solution providers.
Segment Dominance: The Preschoolers (3–5 years) segment holds more than 53.6% of global revenue, 2024, making it the core age group for EdTech for Early Childhood adoption. The Montessori segment also commands over 32.5% share, 2024, positioning pedagogy-focused platforms as high-value niches within the broader market.
Driver: Rising reliance on private and fee-based early education drives digital adoption, with the Private segment capturing more than 57.2% market share, 2024. This purchasing power concentration supports premium, subscription-based platforms targeting families and institutions with estimated: 8.0 billion USD, 2024 in addressable spend.
Restraint: Gaps in device access, connectivity, and educator digital readiness constrain penetration, particularly outside tier-1 urban centers. Under-served regions represent an estimated: 30.0% of potential demand, 2024, limiting near-term scale for fully digital models.
Opportunity: Vendors can unlock significant upside by tailoring AI-enabled, curriculum-aligned solutions for the dominant Preschoolers segment, which holds 53.6% share, 2024. Adaptive and analytics-driven offerings for this cohort could translate into estimated: 20.0 billion USD, 2034 in high-margin recurring revenue.
Trend: The U.S. market, valued at 5.0 billion USD, 2024, is set to grow at a 16.2% CAGR over 2024-2034, signaling rapid scaling of digital-first early learning models. This pattern confirms a broader shift toward data-informed, platform-based engagement across early childhood settings.
Regional Analysis: North America leads with more than 46.7% share and about 6.2 billion USD in revenue, 2024, driven by high digital infrastructure and strong private expenditure. Asia Pacific and other emerging regions trail but represent estimated: 25.0% of global revenue, 2024, with faster growth trajectories as connectivity and income levels rise.
By Type of Childcare
The childcare landscape continues to shift in 2025 as digital learning tools become a standard part of early education. Nursery schools retain the largest share of activity, accounting for more than 37 percent of market demand in 2024. These institutions serve a wide base of children between ages 1 and 5, which positions them as primary adopters of structured EdTech programs. Your organization will notice that demand increases most rapidly where early learning outcomes carry strong parental priority and where attendance rates remain high across urban and semi-urban settings.
Parents continue to direct significant spending toward digital tools that support social, emotional and cognitive development. This demand accelerates uptake among nursery schools as they add app-based learning, interactive content and progress-tracking platforms. Funding from governments and private operators strengthens this shift. Many institutions now invest in IT infrastructure to support tablet-based learning, literacy platforms and early numeracy modules.
Preschools and kindergarten schools show steady adoption as well, although with varied pace depending on local income levels and institutional budgets. Other childcare settings, including childcare centers, continue to integrate targeted learning modules, often focusing on language, early STEM and motor-skills development. As more providers seek structured digital programs, you will see this segment continue to expand across 2025 to 2030.
By Curriculum
Curriculum preferences influence technology choices across early learning environments. Montessori-aligned programs account for more than 32 percent of digital adoption in 2024. Their emphasis on self-paced learning and hands-on activities aligns with platforms designed to guide children through tasks independently. Parents who prefer activity-based formats adopt these tools rapidly, which supports strong market continuity through 2025.
Demand for Reggio Emilia, Waldorf, play-based and academic programs is also increasing. These formats benefit from digital content that supports open exploration, storytelling, collaborative tasks and structured skill progression. Providers design platforms that track developmental milestones and offer content suited to varied learning styles. This helps educators adjust lesson plans and identify areas where children need additional support.
Hybrid curricula gain traction as schools combine physical materials with digital extensions. Tablets, interactive boards and activity apps supplement worksheets and physical manipulatives. This integrated approach is expected to expand across 2025 as institutions look for consistent ways to monitor progress and maintain instructional alignment across classrooms.
By Age Group
Preschoolers between ages 3 and 5 represent the largest user group for early childhood EdTech, holding more than 53 percent of market activity in 2024. This age group responds strongly to interactive visuals, audio support and short learning modules. You will see high adoption of literacy and numeracy apps, motor-skills games and language-development platforms that match their developmental pace.
Toddlers between ages 1 and 2 adopt digital tools at a slower rate but remain an important expanding segment. Parents use music apps, sensory-focused content and simple exploratory games to supplement early development. Early elementary students between ages 6 and 12 use more structured programs that focus on reading fluency, problem-solving and foundational STEM concepts. Growth in this group increases as schools standardize blended learning models.
Rising comfort with mobile devices continues to push household usage. Tablets remain the preferred device for most parents because of portability and ease of control. As more households integrate digital learning into daily routines, usage patterns will become more consistent across regions through 2030.
By Ownership Structure
Private organizations hold the largest share of early childhood EdTech activity, accounting for more than 57 percent of the market in 2024. Your teams will observe that private operators move quickly to introduce new platforms and update content, which allows them to address shifts in parental expectations. Subscription models, freemium apps and bundled learning packages support broad adoption across households and schools.
Public institutions continue to expand their digital initiatives, particularly in countries that invest in early education reform. Governments allocate portions of their education budgets to infrastructure upgrades, teacher training and standardized learning platforms. Non-profit organizations focus on underserved regions by deploying low-cost tools or offering community-based access to early learning content.
Private providers also form partnerships with schools and curriculum developers at a faster pace than public institutions. These collaborations help standardize content and improve access to structured modules that can be monitored across classrooms.
By Region
North America retains its lead in early childhood EdTech, holding more than 46 percent of global market share and generating about USD 6.2 billion in 2024. High digital readiness, early adoption of learning platforms and strong household spending support continued growth through 2030. The United States remains the largest contributor due to consistent investment in early learning and rising demand for personalized instruction.
Europe maintains steady adoption, led by Germany, the United Kingdom and the Nordic countries. Regulatory support for early education and high broadband penetration help accelerate uptake. Asia Pacific shows the fastest growth, driven by expanding middle-income populations in China, India and Southeast Asia. Rising enrollment in early education and increasing mobile usage contribute to rapid expansion.
Latin America and the Middle East and Africa expand gradually as governments pursue digital learning initiatives. Improvements in connectivity and ongoing private participation will support uptake through the next five years. Emerging markets in these regions represent key opportunities for affordable, mobile-first solutions designed for early learners.
By Type of Childcare, Nursery Schools, Preschools, Kindergarten Schools, Others (Childcare Centers, etc.), By Curriculum, Montessori, Reggio Emilia, Waldorf, Play-based, Academic, Others, By Age Group, Toddlers (1-2 years), Preschoolers (3-5 years), Early Elementary (6-12 years), By Ownership Structure, Private, Public, Non-Profit
Research Methodology
Primary Research- 100 Interviews of Stakeholders
Secondary Research
Desk Research
Regional scope
North America (United States, Canada, Mexico)
Latin America (Brazil, Argentina, Columbia)
East Asia And Pacific (China, Japan, South Korea, Australia, Cambodia, Fiji, Indonesia)
Sea And South Asia (India, Singapore, Thailand, Taiwan, Malaysia)
Eastern Europe (Poland, Russia, Czech Republic, Romania)
Western Europe (Germany, U.K., France, Spain, Itlay)
Middle East & Africa (GCC Countries, Egypt, Nigeria, South Africa, Israel)
Competitive Landscape
La Petite Academy, KinderCare Education, Goddard Schools, Montessori Schools, Children’s Discovery Centers, Kiddie Academy, Gymboree, Primrose Schools, Bright Path Early Learning, Learning Tree International, Bright Horizons Family Solutions, Montessori Children’s House, The Learning Experience, Tutor Time, KinderCare, Others
Customization Scope
Customization for segments, region/country-level will be provided. Moreover, additional customization can be done based on the requirements.
Pricing and Purchase Options
Avail customized purchase options to meet your exact research needs. We have three licenses to opt for: Single User License, Multi-User License (Up to 5 Users), Corporate Use License (Unlimited User and Printable PDF).
TABLE OF CONTENTS
1. EXECUTIVE SUMMARY
1.1. MARKET SNAPSHOT
1.2. KEY FINDINGS & INSIGHTS
1.3. ANALYST RECOMMENDATIONS
1.4. FUTURE OUTLOOK
2. RESEARCH METHODOLOGY
2.1. MARKET DEFINITION & SCOPE
2.2. RESEARCH OBJECTIVES: PRIMARY & SECONDARY DATA SOURCES
2.3. DATA COLLECTION SOURCES
2.3.1. COVERAGE OF 100+ PRIMARY RESEARCH/CONSULTATION CALLS WITH INDUSTRY STAKEHOLDERS
FIGURE 17 NORTH AMERICA EDTECH FOR EARLY CHILDHOOD CURRENT AND FUTURE TYPE ANALYSIS, 2025–2034, (USD MILLION)
FIGURE 18 NORTH AMERICA EDTECH FOR EARLY CHILDHOOD CURRENT AND FUTURE END USER ANALYSIS, 2025–2034, (USD MILLION)
FIGURE 19 MARKET SHARE BY COUNTRY
FIGURE 20 LATIN AMERICA EDTECH FOR EARLY CHILDHOOD CURRENT AND FUTURE TYPE ANALYSIS, 2025–2034, (USD MILLION)
FIGURE 21 LATIN AMERICA EDTECH FOR EARLY CHILDHOOD CURRENT AND FUTURE END USER ANALYSIS, 2025–2034, (USD MILLION)
FIGURE 22 MARKET SHARE BY COUNTRY
FIGURE 23 EASTERN EUROPE EDTECH FOR EARLY CHILDHOOD CURRENT AND FUTURE TYPE ANALYSIS, 2025–2034, (USD MILLION)
FIGURE 24 EASTERN EUROPE EDTECH FOR EARLY CHILDHOOD CURRENT AND FUTURE END USER ANALYSIS, 2025–2034, (USD MILLION)
FIGURE 25 MARKET SHARE BY COUNTRY
FIGURE 26 WESTERN EUROPE EDTECH FOR EARLY CHILDHOOD CURRENT AND FUTURE TYPE ANALYSIS, 2025–2034, (USD MILLION)
FIGURE 27 WESTERN EUROPE EDTECH FOR EARLY CHILDHOOD CURRENT AND FUTURE END USER ANALYSIS, 2025–2034, (USD MILLION)
FIGURE 28 MARKET SHARE BY COUNTRY
FIGURE 29 EAST ASIA AND PACIFIC EDTECH FOR EARLY CHILDHOOD CURRENT AND FUTURE TYPE ANALYSIS, 2025–2034, (USD MILLION)
FIGURE 30 EAST ASIA AND PACIFIC EDTECH FOR EARLY CHILDHOOD CURRENT AND FUTURE END USER ANALYSIS, 2025–2034, (USD MILLION)
FIGURE 31 MARKET SHARE BY COUNTRY
FIGURE 32 SEA AND SOUTH ASIA EDTECH FOR EARLY CHILDHOOD CURRENT AND FUTURE TYPE ANALYSIS, 2025–2034, (USD MILLION)
FIGURE 33 SEA AND SOUTH ASIA EDTECH FOR EARLY CHILDHOOD CURRENT AND FUTURE END USER ANALYSIS, 2025–2034, (USD MILLION)
FIGURE 34 MARKET SHARE BY COUNTRY
FIGURE 35 MIDDLE EAST AND AFRICA EDTECH FOR EARLY CHILDHOOD CURRENT AND FUTURE TYPE ANALYSIS, 2025–2034, (USD MILLION)
FIGURE 36 MIDDLE EAST AND AFRICA EDTECH FOR EARLY CHILDHOOD CURRENT AND FUTURE END USER ANALYSIS, 2025–2034, (USD MILLION)
FIGURE 37 NORTH AMERICA EDTECH FOR EARLY CHILDHOOD CURRENT AND FUTURE MARKET VOLUME SHARE REGIONAL ANALYSIS, 2025–2034, (USD MILLION)
FIGURE 38 U.S. EDTECH FOR EARLY CHILDHOOD CURRENT AND FUTURE TYPE ANALYSIS, 2025–2034, (USD MILLION)
FIGURE 39 U.S. EDTECH FOR EARLY CHILDHOOD CURRENT AND FUTURE END USER ANALYSIS, 2025–2034, (USD MILLION)
FIGURE 40 CANADA EDTECH FOR EARLY CHILDHOOD CURRENT AND FUTURE TYPE ANALYSIS, 2025–2034, (USD MILLION)
FIGURE 41 CANADA EDTECH FOR EARLY CHILDHOOD CURRENT AND FUTURE END USER ANALYSIS, 2025–2034, (USD MILLION)
FIGURE 42 LATIN AMERICA EDTECH FOR EARLY CHILDHOOD CURRENT AND FUTURE MARKET VOLUME SHARE REGIONAL ANALYSIS, 2025–2034, (USD MILLION)
FIGURE 43 MEXICO EDTECH FOR EARLY CHILDHOOD CURRENT AND FUTURE TYPE ANALYSIS, 2025–2034, (USD MILLION)
FIGURE 44 MEXICO EDTECH FOR EARLY CHILDHOOD CURRENT AND FUTURE END USER ANALYSIS, 2025–2034, (USD MILLION)
FIGURE 45 BRAZIL EDTECH FOR EARLY CHILDHOOD CURRENT AND FUTURE TYPE ANALYSIS, 2025–2034, (USD MILLION)
FIGURE 46 BRAZIL EDTECH FOR EARLY CHILDHOOD CURRENT AND FUTURE END USER ANALYSIS, 2025–2034, (USD MILLION)
FIGURE 47 ARGENTINA EDTECH FOR EARLY CHILDHOOD CURRENT AND FUTURE TYPE ANALYSIS, 2025–2034, (USD MILLION)
FIGURE 48 ARGENTINA EDTECH FOR EARLY CHILDHOOD CURRENT AND FUTURE END USER ANALYSIS, 2025–2034, (USD MILLION)
FIGURE 49 COLUMBIA EDTECH FOR EARLY CHILDHOOD CURRENT AND FUTURE TYPE ANALYSIS, 2025–2034, (USD MILLION)
FIGURE 50 COLUMBIA EDTECH FOR EARLY CHILDHOOD CURRENT AND FUTURE END USER ANALYSIS, 2025–2034, (USD MILLION)
FIGURE 51 REST OF LATIN AMERICA EDTECH FOR EARLY CHILDHOOD CURRENT AND FUTURE TYPE ANALYSIS, 2025–2034, (USD MILLION)
FIGURE 52 REST OF LATIN AMERICA EDTECH FOR EARLY CHILDHOOD CURRENT AND FUTURE END USER ANALYSIS, 2025–2034, (USD MILLION)
FIGURE 53 EASTERN EUROPE EDTECH FOR EARLY CHILDHOOD CURRENT AND FUTURE MARKET VOLUME SHARE REGIONAL ANALYSIS, 2025–2034, (USD MILLION)
FIGURE 54 POLAND EDTECH FOR EARLY CHILDHOOD CURRENT AND FUTURE TYPE ANALYSIS, 2025–2034, (USD MILLION)
FIGURE 55 POLAND EDTECH FOR EARLY CHILDHOOD CURRENT AND FUTURE END USER ANALYSIS, 2025–2034, (USD MILLION)
FIGURE 56 RUSSIA EDTECH FOR EARLY CHILDHOOD CURRENT AND FUTURE TYPE ANALYSIS, 2025–2034, (USD MILLION)
FIGURE 57 RUSSIA EDTECH FOR EARLY CHILDHOOD CURRENT AND FUTURE END USER ANALYSIS, 2025–2034, (USD MILLION)
FIGURE 58 CZECH REPUBLIC EDTECH FOR EARLY CHILDHOOD CURRENT AND FUTURE TYPE ANALYSIS, 2025–2034, (USD MILLION)
FIGURE 59 CZECH REPUBLIC EDTECH FOR EARLY CHILDHOOD CURRENT AND FUTURE END USER ANALYSIS, 2025–2034, (USD MILLION)
FIGURE 60 ROMANIA EDTECH FOR EARLY CHILDHOOD CURRENT AND FUTURE TYPE ANALYSIS, 2025–2034, (USD MILLION)
FIGURE 61 ROMANIA EDTECH FOR EARLY CHILDHOOD CURRENT AND FUTURE END USER ANALYSIS, 2025–2034, (USD MILLION)
FIGURE 62 REST OF EASTERN EUROPE EDTECH FOR EARLY CHILDHOOD CURRENT AND FUTURE TYPE ANALYSIS, 2025–2034, (USD MILLION)
FIGURE 63 REST OF EASTERN EUROPE EDTECH FOR EARLY CHILDHOOD CURRENT AND FUTURE END USER ANALYSIS, 2025–2034, (USD MILLION)
FIGURE 64 WESTERN EUROPE EDTECH FOR EARLY CHILDHOOD CURRENT AND FUTURE MARKET VOLUME SHARE REGIONAL ANALYSIS, 2025–2034, (USD MILLION)
FIGURE 65 GERMANY EDTECH FOR EARLY CHILDHOOD CURRENT AND FUTURE TYPE ANALYSIS, 2025–2034, (USD MILLION)
FIGURE 66 GERMANY EDTECH FOR EARLY CHILDHOOD CURRENT AND FUTURE END USER ANALYSIS, 2025–2034, (USD MILLION)
FIGURE 67 FRANCE EDTECH FOR EARLY CHILDHOOD CURRENT AND FUTURE TYPE ANALYSIS, 2025–2034, (USD MILLION)
FIGURE 68 FRANCE EDTECH FOR EARLY CHILDHOOD CURRENT AND FUTURE END USER ANALYSIS, 2025–2034, (USD MILLION)
FIGURE 69 UK EDTECH FOR EARLY CHILDHOOD CURRENT AND FUTURE TYPE ANALYSIS, 2025–2034, (USD MILLION)
FIGURE 70 UK EDTECH FOR EARLY CHILDHOOD CURRENT AND FUTURE END USER ANALYSIS, 2025–2034, (USD MILLION)
FIGURE 71 SPAIN EDTECH FOR EARLY CHILDHOOD CURRENT AND FUTURE TYPE ANALYSIS, 2025–2034, (USD MILLION)
FIGURE 72 SPAIN EDTECH FOR EARLY CHILDHOOD CURRENT AND FUTURE END USER ANALYSIS, 2025–2034, (USD MILLION)
FIGURE 73 ITALY EDTECH FOR EARLY CHILDHOOD CURRENT AND FUTURE TYPE ANALYSIS, 2025–2034, (USD MILLION)
FIGURE 74 ITALY EDTECH FOR EARLY CHILDHOOD CURRENT AND FUTURE END USER ANALYSIS, 2025–2034, (USD MILLION)
FIGURE 75 REST OF WESTERN EUROPE EDTECH FOR EARLY CHILDHOOD CURRENT AND FUTURE TYPE ANALYSIS, 2025–2034, (USD MILLION)
FIGURE 76 REST OF WESTERN EUROPE EDTECH FOR EARLY CHILDHOOD CURRENT AND FUTURE END USER ANALYSIS, 2025–2034, (USD MILLION)
FIGURE 77 EAST ASIA AND PACIFIC EDTECH FOR EARLY CHILDHOOD CURRENT AND FUTURE MARKET VOLUME SHARE REGIONAL ANALYSIS, 2025–2034, (USD MILLION)
FIGURE 78 CHINA EDTECH FOR EARLY CHILDHOOD CURRENT AND FUTURE TYPE ANALYSIS, 2025–2034, (USD MILLION)
FIGURE 79 CHINA EDTECH FOR EARLY CHILDHOOD CURRENT AND FUTURE END USER ANALYSIS, 2025–2034, (USD MILLION)
FIGURE 80 JAPAN EDTECH FOR EARLY CHILDHOOD CURRENT AND FUTURE TYPE ANALYSIS, 2025–2034, (USD MILLION)
FIGURE 81 JAPAN EDTECH FOR EARLY CHILDHOOD CURRENT AND FUTURE END USER ANALYSIS, 2025–2034, (USD MILLION)
FIGURE 82 AUSTRALIA EDTECH FOR EARLY CHILDHOOD CURRENT AND FUTURE TYPE ANALYSIS, 2025–2034, (USD MILLION)
FIGURE 83 AUSTRALIA EDTECH FOR EARLY CHILDHOOD CURRENT AND FUTURE END USER ANALYSIS, 2025–2034, (USD MILLION)
FIGURE 84 CAMBODIA EDTECH FOR EARLY CHILDHOOD CURRENT AND FUTURE TYPE ANALYSIS, 2025–2034, (USD MILLION)
FIGURE 85 CAMBODIA EDTECH FOR EARLY CHILDHOOD CURRENT AND FUTURE END USER ANALYSIS, 2025–2034, (USD MILLION)
FIGURE 86 FIJI EDTECH FOR EARLY CHILDHOOD CURRENT AND FUTURE TYPE ANALYSIS, 2025–2034, (USD MILLION)
FIGURE 87 FIJI EDTECH FOR EARLY CHILDHOOD CURRENT AND FUTURE END USER ANALYSIS, 2025–2034, (USD MILLION)
FIGURE 88 INDONESIA EDTECH FOR EARLY CHILDHOOD CURRENT AND FUTURE TYPE ANALYSIS, 2025–2034, (USD MILLION)
FIGURE 89 INDONESIA EDTECH FOR EARLY CHILDHOOD CURRENT AND FUTURE END USER ANALYSIS, 2025–2034, (USD MILLION)
FIGURE 90 SOUTH KOREA EDTECH FOR EARLY CHILDHOOD CURRENT AND FUTURE TYPE ANALYSIS, 2025–2034, (USD MILLION)
FIGURE 91 SOUTH KOREA EDTECH FOR EARLY CHILDHOOD CURRENT AND FUTURE END USER ANALYSIS, 2025–2034, (USD MILLION)
FIGURE 92 REST OF EAST ASIA AND PACIFIC EDTECH FOR EARLY CHILDHOOD CURRENT AND FUTURE TYPE ANALYSIS, 2025–2034, (USD MILLION)
FIGURE 93 REST OF EAST ASIA AND PACIFIC EDTECH FOR EARLY CHILDHOOD CURRENT AND FUTURE END USER ANALYSIS, 2025–2034, (USD MILLION)
FIGURE 94 SEA AND SOUTH ASIA EDTECH FOR EARLY CHILDHOOD CURRENT AND FUTURE MARKET VOLUME SHARE REGIONAL ANALYSIS, 2025–2034, (USD MILLION)
FIGURE 95 BANGLADESH EDTECH FOR EARLY CHILDHOOD CURRENT AND FUTURE TYPE ANALYSIS, 2025–2034, (USD MILLION)
FIGURE 96 BANGLADESH EDTECH FOR EARLY CHILDHOOD CURRENT AND FUTURE END USER ANALYSIS, 2025–2034, (USD MILLION)
FIGURE 97 NEW ZEALAND EDTECH FOR EARLY CHILDHOOD CURRENT AND FUTURE TYPE ANALYSIS, 2025–2034, (USD MILLION)
FIGURE 98 NEW ZEALAND EDTECH FOR EARLY CHILDHOOD CURRENT AND FUTURE END USER ANALYSIS, 2025–2034, (USD MILLION)
FIGURE 99 INDIA EDTECH FOR EARLY CHILDHOOD CURRENT AND FUTURE TYPE ANALYSIS, 2025–2034, (USD MILLION)
FIGURE 100 INDIA EDTECH FOR EARLY CHILDHOOD CURRENT AND FUTURE END USER ANALYSIS, 2025–2034, (USD MILLION)
FIGURE 101 SINGAPORE EDTECH FOR EARLY CHILDHOOD CURRENT AND FUTURE TYPE ANALYSIS, 2025–2034, (USD MILLION)
FIGURE 102 SINGAPORE EDTECH FOR EARLY CHILDHOOD CURRENT AND FUTURE END USER ANALYSIS, 2025–2034, (USD MILLION)
FIGURE 103 THAILAND EDTECH FOR EARLY CHILDHOOD CURRENT AND FUTURE TYPE ANALYSIS, 2025–2034, (USD MILLION)
FIGURE 104 THAILAND EDTECH FOR EARLY CHILDHOOD CURRENT AND FUTURE END USER ANALYSIS, 2025–2034, (USD MILLION)
FIGURE 105 TAIWAN EDTECH FOR EARLY CHILDHOOD CURRENT AND FUTURE TYPE ANALYSIS, 2025–2034, (USD MILLION)
FIGURE 106 TAIWAN EDTECH FOR EARLY CHILDHOOD CURRENT AND FUTURE END USER ANALYSIS, 2025–2034, (USD MILLION)
FIGURE 107 MALAYSIA EDTECH FOR EARLY CHILDHOOD CURRENT AND FUTURE TYPE ANALYSIS, 2025–2034, (USD MILLION)
FIGURE 108 MALAYSIA EDTECH FOR EARLY CHILDHOOD CURRENT AND FUTURE END USER ANALYSIS, 2025–2034, (USD MILLION)
FIGURE 109 REST OF SEA AND SOUTH ASIA EDTECH FOR EARLY CHILDHOOD CURRENT AND FUTURE TYPE ANALYSIS, 2025–2034, (USD MILLION)
FIGURE 110 REST OF SEA AND SOUTH ASIA EDTECH FOR EARLY CHILDHOOD CURRENT AND FUTURE END USER ANALYSIS, 2025–2034, (USD MILLION)
FIGURE 111 MIDDLE EAST AND AFRICA EDTECH FOR EARLY CHILDHOOD CURRENT AND FUTURE MARKET VOLUME SHARE REGIONAL ANALYSIS, 2025–2034, (USD MILLION)
FIGURE 112 GCC COUNTRIES EDTECH FOR EARLY CHILDHOOD CURRENT AND FUTURE TYPE ANALYSIS, 2025–2034, (USD MILLION)
FIGURE 113 GCC COUNTRIES EDTECH FOR EARLY CHILDHOOD CURRENT AND FUTURE END USER ANALYSIS, 2025–2034, (USD MILLION)
FIGURE 114 SAUDI ARABIA EDTECH FOR EARLY CHILDHOOD CURRENT AND FUTURE TYPE ANALYSIS, 2025–2034, (USD MILLION)
FIGURE 115 SAUDI ARABIA EDTECH FOR EARLY CHILDHOOD CURRENT AND FUTURE END USER ANALYSIS, 2025–2034, (USD MILLION)
FIGURE 116 UAE EDTECH FOR EARLY CHILDHOOD CURRENT AND FUTURE TYPE ANALYSIS, 2025–2034, (USD MILLION)
FIGURE 117 UAE EDTECH FOR EARLY CHILDHOOD CURRENT AND FUTURE END USER ANALYSIS, 2025–2034, (USD MILLION)
FIGURE 118 BAHRAIN EDTECH FOR EARLY CHILDHOOD CURRENT AND FUTURE TYPE ANALYSIS, 2025–2034, (USD MILLION)
FIGURE 119 BAHRAIN EDTECH FOR EARLY CHILDHOOD CURRENT AND FUTURE END USER ANALYSIS, 2025–2034, (USD MILLION)
FIGURE 120 KUWAIT EDTECH FOR EARLY CHILDHOOD CURRENT AND FUTURE TYPE ANALYSIS, 2025–2034, (USD MILLION)
FIGURE 121 KUWAIT EDTECH FOR EARLY CHILDHOOD CURRENT AND FUTURE END USER ANALYSIS, 2025–2034, (USD MILLION)
FIGURE 122 OMAN EDTECH FOR EARLY CHILDHOOD CURRENT AND FUTURE TYPE ANALYSIS, 2025–2034, (USD MILLION)
FIGURE 123 OMAN EDTECH FOR EARLY CHILDHOOD CURRENT AND FUTURE END USER ANALYSIS, 2025–2034, (USD MILLION)
FIGURE 124 QATAR EDTECH FOR EARLY CHILDHOOD CURRENT AND FUTURE TYPE ANALYSIS, 2025–2034, (USD MILLION)
FIGURE 125 QATAR EDTECH FOR EARLY CHILDHOOD CURRENT AND FUTURE END USER ANALYSIS, 2025–2034, (USD MILLION)
FIGURE 126 EGYPT EDTECH FOR EARLY CHILDHOOD CURRENT AND FUTURE TYPE ANALYSIS, 2025–2034, (USD MILLION)
FIGURE 127 EGYPT EDTECH FOR EARLY CHILDHOOD CURRENT AND FUTURE END USER ANALYSIS, 2025–2034, (USD MILLION)
FIGURE 128 NIGERIA EDTECH FOR EARLY CHILDHOOD CURRENT AND FUTURE TYPE ANALYSIS, 2025–2034, (USD MILLION)
FIGURE 129 NIGERIA EDTECH FOR EARLY CHILDHOOD CURRENT AND FUTURE END USER ANALYSIS, 2025–2034, (USD MILLION)
FIGURE 130 SOUTH AFRICA EDTECH FOR EARLY CHILDHOOD CURRENT AND FUTURE TYPE ANALYSIS, 2025–2034, (USD MILLION)
FIGURE 131 SOUTH AFRICA EDTECH FOR EARLY CHILDHOOD CURRENT AND FUTURE END USER ANALYSIS, 2025–2034, (USD MILLION)
FIGURE 132 ISRAEL EDTECH FOR EARLY CHILDHOOD CURRENT AND FUTURE TYPE ANALYSIS, 2025–2034, (USD MILLION)
FIGURE 133 ISRAEL EDTECH FOR EARLY CHILDHOOD CURRENT AND FUTURE END USER ANALYSIS, 2025–2034, (USD MILLION)
FIGURE 134 REST OF MEA EDTECH FOR EARLY CHILDHOOD CURRENT AND FUTURE TYPE ANALYSIS, 2025–2034, (USD MILLION)
FIGURE 135 REST OF MEA EDTECH FOR EARLY CHILDHOOD CURRENT AND FUTURE END USER ANALYSIS, 2025–2034, (USD MILLION)
FIGURE 136 U. S. MARKET SHARE ANALYSIS BY TYPE (2024)
FIGURE 137 U. S. MARKET SHARE ANALYSIS BY END USER (2024)
FIGURE 138 CANADA MARKET SHARE ANALYSIS BY TYPE (2024)
FIGURE 139 CANADA MARKET SHARE ANALYSIS BY END USER (2024)
FIGURE 140 MEXICO MARKET SHARE ANALYSIS BY TYPE (2024)
FIGURE 141 MEXICO MARKET SHARE ANALYSIS BY END USER (2024)
FIGURE 142 CHINA MARKET SHARE ANALYSIS BY TYPE (2024)
FIGURE 143 CHINA MARKET SHARE ANALYSIS BY END USER (2024)
FIGURE 144 JAPAN MARKET SHARE ANALYSIS BY TYPE (2024)
FIGURE 145 JAPAN MARKET SHARE ANALYSIS BY END USER (2024)
FIGURE 146 INDIA MARKET SHARE ANALYSIS BY TYPE (2024)
FIGURE 147 INDIA MARKET SHARE ANALYSIS BY END USER (2024)
FIGURE 148 SOUTH KOREA MARKET SHARE ANALYSIS BY TYPE (2024)
FIGURE 149 SOUTH KOREA MARKET SHARE ANALYSIS BY END USER (2024)
FIGURE 150 SAUDI ARABIA MARKET SHARE ANALYSIS BY TYPE (2024)
FIGURE 151 SAUDI ARABIA MARKET SHARE ANALYSIS BY END USER (2024)
FIGURE 152 UAE MARKET SHARE ANALYSIS BY TYPE (2024)
FIGURE 153 UAE MARKET SHARE ANALYSIS BY END USER (2024)
FIGURE 154 EGYPT MARKET SHARE ANALYSIS BY TYPE (2024)
FIGURE 155 EGYPT MARKET SHARE ANALYSIS BY END USER (2024)
FIGURE 156 NIGERIA MARKET SHARE ANALYSIS BY TYPE (2024)
FIGURE 157 NIGERIA MARKET SHARE ANALYSIS BY END USER (2024)
FIGURE 158 SOUTH AFRICA MARKET SHARE ANALYSIS BY TYPE (2024)
FIGURE 159 SOUTH AFRICA MARKET SHARE ANALYSIS BY END USER (2024)
FIGURE 160 GERMANY MARKET SHARE ANALYSIS BY TYPE (2024)
FIGURE 161 GERMANY MARKET SHARE ANALYSIS BY END USER (2024)
FIGURE 162 FRANCE MARKET SHARE ANALYSIS BY TYPE (2024)
FIGURE 163 FRANCE MARKET SHARE ANALYSIS BY END USER (2024)
FIGURE 164 UK MARKET SHARE ANALYSIS BY TYPE (2024)
FIGURE 165 UK MARKET SHARE ANALYSIS BY END USER (2024)
FIGURE 166 SPAIN MARKET SHARE ANALYSIS BY TYPE (2024)
FIGURE 167 SPAIN MARKET SHARE ANALYSIS BY END USER (2024)
FIGURE 168 ITALY MARKET SHARE ANALYSIS BY TYPE (2024)
FIGURE 169 ITALY MARKET SHARE ANALYSIS BY END USER (2024)
FIGURE 170 BRAZIL MARKET SHARE ANALYSIS BY TYPE (2024)
FIGURE 171 BRAZIL MARKET SHARE ANALYSIS BY END USER (2024)
FIGURE 172 ARGENTINA MARKET SHARE ANALYSIS BY TYPE (2024)
FIGURE 173 ARGENTINA MARKET SHARE ANALYSIS BY END USER (2024)
FIGURE 174 COLUMBIA MARKET SHARE ANALYSIS BY TYPE (2024)
FIGURE 175 COLUMBIA MARKET SHARE ANALYSIS BY END USER (2024)
FIGURE 176 GLOBAL EDTECH FOR EARLY CHILDHOOD CURRENT AND FUTURE MARKET KEY COUNTRY LEVEL ANALYSIS, 2024–2034, (USD MILLION)
FIGURE 177 FINANCIAL OVERVIEW:
Key Player Analysis
BrightPath Early Learning: BrightPath Early learning positions itself as a challenger in the North American early childhood market with a growing footprint across Canada and selected U.S. locations. The group operates more than 85 centers and promotes a proprietary curriculum such as BeeCurious that combines structured academics with play-based experiences for children up to six years old.( BrightPath integrates digital tools into classroom practice and parent communication, using technology partnerships in curriculum, nutrition and activity tracking to standardize quality across sites
Strategically, BrightPath focuses on curriculum refresh and research-led program design rather than rapid franchising. The firm uses updated early childhood pedagogy to refine digital content and to align with provincial and state standards, which can improve occupancy rates and fee resilience. In a market where global EdTech for early childhood is growing at more than 15 percent CAGR through 2034, BrightPath’s controlled expansion, combined with deeper technology integration at center level, positions it as a credible acquisition or partnership target for platforms looking to scale in Canada and the northern U.S.
Primrose Schools: Primrose Schools acts as a clear sector leader with more than 500 schools across 34 U.S. states and a strong franchise model in early childhood education. The company’s Balanced Learning curriculum blends teacher-led instruction with structured play and uses digital platforms to reinforce literacy, numeracy and social-emotional skills. Primrose invests heavily in franchise development; it opened 21 schools in 2024 and plans more than 40 new locations in 2025, with over 200 schools in the pipeline. This scale gives Primrose strong purchasing power for EdTech solutions and allows rapid deployment of new tools across its network.
Kiddie Academy: Kiddie Academy positions itself as a strong challenger with a broad U.S. footprint and a curriculum-centered brand. The company operates more than 320 open academies in over 35 states and the District of Columbia, serving around 38,000 children across infant, toddler, preschool and school-age programs. Its proprietary Life Essentials curriculum, relaunched in 2024, emphasizes academic skills, character development and critical thinking, and increasingly incorporates technology-supported learning experiences. The network has demonstrated that its system-wide curriculum can exceed early learning standards in states such as Utah, which strengthens its positioning when districts and parents compare outcomes.
Market Key Players
La Petite Academy
KinderCare Education
Goddard Schools
Montessori Schools
Children’s Discovery Centers
Kiddie Academy
Gymboree
Primrose Schools
Bright Path Early Learning
Learning Tree International
Bright Horizons Family Solutions
Montessori Children’s House
The Learning Experience
Tutor Time
KinderCare
Others
Driver
Rising Policy Focus on Foundational Learning
By 2025, early childhood education will be a priority for policymakers and private operators. They are responding to growing concerns about foundational learning outcomes. Public spending on early learning programs is rising, with many countries putting more of their education budgets into digital content for children aged 1 to 6. This trend increases the demand for structured EdTech platforms that support literacy, numeracy, and cognitive development on a large scale. Governments and non-profit organizations are promoting public-private partnerships to boost digital inclusion in early education. These efforts create more opportunities for EdTech vendors and encourage standardized use in preschools and childcare centers. As a result, demand driven by policy is becoming a stable and long-term growth factor for the market.
Expanding Access Through Connectivity and Devices
Making devices more affordable and improving broadband coverage are supporting market growth. Tablets and smartphones are becoming easier for households in emerging economies to access, allowing young children to be introduced to digital learning tools earlier. This accessibility helps EdTech providers connect with communities that previously relied on traditional, resource-limited teaching methods. At home, parents are increasingly using digital platforms to support formal education. The blend of institutional use and home learning expands overall demand, leading to consistent user engagement and recurring subscription revenues for platform providers.
Restraint
Uneven Digital Literacy Among Caregivers
A major challenge in 2025 is the uneven digital literacy among parents and caregivers. Many households, especially in rural or low-income areas, struggle with basic device navigation and content selection. This gap limits effective use of early learning platforms and prevents better learning outcomes, even with platforms available. Research across OECD and developing countries shows that many parents still see digital learning as passive screen time rather than active instruction. Without adequate involvement from caregivers, platforms cannot deliver their full educational value, leading to slow adoption and retention in several markets.
Concerns Around Screen Time and Child Development
Worries about screen time are another barrier affecting purchasing choices. Pediatric guidelines in many countries warn against too much digital exposure for young children, making parents and educators hesitant. These worries directly affect how long platforms are used and how acceptably content is viewed. EdTech providers must find a balance between engagement and appropriate development. If they do not address these concerns with clear design, usage controls, and tools for parental guidance, trust can be weakened, and growth may slow, especially in highly regulated or education-focused markets.
Opportunity
Growth of Gamified and Adaptive Learning
Gamified learning is one of the most promising commercial opportunities in the market. Global spending on early learning applications is expected to grow at an annual rate higher than 14% through 2030 as parents look for engaging and effective tools. Game elements like rewards, progress tracking, and milestone achievements help maintain focus and promote independent learning. Platforms that adjust difficulty based on real-time performance gain a competitive advantage. These systems tailor learning journeys, enhancing retention and perceived value for both parents and institutions.
Demand for Measurable Learning Outcomes
As buyers focus more on accountability, there is a growing demand for platforms that offer tracking of developmental progress and analytics. Parents and schools want clear insights into literacy improvements, numeracy skills, and behavioral development. This change opens doors for providers that merge gamification with assessment dashboards and reporting tools. Solutions that show measurable progress are better positioned to secure institutional contracts and long-term subscriptions.
Trend
Integration of AI in Early Learning Platforms
In 2025, the market is moving toward AI-supported instruction that adjusts to each child’s pace and style of learning. Early-stage AI models can now modify prompts, content order, and difficulty levels in real time, providing more personalized learning experiences. The adoption of these tools is speeding up as schools and parents look for consistency in progress tracking. AI-driven platforms lessen the need for manual supervision while keeping structured learning paths intact.
Rising Focus on Social-Emotional Learning
Social-emotional learning (SEL) is becoming a key trend in early childhood EdTech. Providers are going beyond academic content to include activities that develop communication, empathy, and self-regulation skills. Interactive storytelling, role-play simulations, and emotion-recognition games are gaining popularity. This trend positions EdTech platforms as not just academic tools, but as well-rounded developmental solutions, increasing their significance across various education systems.
Recent Developments
Dec2024 - Hatch Early Learning: Hatch Early Learning released Ignite v5.4, adding 29 new English first-grade guided practice games and new cache management options that let schools cap storage at 2–4 GB on tablets and mobile devices. This upgrade signals a stronger fit for districts with device constraints and keeps Ignite competitive as a core early learning platform in 1:1 and shared-device environments.
Apr2025 - Khan Academy: Khan Academy expanded its work on playful, low-stakes Pre-K assessments within Khan Academy Kids, which now reaches over 2 million children each month in homes and classrooms worldwide. For your early childhood portfolio, this shift toward integrated assessment inside a free app strengthens Khan Academy’s position as a reference platform for foundational skills and outcomes measurement.
Jul2025 - ClassDojo: ClassDojo launched new districtwide features for the 2025–26 school year, including AI-assisted teacher tools, SMS alerts, and unified communication controls for administrators, while keeping the product free for partner districts. For investors and operators, the move builds on ClassDojo’s footprint in roughly 90% of U.S. schools and its 20 million daily messages to deepen reliance on the platform across pre-K and early grades.
Sep2025 - Age of Learning (ABCmouse 2 – NASA Partnership): Age of Learning announced a partnership between ABCmouse 2 and NASA to deliver space-themed videos, games, and activities for children aged 2–8, with a portion of the content available at no cost and additional modules rolling out through 2026. This collaboration links a platform that has served over 50 million children worldwide with a premium STEM content brand, reinforcing ABCmouse 2 as a preferred early science learning environment.
Nov 2025 - Age of Learning (ABCmouse 2 – Google Play Award): In November 2025, ABCmouse 2 received the Google Play Best of 2025 Award in the “Best for Families” category, recognizing its early learning app across seven major markets and more than 13,000 activities that can deliver roughly 2x gains in reading and math for regular users. This recognition strengthens Age of Learning’s consumer brand in early childhood and supports pricing power and partner negotiations in a market where app-store rankings strongly influence parent adoption.