
- Home
- Industries
 Aerospace And Defence
 Agriculture
 Automotive And Transportation
 Banking And Finance
 Business
 Chemicals And Materials
 Consumer And Retail
 Electronics And Semiconductors
 Food And Beverages
 Machinery & Equipments
 Manufacturing And Construction
 Medical Devices
 Others
 Pharmaceuticals And Healthcare
 Power And Energy
 Sports
 Technology
- Services
- News Room
- About us
- Contact Us
-
Electrical Contacts Market Size, Share & Growth Analysis 2025–2034
Global Electrical Contacts Market Size, Share & Industry Analysis By Material Type (Silver, Copper, Palladium, Silver Alloys), By Product Type (Switch Contacts, Relay Contacts, Circuit Breaker Contacts, Connector Contacts), By Application (Electric Vehicles, Industrial Automation, Power Distribution, Smart Grids, Renewable Energy, Consumer Electronics), By End-Use (Automotive, Industrial, Utilities, Electronics), Regional Outlook, Competitive Landscape, Market Dynamics, Key Trends & Forecast 2025–2034

Report Overview
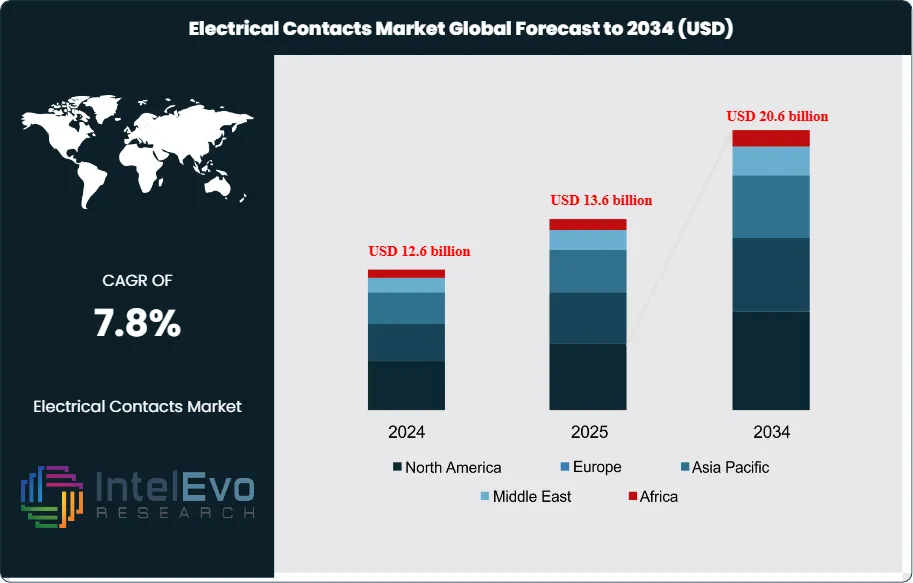
The Electrical Contacts Market is estimated at USD 12.6 billion in 2024 and is on track to reach roughly USD 20.6 billion by 2034, implying a compound annual growth rate (CAGR) of 7.8% over 2025–2034. This robust expansion is driven by accelerating global electrification, rising adoption of electric vehicles, and large-scale investments in smart grids and renewable energy infrastructure. Increasing demand for high-performance, durable contact materials in automation, industrial equipment, and EV charging systems is further strengthening market momentum. As industries prioritize energy efficiency, reliability, and digital integration, electrical contacts are emerging as a critical enabling component across next-generation power and control systems.
Get More Information about this report -
Request Free Sample ReportElectrical contacts, which enable or interrupt current flow in switches, relays, circuit breakers, and connectors, remain fundamental to the functioning of modern electrical systems. Their role spans across power generation, industrial automation, automotive, consumer electronics, and telecommunications, making them a critical component of global electrification.
Market expansion reflects both structural and cyclical forces. Historically, demand has tracked electricity consumption and industrial output, with copper and silver-based contacts dominating due to their conductivity and durability. Recent years have seen a shift toward higher-performance alloys and eco-friendly materials as manufacturers respond to sustainability pressures and regulatory standards. The modernization of power infrastructure, particularly the integration of renewable energy and smart grids, is accelerating adoption. For example, conditional approvals for cross-border electricity imports, such as the 1.75 GW import agreement from Australia, highlight the scale of grid interconnection projects that require reliable switching components.
On the demand side, rising electricity consumption, the push for uninterrupted power supply, and the electrification of transport are key growth drivers. The global stock of electric vehicles exceeded 40 million units in 2024, and charging infrastructure expansion is directly increasing the need for high-performance contacts. On the supply side, volatility in raw material prices, particularly silver, poses a challenge, while manufacturers face pressure to balance cost efficiency with performance reliability. Regulatory frameworks, including safety standards for switchgear and environmental rules on material use, are shaping procurement strategies and product development.
Technology is reshaping the market. Digitalization of grid systems, automation in industrial facilities, and the adoption of high-voltage direct current (HVDC) transmission are creating demand for advanced contact solutions. AI-enabled monitoring of switchgear and predictive maintenance systems are also influencing design requirements, as utilities and manufacturers seek to reduce downtime and extend equipment lifecycles.
Regionally, Asia-Pacific leads in consumption, driven by large-scale industrialization and infrastructure investment in China and India. Europe is advancing through renewable integration and grid modernization, while North America is investing heavily in EV charging networks and smart grid upgrades. Emerging markets in Latin America and the Middle East are expected to attract investor attention as they expand power capacity and modernize distribution networks. For investors, the strongest opportunities lie in eco-friendly materials, HVDC infrastructure, and applications linked to electric mobility.
, By Product Type (Switch Contacts, Relay Contacts, Circuit Breaker Contacts, Connector Contacts), By Application (Electric Vehicles, Industrial Automation, Power Distribution, Smart Grids, Renewable Energy, Consumer Electronics), By End-Use (Automotive, Industrial, Utilities, Electronics), Regional Outlook, Competitive Landscape, Market Dynamics, Key Trends & Forecast 2025–2034")
Key Takeaways
- Market Growth: The global electrical contacts market is valued at USD 12.6 billion in 2024 and is projected to reach USD 20.6 billion by 2034, expanding at a CAGR of 7.8% over 2025–2034. Growth is supported by rising electricity demand, industrial automation, and the expansion of renewable energy and smart grid infrastructure.
- Material Type: Silver-based contacts account for 56.8% of global revenue due to superior conductivity and durability. Their use remains critical in high-performance applications such as switchgear, relays, and automotive electronics.
- Product Form: Rivet-type contacts represent 53.1% of the market, reflecting their cost efficiency and long service life in high-volume switching devices. Their adoption is particularly strong in consumer appliances and industrial control systems.
- Voltage Class: Low-voltage contacts hold 69.3% share, driven by widespread integration in household appliances, telecom equipment, and industrial automation. The segment benefits from rising demand for compact, reliable switching solutions in electronics.
- End Use: Electronics and telecommunications lead with 37.4% of demand, supported by global digital infrastructure growth and the rapid expansion of 5G networks. This sector’s reliance on high-reliability switching components positions it as a long-term growth driver.
- Driver: Electrification of transport is accelerating demand. With global electric vehicle stock surpassing 40 million units in 2024, charging infrastructure expansion is directly increasing the need for high-performance electrical contacts.
- Restraint: Volatility in raw material prices, particularly silver, is pressuring margins. A 15% rise in silver prices in 2023 increased input costs for manufacturers, limiting profitability and creating supply chain risks.
- Opportunity: High-voltage direct current (HVDC) systems present a strong growth avenue. Global HVDC transmission capacity is projected to expand by over 35% by 2030, creating demand for advanced contact materials capable of handling higher loads.
- Trend: Manufacturers are shifting toward eco-friendly alloys and recyclable materials. Companies such as TE Connectivity and Siemens are investing in sustainable contact solutions to align with regulatory requirements and corporate net-zero targets.
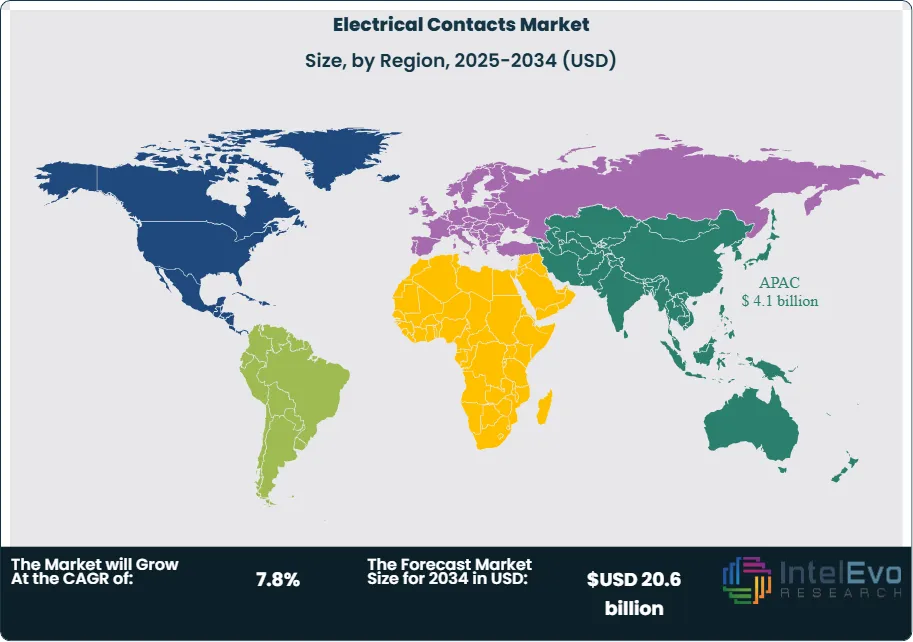
- Regional Analysis: Asia-Pacific leads with over 40% of global revenue, supported by industrial growth in China and India. Europe is advancing through renewable integration and grid modernization, while North America is expanding EV charging networks. Emerging markets in Latin America and the Middle East are expected to post above-average CAGR through 2034 as they expand power infrastructure.
Type Analysis
Silver-based materials continue to dominate the electrical contacts market in 2025, accounting for an estimated 56.8% of global revenue. Their leadership is rooted in superior electrical and thermal conductivity, which ensures minimal resistance and high reliability in current transfer. These properties make silver the preferred choice for critical applications such as switches, relays, and circuit breakers, where operational stability and safety are non-negotiable.
The reliance on silver-based contacts reflects the growing demand for durable and efficient materials in both low- and high-voltage systems. Manufacturers are increasingly adopting silver alloys to balance cost pressures with performance requirements, particularly as raw material volatility remains a challenge. Advances in coating technologies and alloy formulations are extending product lifecycles, reducing maintenance needs, and reinforcing silver’s position as the benchmark material in the segment.
Looking ahead, silver-based contacts are expected to retain their dominance as industries prioritize energy efficiency and precision. However, copper- and palladium-based alternatives are gaining traction in cost-sensitive and specialized applications, suggesting a gradual diversification of material use across the market.
Electrical Contact Analysis
Rivet-type contacts hold the largest share of the market in 2025, representing approximately 53.1% of global demand. Their dominance is attributed to durability, ease of integration, and consistent performance under mechanical stress. These contacts are widely deployed in relays, switches, and contactors, where repeated operations and stable conductivity are essential.
The cost-effectiveness of rivet-type designs has further strengthened their adoption across industrial and residential systems. Their ability to bond securely with base metals and withstand high usage environments makes them a dependable choice for manufacturers seeking reliability at scale. This has positioned rivet-type contacts as the default solution in control systems and circuit protection devices.
With infrastructure modernization and automation expanding globally, rivet-type contacts are expected to maintain their leadership. However, plate-type and material-wire configurations are gaining relevance in specialized applications, particularly in aerospace and automotive systems where weight reduction and compact design are critical.
Application Analysis
Low-voltage products remain the largest application segment in 2025, accounting for nearly 69.3% of total market usage. Electrical contacts in this category are integral to circuit breakers, switches, connectors, and residential wiring devices. The dominance of this segment reflects the widespread reliance on low-voltage systems across households, commercial facilities, and industrial automation.
The segment’s strength is reinforced by the global expansion of smart homes, digital control panels, and low-voltage distribution networks. Electrical contacts in these systems ensure safe current transfer, protect against overloads, and support automation processes. Manufacturers are focusing on arc resistance, durability, and compact designs to meet rising expectations for efficiency and long service life.
As infrastructure modernization accelerates, low-voltage products are expected to remain at the forefront of demand. Medium- and high-voltage applications, however, are gaining momentum in power generation, grid upgrades, and renewable energy projects, creating new opportunities for advanced contact solutions.
End-User Analysis
Electronics and telecommunications lead the end-user landscape in 2025, capturing around 37.4% of global demand. The segment’s growth is driven by the proliferation of consumer electronics, mobile devices, and communication infrastructure. Electrical contacts are essential in ensuring precise signal transmission and reliable power delivery in compact assemblies such as smartphones, routers, and network switches.
The expansion of 5G networks and high-speed data infrastructure is further accelerating demand for advanced contact solutions. Miniaturized, corrosion-resistant materials are increasingly required to support high-frequency and low-voltage operations in next-generation devices. This trend is reshaping product development strategies, with manufacturers prioritizing performance consistency and durability in smaller form factors.
While electronics and telecommunications remain dominant, automotive and aerospace applications are emerging as high-growth areas. The electrification of vehicles and the adoption of advanced avionics systems are creating new demand for high-performance electrical contacts capable of withstanding extreme operating conditions.
Regional Analysis
Asia-Pacific continues to lead the global electrical contacts market in 2025, holding an estimated 38.7% share valued at over USD 4.1 billion. The region’s dominance is supported by large-scale industrial automation, consumer electronics manufacturing, and rapid electrification initiatives in China, India, Japan, and Southeast Asia. Strong investment in grid modernization and renewable energy projects has further reinforced demand across residential, commercial, and industrial sectors.
North America and Europe remain critical markets, driven by investments in electric mobility, smart grid infrastructure, and renewable integration. In the United States, the expansion of EV charging networks is a key driver, while Europe’s regulatory push toward net-zero targets is accelerating adoption of advanced contact materials.
Emerging regions such as Latin America and the Middle East & Africa are expected to post above-average growth through 2034. Infrastructure expansion, rising electricity demand, and industrial development are creating new opportunities for suppliers. These markets, while smaller in absolute value, are becoming important investment hotspots for manufacturers seeking long-term growth.
Get More Information about this report -
Request Free Sample ReportKey Market Segments
By Type
- Silver-Based Materials
- Copper-Based Materials
- Gold-Based Materials
- Palladium-Based Materials
- Others
By Electrical Contact
- Rivet-Type
- Plate-Type
- Material-Wire
By Applications
- Low-Voltage Products
- Switches
- Relays
- Connectors
- Others
- Medium and High Voltage Products
- Circuit Breakers
- Transformers
- Generators
- Others
By End-User
- Electronics and Telecommunication
- Power Distribution Center
- Automotive
- Aerospace
- Others
Regions
- North America
- Latin America
- East Asia And Pacific
- Sea And South Asia
- Eastern Europe
- Western Europe
- Middle East & Africa
| Report Attribute | Details |
| Market size (2024) | USD 12.6 billion |
| Forecast Revenue (2034) | USD 20.6 billion |
| CAGR (2024-2034) | 7.8% |
| Historical data | 2020-2023 |
| Base Year For Estimation | 2024 |
| Forecast Period | 2025-2034 |
| Report coverage | Revenue Forecast, Competitive Landscape, Market Dynamics, Growth Factors, Trends and Recent Developments |
| Segments covered | By Type, (Silver-Based Materials, Copper-Based Materials, Gold-Based Materials, Palladium-Based Materials, Others), By Electrical Contact, (Rivet-Type, Plate-Type, Material-Wire), By Applications, (Low-Voltage Products, (Switches, Relays, Connectors, Others), Medium and High Voltage Products, (Circuit Breakers, Transformers, Generators, Others)), By End-User, (Electronics and Telecommunication, Power Distribution Center, Automotive, Aerospace, Others) |
| Research Methodology |
|
| Regional scope |
|
| Competitive Landscape | Longsun Group Co., Ltd., Heraeus Group, Wenzhou Hongfeng Electrical Alloy Co., Ltd., Materion Corporation, Chugai Electric Industrial Co., Ltd., Modison Limited, Umicore, Nippon Tungsten Co., Ltd., METALOR Technologies SA, Taewon Precision Company, Zhejiang Fuda Alloy Materials Technology Co., Ltd., Electrical Contacts, Ltd. |
| Customization Scope | Customization for segments, region/country-level will be provided. Moreover, additional customization can be done based on the requirements. |
| Pricing and Purchase Options | Avail customized purchase options to meet your exact research needs. We have three licenses to opt for: Single User License, Multi-User License (Up to 5 Users), Corporate Use License (Unlimited User and Printable PDF). |
, By Product Type (Switch Contacts, Relay Contacts, Circuit Breaker Contacts, Connector Contacts), By Application (Electric Vehicles, Industrial Automation, Power Distribution, Smart Grids, Renewable Energy, Consumer Electronics), By End-Use (Automotive, Industrial, Utilities, Electronics), Regional Outlook, Competitive Landscape, Market Dynamics, Key Trends & Forecast 2025–2034")
, By Product Type (Switch Contacts, Relay Contacts, Circuit Breaker Contacts, Connector Contacts), By Application (Electric Vehicles, Industrial Automation, Power Distribution, Smart Grids, Renewable Energy, Consumer Electronics), By End-Use (Automotive, Industrial, Utilities, Electronics), Regional Outlook, Competitive Landscape, Market Dynamics, Key Trends & Forecast 2025–2034")
, By Product Type (Switch Contacts, Relay Contacts, Circuit Breaker Contacts, Connector Contacts), By Application (Electric Vehicles, Industrial Automation, Power Distribution, Smart Grids, Renewable Energy, Consumer Electronics), By End-Use (Automotive, Industrial, Utilities, Electronics), Regional Outlook, Competitive Landscape, Market Dynamics, Key Trends & Forecast 2025–2034")
Frequently Asked Questions
How big is the Electrical Contacts Market?
Global Electrical Contacts Market valued at USD 12.6 Billion in 2024, projected to reach USD 20.6 Billion by 2034 at 7.8% CAGR, driven by EVs, smart grids, and industrial automation.
Who are the major players in the Electrical Contacts Market?
Longsun Group Co., Ltd., Heraeus Group, Wenzhou Hongfeng Electrical Alloy Co., Ltd., Materion Corporation, Chugai Electric Industrial Co., Ltd., Modison Limited, Umicore, Nippon Tungsten Co., Ltd., METALOR Technologies SA, Taewon Precision Company, Zhejiang Fuda Alloy Materials Technology Co., Ltd., Electrical Contacts, Ltd.
Which segments covered the Electrical Contacts Market?
By Type, (Silver-Based Materials, Copper-Based Materials, Gold-Based Materials, Palladium-Based Materials, Others), By Electrical Contact, (Rivet-Type, Plate-Type, Material-Wire), By Applications, (Low-Voltage Products, (Switches, Relays, Connectors, Others), Medium and High Voltage Products, (Circuit Breakers, Transformers, Generators, Others)), By End-User, (Electronics and Telecommunication, Power Distribution Center, Automotive, Aerospace, Others)
How can this market research report help my business make strategic decisions?
Our market research reports provide actionable intelligence, including verified market size data, CAGR projections, competitive benchmarking, and segment-level opportunity analysis. These insights support strategic planning, investment decisions, product development, and market entry strategies for enterprises and startups alike.
How frequently is the data updated?
We continuously monitor industry developments and update our reports to reflect regulatory changes, technological advancements, and macroeconomic shifts. Updated editions ensure you receive the latest market intelligence.

Select Licence Type
Connect with our sales team
Why IntelEvoResearch
100%
Customer
Satisfaction
24x7+
Availability - we are always
there when you need us
200+
Fortune 50 Companies trust
IntelEvoResearch
80%
of our reports are exclusive
and first in the industry
100%
more data
and analysis
1000+
reports published
till date
