Global Electrohydraulic Actuator Market Size, Share & Analysis By Product (Control Electrohydraulic Actuator, Switch Electrohydraulic Actuator), By Application (Oil and Gas, Power, Industrial, Other Applications), By End Use (Industrial Building, Commercial Building, Residential Building ), Industry Overview, Performance Advantages, Integration Trends & Forecast 2025–2034
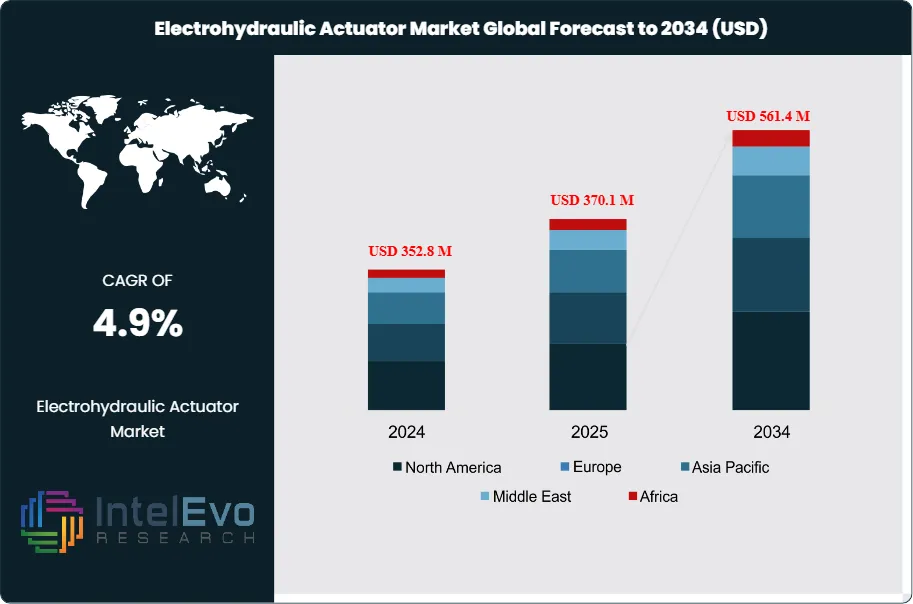
The Electrohydraulic Actuator Market is valued at approximately USD 352.8 million in 2024 and is projected to reach nearly USD 561.4 million by 2034, growing at a steady CAGR of about 4.9% from 2025–2034. This expansion is driven by increasing automation in oil & gas, power generation, marine, and heavy industrial applications, where high force output and precise control are mission-critical. As industries upgrade legacy pneumatic systems to energy-efficient electrohydraulic alternatives, demand is gaining consistent traction worldwide. With digital monitoring, smart valve control, and Industry 4.0–enabled actuators becoming mainstream, the segment is trending across engineering, automation, and industrial innovation platforms.
This moderate yet consistent growth reflects the rising demand for high-precision motion control solutions across critical sectors such as aerospace, automotive, energy, and smart manufacturing. Electrohydraulic actuators (EHAs) combine the robust force delivery of hydraulics with the precision of electronic control, enabling enhanced performance in applications where traditional electric or purely hydraulic systems fall short. The market has witnessed a steady evolution, driven by the broader industrial shift toward automation, digitization, and predictive maintenance—trends that have redefined performance expectations in motion control technologies.
From a demand-side perspective, the surge in automated production systems and intelligent manufacturing infrastructure is propelling adoption, particularly in developed economies and technologically advanced industries. The aerospace and defense sector remains a key end user, leveraging EHAs for flight control systems and military equipment, while automotive OEMs increasingly employ them in testing systems and electric vehicle (EV) development. On the supply side, manufacturers are responding with compact, integrated, and more energy-efficient designs, minimizing fluid leakage risks and extending operational lifecycles.
Technological innovation remains central to market expansion. Integration of EHAs with IoT and AI-powered diagnostic tools is gaining momentum, offering enhanced monitoring, fault detection, and system optimization capabilities. Digital twins and automation software are also being incorporated to streamline control algorithms and reduce system downtime.
Regionally, North America and Europe dominate the market due to early industrial adoption, stringent safety regulations, and defense investments. However, Asia-Pacific is emerging as a high-potential growth hub, particularly in China, Japan, and South Korea, where large-scale industrial automation projects and EV manufacturing are accelerating EHA deployment. Emerging economies in Southeast Asia and Latin America are also drawing investor attention due to favorable policy frameworks and infrastructure modernization efforts.
Despite growth opportunities, the market faces challenges related to high initial costs, complex integration, and maintenance expertise. However, as system designs evolve and digital solutions mature, EHAs are expected to play an increasingly strategic role in next-generation industrial and mobility platforms.
Key Takeaways
Market Growth: The global Electrohydraulic Actuator Market was valued at USD 352.8 million in 2024 and is projected to reach USD 561.4 million by 2034, expanding at a CAGR of 4.9% over the forecast period. Growth is primarily driven by rising automation in manufacturing, aerospace advancements, and demand for high-precision actuation systems.
Product Type: Control Electrohydraulic Actuators accounted for a dominant 71.3% market share in 2023, driven by their widespread use in precision control systems across aerospace, industrial machinery, and defense applications.
Application: TheIndustrial segment led the market in 2023 with a 35.2% revenue share, supported by increased deployment of electrohydraulic systems in automated manufacturing lines, process industries, and testing equipment.
Driver: The growing emphasis on energy efficiency and predictive maintenance in industrial systems is accelerating EHA adoption, particularly in smart factories where digital monitoring can reduce downtime and extend equipment lifespan.
Restraint: High initial costs and integration complexity pose a barrier to adoption, especially among small- and medium-sized enterprises lacking in-house technical expertise for hybrid actuation systems.
Opportunity: The Asia-Pacific region offers strong growth potential, with rising demand from electric vehicle manufacturing, industrial automation, and aerospace development; the regional market is expected to grow at a CAGR exceeding the global average over 2024–2033.
Trend: The integration of EHAs with IoT-enabled condition monitoring and AI-based diagnostics is reshaping system reliability and lifecycle management, with major manufacturers investing in smart actuator platforms to enable real-time performance analytics.
Regional Analysis: North America led the global market with a 35.3% share in 2023, generating USD 117.9 million in revenue, attributed to strong aerospace and defense spending. Meanwhile, Asia-Pacific is emerging as the fastest-growing region, fueled by large-scale industrial investments in China, India, and Southeast Asia.
Type Analysis
As of 2025, Control Electrohydraulic Actuators continue to dominate the global electrohydraulic actuator market, accounting for over 70% of the total market share. These actuators are widely adopted in industries where continuous and precise control is essential—such as power generation, oil and gas, aerospace, and advanced manufacturing. Their ability to deliver high-force output with fine-tuned accuracy makes them indispensable in mission-critical systems, especially those involving automated process control under variable operating conditions. Their dominance also reflects growing end-user demand for actuation solutions that minimize downtime and increase operational efficiency.
Meanwhile, Switch Electrohydraulic Actuators, though occupying a smaller market portion, hold a vital niche in applications that prioritize rapid, binary positioning in harsh or outdoor environments. Commonly deployed in water treatment facilities, heavy machinery, and infrastructure equipment, these actuators are valued for their reliability, low maintenance, and rugged design. With increasing investments in infrastructure resilience and municipal automation systems, this segment is expected to see gradual but steady growth through 2030, particularly in developing economies focused on utility modernization.
Together, these product categories highlight a market where technological specialization and performance differentiation are key to value creation. As digitalization accelerates and industries shift toward predictive maintenance and intelligent actuation systems, the demand for sophisticated control actuators is projected to expand significantly, driving further innovation and supplier competition.
Application Analysis
In 2025, Industrial applications lead the electrohydraulic actuator market, accounting for approximately 35% of the total revenue share. This segment benefits from widespread deployment across metal fabrication, machinery automation, robotics, and process industries. Electrohydraulic actuators in these environments are essential for achieving high-precision motion, force control, and adaptability in complex, repetitive operations. With Industry 4.0 adoption rising globally, manufacturers are integrating these systems into smart production lines to improve throughput, efficiency, and data-driven maintenance.
Other major application segments include Oil & Gas and Power Generation, where actuators operate under severe pressure, temperature, and environmental constraints. In these sectors, EHAs are critical for valve control, drilling systems, and safety mechanisms, particularly in offshore rigs and thermal power plants. Their superior torque output and fail-safe configurations offer a reliable solution where mechanical redundancy is necessary.
As sectors increasingly automate legacy systems and adopt digital control architectures, the demand for electrohydraulic actuation across diverse applications is anticipated to rise. In particular, industrial users are expected to lead future demand, driving product innovation in remote diagnostics, system integration, and energy efficiency.
End-Use Analysis
By end-use, the Industrial Building segment represents the most significant share of the electrohydraulic actuator market in 2025, supported by increasing investment in manufacturing facilities, logistics centers, and energy infrastructure. Automation and real-time system control are now integral to operational strategy in sectors such as steel, cement, chemical processing, and renewable energy. Electrohydraulic systems are deployed to manage mechanical processes with precision while offering the durability required for demanding industrial conditions.
The Commercial Building segment is also witnessing increased adoption, particularly in smart infrastructure projects that require responsive actuation for systems such as HVAC, lift controls, and structural automation. Smart city initiatives in urban centers worldwide are fueling this trend, integrating EHAs into intelligent building frameworks to optimize energy use and mechanical performance.
The Residential Building segment, while smaller, shows emerging opportunities—especially in high-end construction and luxury housing where automation of utilities and structural elements is becoming a differentiator. Though still niche, the potential for growth exists as smart home ecosystems continue to evolve and as EHAs become more compact and affordable.
Regional Analysis
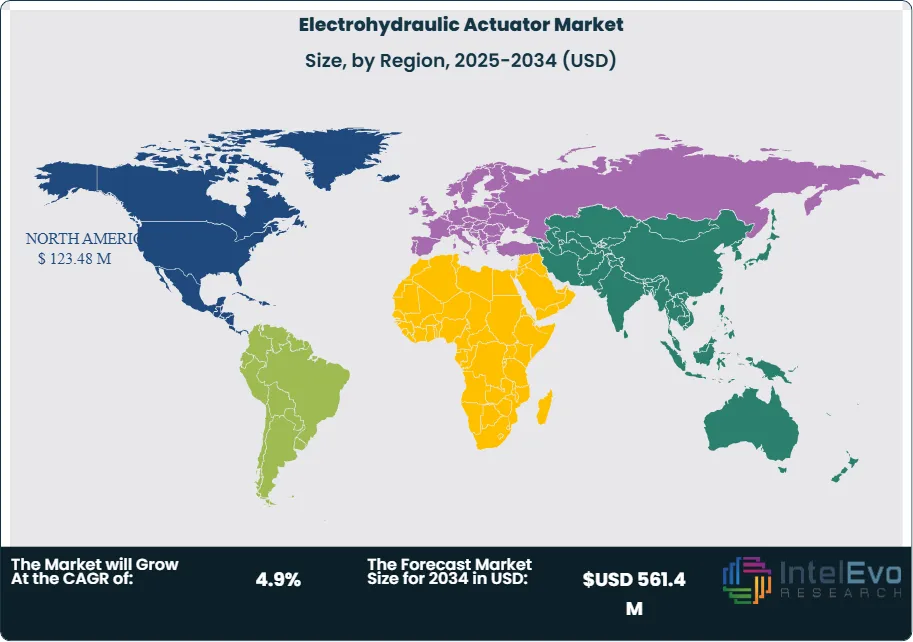
In regional terms, North America remains the largest market for electrohydraulic actuators in 2025, holding over 35% of global revenue share, with the United States contributing the majority. The region’s leadership is attributed to strong adoption across aerospace, defense, oil and gas, and advanced manufacturing. Government-backed initiatives for industrial automation, coupled with high R&D investments, further bolster the region’s position as a technological frontrunner in actuator development.
Europe follows closely, driven by regulatory requirements for energy efficiency and safety in industrial systems. Germany, France, and the UK are key markets, supported by a well-established base of automotive and aerospace OEMs. The region’s focus on sustainability and precision engineering continues to push demand for high-performance electrohydraulic solutions.
Meanwhile, Asia Pacific is the fastest-growing region, with China and India emerging as industrial powerhouses. Rising infrastructure spending, electric vehicle production, and smart manufacturing initiatives are accelerating the adoption of EHAs across sectors. The region’s market is expected to grow at a CAGR exceeding the global average through 2030, making it a strategic focus for global suppliers.
Latin America and the Middle East & Africa exhibit steady growth, primarily driven by investments in oil and gas, water infrastructure, and industrial modernization. While smaller in market size, both regions present long-term opportunities due to increasing automation adoption and infrastructure expansion.
By Product (Control Electrohydraulic Actuator, Switch Electrohydraulic Actuator), By Application (Oil and Gas, Power, Industrial, Other Applications), By End Use (Industrial Building, Commercial Building, Residential Building )
Research Methodology
Primary Research- 100 Interviews of Stakeholders
Secondary Research
Desk Research
Regional scope
North America (United States, Canada, Mexico)
Latin America (Brazil, Argentina, Columbia)
East Asia And Pacific (China, Japan, South Korea, Australia, Cambodia, Fiji, Indonesia)
Sea And South Asia (India, Singapore, Thailand, Taiwan, Malaysia)
Eastern Europe (Poland, Russia, Czech Republic, Romania)
Western Europe (Germany, U.K., France, Spain, Itlay)
Middle East & Africa (GCC Countries, Egypt, Nigeria, South Africa, Israel)
Customization for segments, region/country-level will be provided. Moreover, additional customization can be done based on the requirements.
Pricing and Purchase Options
Avail customized purchase options to meet your exact research needs. We have three licenses to opt for: Single User License, Multi-User License (Up to 5 Users), Corporate Use License (Unlimited User and Printable PDF).
TABLE OF CONTENTS
1. EXECUTIVE SUMMARY
1.1. MARKET SNAPSHOT
1.2. KEY FINDINGS & INSIGHTS
1.3. ANALYST RECOMMENDATIONS
1.4. FUTURE OUTLOOK
2. RESEARCH METHODOLOGY
2.1. MARKET DEFINITION & SCOPE
2.2. RESEARCH OBJECTIVES: PRIMARY & SECONDARY DATA SOURCES
2.3. DATA COLLECTION SOURCES
2.3.1. COVERAGE OF 100+ PRIMARY RESEARCH/CONSULTATION CALLS WITH INDUSTRY STAKEHOLDERS
FIGURE 17 NORTH AMERICA ELECTROHYDRAULIC ACTUATOR CURRENT AND FUTURE TYPE ANALYSIS, 2025–2034, (USD MILLION)
FIGURE 18 NORTH AMERICA ELECTROHYDRAULIC ACTUATOR CURRENT AND FUTURE END USER ANALYSIS, 2025–2034, (USD MILLION)
FIGURE 19 MARKET SHARE BY COUNTRY
FIGURE 20 LATIN AMERICA ELECTROHYDRAULIC ACTUATOR CURRENT AND FUTURE TYPE ANALYSIS, 2025–2034, (USD MILLION)
FIGURE 21 LATIN AMERICA ELECTROHYDRAULIC ACTUATOR CURRENT AND FUTURE END USER ANALYSIS, 2025–2034, (USD MILLION)
FIGURE 22 MARKET SHARE BY COUNTRY
FIGURE 23 EASTERN EUROPE ELECTROHYDRAULIC ACTUATOR CURRENT AND FUTURE TYPE ANALYSIS, 2025–2034, (USD MILLION)
FIGURE 24 EASTERN EUROPE ELECTROHYDRAULIC ACTUATOR CURRENT AND FUTURE END USER ANALYSIS, 2025–2034, (USD MILLION)
FIGURE 25 MARKET SHARE BY COUNTRY
FIGURE 26 WESTERN EUROPE ELECTROHYDRAULIC ACTUATOR CURRENT AND FUTURE TYPE ANALYSIS, 2025–2034, (USD MILLION)
FIGURE 27 WESTERN EUROPE ELECTROHYDRAULIC ACTUATOR CURRENT AND FUTURE END USER ANALYSIS, 2025–2034, (USD MILLION)
FIGURE 28 MARKET SHARE BY COUNTRY
FIGURE 29 EAST ASIA AND PACIFIC ELECTROHYDRAULIC ACTUATOR CURRENT AND FUTURE TYPE ANALYSIS, 2025–2034, (USD MILLION)
FIGURE 30 EAST ASIA AND PACIFIC ELECTROHYDRAULIC ACTUATOR CURRENT AND FUTURE END USER ANALYSIS, 2025–2034, (USD MILLION)
FIGURE 31 MARKET SHARE BY COUNTRY
FIGURE 32 SEA AND SOUTH ASIA ELECTROHYDRAULIC ACTUATOR CURRENT AND FUTURE TYPE ANALYSIS, 2025–2034, (USD MILLION)
FIGURE 33 SEA AND SOUTH ASIA ELECTROHYDRAULIC ACTUATOR CURRENT AND FUTURE END USER ANALYSIS, 2025–2034, (USD MILLION)
FIGURE 34 MARKET SHARE BY COUNTRY
FIGURE 35 MIDDLE EAST AND AFRICA ELECTROHYDRAULIC ACTUATOR CURRENT AND FUTURE TYPE ANALYSIS, 2025–2034, (USD MILLION)
FIGURE 36 MIDDLE EAST AND AFRICA ELECTROHYDRAULIC ACTUATOR CURRENT AND FUTURE END USER ANALYSIS, 2025–2034, (USD MILLION)
FIGURE 37 NORTH AMERICA ELECTROHYDRAULIC ACTUATOR CURRENT AND FUTURE MARKET VOLUME SHARE REGIONAL ANALYSIS, 2025–2034, (USD MILLION)
FIGURE 38 U.S. ELECTROHYDRAULIC ACTUATOR CURRENT AND FUTURE TYPE ANALYSIS, 2025–2034, (USD MILLION)
FIGURE 39 U.S. ELECTROHYDRAULIC ACTUATOR CURRENT AND FUTURE END USER ANALYSIS, 2025–2034, (USD MILLION)
FIGURE 40 CANADA ELECTROHYDRAULIC ACTUATOR CURRENT AND FUTURE TYPE ANALYSIS, 2025–2034, (USD MILLION)
FIGURE 41 CANADA ELECTROHYDRAULIC ACTUATOR CURRENT AND FUTURE END USER ANALYSIS, 2025–2034, (USD MILLION)
FIGURE 42 LATIN AMERICA ELECTROHYDRAULIC ACTUATOR CURRENT AND FUTURE MARKET VOLUME SHARE REGIONAL ANALYSIS, 2025–2034, (USD MILLION)
FIGURE 43 MEXICO ELECTROHYDRAULIC ACTUATOR CURRENT AND FUTURE TYPE ANALYSIS, 2025–2034, (USD MILLION)
FIGURE 44 MEXICO ELECTROHYDRAULIC ACTUATOR CURRENT AND FUTURE END USER ANALYSIS, 2025–2034, (USD MILLION)
FIGURE 45 BRAZIL ELECTROHYDRAULIC ACTUATOR CURRENT AND FUTURE TYPE ANALYSIS, 2025–2034, (USD MILLION)
FIGURE 46 BRAZIL ELECTROHYDRAULIC ACTUATOR CURRENT AND FUTURE END USER ANALYSIS, 2025–2034, (USD MILLION)
FIGURE 47 ARGENTINA ELECTROHYDRAULIC ACTUATOR CURRENT AND FUTURE TYPE ANALYSIS, 2025–2034, (USD MILLION)
FIGURE 48 ARGENTINA ELECTROHYDRAULIC ACTUATOR CURRENT AND FUTURE END USER ANALYSIS, 2025–2034, (USD MILLION)
FIGURE 49 COLUMBIA ELECTROHYDRAULIC ACTUATOR CURRENT AND FUTURE TYPE ANALYSIS, 2025–2034, (USD MILLION)
FIGURE 50 COLUMBIA ELECTROHYDRAULIC ACTUATOR CURRENT AND FUTURE END USER ANALYSIS, 2025–2034, (USD MILLION)
FIGURE 51 REST OF LATIN AMERICA ELECTROHYDRAULIC ACTUATOR CURRENT AND FUTURE TYPE ANALYSIS, 2025–2034, (USD MILLION)
FIGURE 52 REST OF LATIN AMERICA ELECTROHYDRAULIC ACTUATOR CURRENT AND FUTURE END USER ANALYSIS, 2025–2034, (USD MILLION)
FIGURE 53 EASTERN EUROPE ELECTROHYDRAULIC ACTUATOR CURRENT AND FUTURE MARKET VOLUME SHARE REGIONAL ANALYSIS, 2025–2034, (USD MILLION)
FIGURE 54 POLAND ELECTROHYDRAULIC ACTUATOR CURRENT AND FUTURE TYPE ANALYSIS, 2025–2034, (USD MILLION)
FIGURE 55 POLAND ELECTROHYDRAULIC ACTUATOR CURRENT AND FUTURE END USER ANALYSIS, 2025–2034, (USD MILLION)
FIGURE 56 RUSSIA ELECTROHYDRAULIC ACTUATOR CURRENT AND FUTURE TYPE ANALYSIS, 2025–2034, (USD MILLION)
FIGURE 57 RUSSIA ELECTROHYDRAULIC ACTUATOR CURRENT AND FUTURE END USER ANALYSIS, 2025–2034, (USD MILLION)
FIGURE 58 CZECH REPUBLIC ELECTROHYDRAULIC ACTUATOR CURRENT AND FUTURE TYPE ANALYSIS, 2025–2034, (USD MILLION)
FIGURE 59 CZECH REPUBLIC ELECTROHYDRAULIC ACTUATOR CURRENT AND FUTURE END USER ANALYSIS, 2025–2034, (USD MILLION)
FIGURE 60 ROMANIA ELECTROHYDRAULIC ACTUATOR CURRENT AND FUTURE TYPE ANALYSIS, 2025–2034, (USD MILLION)
FIGURE 61 ROMANIA ELECTROHYDRAULIC ACTUATOR CURRENT AND FUTURE END USER ANALYSIS, 2025–2034, (USD MILLION)
FIGURE 62 REST OF EASTERN EUROPE ELECTROHYDRAULIC ACTUATOR CURRENT AND FUTURE TYPE ANALYSIS, 2025–2034, (USD MILLION)
FIGURE 63 REST OF EASTERN EUROPE ELECTROHYDRAULIC ACTUATOR CURRENT AND FUTURE END USER ANALYSIS, 2025–2034, (USD MILLION)
FIGURE 64 WESTERN EUROPE ELECTROHYDRAULIC ACTUATOR CURRENT AND FUTURE MARKET VOLUME SHARE REGIONAL ANALYSIS, 2025–2034, (USD MILLION)
FIGURE 65 GERMANY ELECTROHYDRAULIC ACTUATOR CURRENT AND FUTURE TYPE ANALYSIS, 2025–2034, (USD MILLION)
FIGURE 66 GERMANY ELECTROHYDRAULIC ACTUATOR CURRENT AND FUTURE END USER ANALYSIS, 2025–2034, (USD MILLION)
FIGURE 67 FRANCE ELECTROHYDRAULIC ACTUATOR CURRENT AND FUTURE TYPE ANALYSIS, 2025–2034, (USD MILLION)
FIGURE 68 FRANCE ELECTROHYDRAULIC ACTUATOR CURRENT AND FUTURE END USER ANALYSIS, 2025–2034, (USD MILLION)
FIGURE 69 UK ELECTROHYDRAULIC ACTUATOR CURRENT AND FUTURE TYPE ANALYSIS, 2025–2034, (USD MILLION)
FIGURE 70 UK ELECTROHYDRAULIC ACTUATOR CURRENT AND FUTURE END USER ANALYSIS, 2025–2034, (USD MILLION)
FIGURE 71 SPAIN ELECTROHYDRAULIC ACTUATOR CURRENT AND FUTURE TYPE ANALYSIS, 2025–2034, (USD MILLION)
FIGURE 72 SPAIN ELECTROHYDRAULIC ACTUATOR CURRENT AND FUTURE END USER ANALYSIS, 2025–2034, (USD MILLION)
FIGURE 73 ITALY ELECTROHYDRAULIC ACTUATOR CURRENT AND FUTURE TYPE ANALYSIS, 2025–2034, (USD MILLION)
FIGURE 74 ITALY ELECTROHYDRAULIC ACTUATOR CURRENT AND FUTURE END USER ANALYSIS, 2025–2034, (USD MILLION)
FIGURE 75 REST OF WESTERN EUROPE ELECTROHYDRAULIC ACTUATOR CURRENT AND FUTURE TYPE ANALYSIS, 2025–2034, (USD MILLION)
FIGURE 76 REST OF WESTERN EUROPE ELECTROHYDRAULIC ACTUATOR CURRENT AND FUTURE END USER ANALYSIS, 2025–2034, (USD MILLION)
FIGURE 77 EAST ASIA AND PACIFIC ELECTROHYDRAULIC ACTUATOR CURRENT AND FUTURE MARKET VOLUME SHARE REGIONAL ANALYSIS, 2025–2034, (USD MILLION)
FIGURE 78 CHINA ELECTROHYDRAULIC ACTUATOR CURRENT AND FUTURE TYPE ANALYSIS, 2025–2034, (USD MILLION)
FIGURE 79 CHINA ELECTROHYDRAULIC ACTUATOR CURRENT AND FUTURE END USER ANALYSIS, 2025–2034, (USD MILLION)
FIGURE 80 JAPAN ELECTROHYDRAULIC ACTUATOR CURRENT AND FUTURE TYPE ANALYSIS, 2025–2034, (USD MILLION)
FIGURE 81 JAPAN ELECTROHYDRAULIC ACTUATOR CURRENT AND FUTURE END USER ANALYSIS, 2025–2034, (USD MILLION)
FIGURE 82 AUSTRALIA ELECTROHYDRAULIC ACTUATOR CURRENT AND FUTURE TYPE ANALYSIS, 2025–2034, (USD MILLION)
FIGURE 83 AUSTRALIA ELECTROHYDRAULIC ACTUATOR CURRENT AND FUTURE END USER ANALYSIS, 2025–2034, (USD MILLION)
FIGURE 84 CAMBODIA ELECTROHYDRAULIC ACTUATOR CURRENT AND FUTURE TYPE ANALYSIS, 2025–2034, (USD MILLION)
FIGURE 85 CAMBODIA ELECTROHYDRAULIC ACTUATOR CURRENT AND FUTURE END USER ANALYSIS, 2025–2034, (USD MILLION)
FIGURE 86 FIJI ELECTROHYDRAULIC ACTUATOR CURRENT AND FUTURE TYPE ANALYSIS, 2025–2034, (USD MILLION)
FIGURE 87 FIJI ELECTROHYDRAULIC ACTUATOR CURRENT AND FUTURE END USER ANALYSIS, 2025–2034, (USD MILLION)
FIGURE 88 INDONESIA ELECTROHYDRAULIC ACTUATOR CURRENT AND FUTURE TYPE ANALYSIS, 2025–2034, (USD MILLION)
FIGURE 89 INDONESIA ELECTROHYDRAULIC ACTUATOR CURRENT AND FUTURE END USER ANALYSIS, 2025–2034, (USD MILLION)
FIGURE 90 SOUTH KOREA ELECTROHYDRAULIC ACTUATOR CURRENT AND FUTURE TYPE ANALYSIS, 2025–2034, (USD MILLION)
FIGURE 91 SOUTH KOREA ELECTROHYDRAULIC ACTUATOR CURRENT AND FUTURE END USER ANALYSIS, 2025–2034, (USD MILLION)
FIGURE 92 REST OF EAST ASIA AND PACIFIC ELECTROHYDRAULIC ACTUATOR CURRENT AND FUTURE TYPE ANALYSIS, 2025–2034, (USD MILLION)
FIGURE 93 REST OF EAST ASIA AND PACIFIC ELECTROHYDRAULIC ACTUATOR CURRENT AND FUTURE END USER ANALYSIS, 2025–2034, (USD MILLION)
FIGURE 94 SEA AND SOUTH ASIA ELECTROHYDRAULIC ACTUATOR CURRENT AND FUTURE MARKET VOLUME SHARE REGIONAL ANALYSIS, 2025–2034, (USD MILLION)
FIGURE 95 BANGLADESH ELECTROHYDRAULIC ACTUATOR CURRENT AND FUTURE TYPE ANALYSIS, 2025–2034, (USD MILLION)
FIGURE 96 BANGLADESH ELECTROHYDRAULIC ACTUATOR CURRENT AND FUTURE END USER ANALYSIS, 2025–2034, (USD MILLION)
FIGURE 97 NEW ZEALAND ELECTROHYDRAULIC ACTUATOR CURRENT AND FUTURE TYPE ANALYSIS, 2025–2034, (USD MILLION)
FIGURE 98 NEW ZEALAND ELECTROHYDRAULIC ACTUATOR CURRENT AND FUTURE END USER ANALYSIS, 2025–2034, (USD MILLION)
FIGURE 99 INDIA ELECTROHYDRAULIC ACTUATOR CURRENT AND FUTURE TYPE ANALYSIS, 2025–2034, (USD MILLION)
FIGURE 100 INDIA ELECTROHYDRAULIC ACTUATOR CURRENT AND FUTURE END USER ANALYSIS, 2025–2034, (USD MILLION)
FIGURE 101 SINGAPORE ELECTROHYDRAULIC ACTUATOR CURRENT AND FUTURE TYPE ANALYSIS, 2025–2034, (USD MILLION)
FIGURE 102 SINGAPORE ELECTROHYDRAULIC ACTUATOR CURRENT AND FUTURE END USER ANALYSIS, 2025–2034, (USD MILLION)
FIGURE 103 THAILAND ELECTROHYDRAULIC ACTUATOR CURRENT AND FUTURE TYPE ANALYSIS, 2025–2034, (USD MILLION)
FIGURE 104 THAILAND ELECTROHYDRAULIC ACTUATOR CURRENT AND FUTURE END USER ANALYSIS, 2025–2034, (USD MILLION)
FIGURE 105 TAIWAN ELECTROHYDRAULIC ACTUATOR CURRENT AND FUTURE TYPE ANALYSIS, 2025–2034, (USD MILLION)
FIGURE 106 TAIWAN ELECTROHYDRAULIC ACTUATOR CURRENT AND FUTURE END USER ANALYSIS, 2025–2034, (USD MILLION)
FIGURE 107 MALAYSIA ELECTROHYDRAULIC ACTUATOR CURRENT AND FUTURE TYPE ANALYSIS, 2025–2034, (USD MILLION)
FIGURE 108 MALAYSIA ELECTROHYDRAULIC ACTUATOR CURRENT AND FUTURE END USER ANALYSIS, 2025–2034, (USD MILLION)
FIGURE 109 REST OF SEA AND SOUTH ASIA ELECTROHYDRAULIC ACTUATOR CURRENT AND FUTURE TYPE ANALYSIS, 2025–2034, (USD MILLION)
FIGURE 110 REST OF SEA AND SOUTH ASIA ELECTROHYDRAULIC ACTUATOR CURRENT AND FUTURE END USER ANALYSIS, 2025–2034, (USD MILLION)
FIGURE 111 MIDDLE EAST AND AFRICA ELECTROHYDRAULIC ACTUATOR CURRENT AND FUTURE MARKET VOLUME SHARE REGIONAL ANALYSIS, 2025–2034, (USD MILLION)
FIGURE 112 GCC COUNTRIES ELECTROHYDRAULIC ACTUATOR CURRENT AND FUTURE TYPE ANALYSIS, 2025–2034, (USD MILLION)
FIGURE 113 GCC COUNTRIES ELECTROHYDRAULIC ACTUATOR CURRENT AND FUTURE END USER ANALYSIS, 2025–2034, (USD MILLION)
FIGURE 114 SAUDI ARABIA ELECTROHYDRAULIC ACTUATOR CURRENT AND FUTURE TYPE ANALYSIS, 2025–2034, (USD MILLION)
FIGURE 115 SAUDI ARABIA ELECTROHYDRAULIC ACTUATOR CURRENT AND FUTURE END USER ANALYSIS, 2025–2034, (USD MILLION)
FIGURE 116 UAE ELECTROHYDRAULIC ACTUATOR CURRENT AND FUTURE TYPE ANALYSIS, 2025–2034, (USD MILLION)
FIGURE 117 UAE ELECTROHYDRAULIC ACTUATOR CURRENT AND FUTURE END USER ANALYSIS, 2025–2034, (USD MILLION)
FIGURE 118 BAHRAIN ELECTROHYDRAULIC ACTUATOR CURRENT AND FUTURE TYPE ANALYSIS, 2025–2034, (USD MILLION)
FIGURE 119 BAHRAIN ELECTROHYDRAULIC ACTUATOR CURRENT AND FUTURE END USER ANALYSIS, 2025–2034, (USD MILLION)
FIGURE 120 KUWAIT ELECTROHYDRAULIC ACTUATOR CURRENT AND FUTURE TYPE ANALYSIS, 2025–2034, (USD MILLION)
FIGURE 121 KUWAIT ELECTROHYDRAULIC ACTUATOR CURRENT AND FUTURE END USER ANALYSIS, 2025–2034, (USD MILLION)
FIGURE 122 OMAN ELECTROHYDRAULIC ACTUATOR CURRENT AND FUTURE TYPE ANALYSIS, 2025–2034, (USD MILLION)
FIGURE 123 OMAN ELECTROHYDRAULIC ACTUATOR CURRENT AND FUTURE END USER ANALYSIS, 2025–2034, (USD MILLION)
FIGURE 124 QATAR ELECTROHYDRAULIC ACTUATOR CURRENT AND FUTURE TYPE ANALYSIS, 2025–2034, (USD MILLION)
FIGURE 125 QATAR ELECTROHYDRAULIC ACTUATOR CURRENT AND FUTURE END USER ANALYSIS, 2025–2034, (USD MILLION)
FIGURE 126 EGYPT ELECTROHYDRAULIC ACTUATOR CURRENT AND FUTURE TYPE ANALYSIS, 2025–2034, (USD MILLION)
FIGURE 127 EGYPT ELECTROHYDRAULIC ACTUATOR CURRENT AND FUTURE END USER ANALYSIS, 2025–2034, (USD MILLION)
FIGURE 128 NIGERIA ELECTROHYDRAULIC ACTUATOR CURRENT AND FUTURE TYPE ANALYSIS, 2025–2034, (USD MILLION)
FIGURE 129 NIGERIA ELECTROHYDRAULIC ACTUATOR CURRENT AND FUTURE END USER ANALYSIS, 2025–2034, (USD MILLION)
FIGURE 130 SOUTH AFRICA ELECTROHYDRAULIC ACTUATOR CURRENT AND FUTURE TYPE ANALYSIS, 2025–2034, (USD MILLION)
FIGURE 131 SOUTH AFRICA ELECTROHYDRAULIC ACTUATOR CURRENT AND FUTURE END USER ANALYSIS, 2025–2034, (USD MILLION)
FIGURE 132 ISRAEL ELECTROHYDRAULIC ACTUATOR CURRENT AND FUTURE TYPE ANALYSIS, 2025–2034, (USD MILLION)
FIGURE 133 ISRAEL ELECTROHYDRAULIC ACTUATOR CURRENT AND FUTURE END USER ANALYSIS, 2025–2034, (USD MILLION)
FIGURE 134 REST OF MEA ELECTROHYDRAULIC ACTUATOR CURRENT AND FUTURE TYPE ANALYSIS, 2025–2034, (USD MILLION)
FIGURE 135 REST OF MEA ELECTROHYDRAULIC ACTUATOR CURRENT AND FUTURE END USER ANALYSIS, 2025–2034, (USD MILLION)
FIGURE 136 U. S. MARKET SHARE ANALYSIS BY TYPE (2024)
FIGURE 137 U. S. MARKET SHARE ANALYSIS BY END USER (2024)
FIGURE 138 CANADA MARKET SHARE ANALYSIS BY TYPE (2024)
FIGURE 139 CANADA MARKET SHARE ANALYSIS BY END USER (2024)
FIGURE 140 MEXICO MARKET SHARE ANALYSIS BY TYPE (2024)
FIGURE 141 MEXICO MARKET SHARE ANALYSIS BY END USER (2024)
FIGURE 142 CHINA MARKET SHARE ANALYSIS BY TYPE (2024)
FIGURE 143 CHINA MARKET SHARE ANALYSIS BY END USER (2024)
FIGURE 144 JAPAN MARKET SHARE ANALYSIS BY TYPE (2024)
FIGURE 145 JAPAN MARKET SHARE ANALYSIS BY END USER (2024)
FIGURE 146 INDIA MARKET SHARE ANALYSIS BY TYPE (2024)
FIGURE 147 INDIA MARKET SHARE ANALYSIS BY END USER (2024)
FIGURE 148 SOUTH KOREA MARKET SHARE ANALYSIS BY TYPE (2024)
FIGURE 149 SOUTH KOREA MARKET SHARE ANALYSIS BY END USER (2024)
FIGURE 150 SAUDI ARABIA MARKET SHARE ANALYSIS BY TYPE (2024)
FIGURE 151 SAUDI ARABIA MARKET SHARE ANALYSIS BY END USER (2024)
FIGURE 152 UAE MARKET SHARE ANALYSIS BY TYPE (2024)
FIGURE 153 UAE MARKET SHARE ANALYSIS BY END USER (2024)
FIGURE 154 EGYPT MARKET SHARE ANALYSIS BY TYPE (2024)
FIGURE 155 EGYPT MARKET SHARE ANALYSIS BY END USER (2024)
FIGURE 156 NIGERIA MARKET SHARE ANALYSIS BY TYPE (2024)
FIGURE 157 NIGERIA MARKET SHARE ANALYSIS BY END USER (2024)
FIGURE 158 SOUTH AFRICA MARKET SHARE ANALYSIS BY TYPE (2024)
FIGURE 159 SOUTH AFRICA MARKET SHARE ANALYSIS BY END USER (2024)
FIGURE 160 GERMANY MARKET SHARE ANALYSIS BY TYPE (2024)
FIGURE 161 GERMANY MARKET SHARE ANALYSIS BY END USER (2024)
FIGURE 162 FRANCE MARKET SHARE ANALYSIS BY TYPE (2024)
FIGURE 163 FRANCE MARKET SHARE ANALYSIS BY END USER (2024)
FIGURE 164 UK MARKET SHARE ANALYSIS BY TYPE (2024)
FIGURE 165 UK MARKET SHARE ANALYSIS BY END USER (2024)
FIGURE 166 SPAIN MARKET SHARE ANALYSIS BY TYPE (2024)
FIGURE 167 SPAIN MARKET SHARE ANALYSIS BY END USER (2024)
FIGURE 168 ITALY MARKET SHARE ANALYSIS BY TYPE (2024)
FIGURE 169 ITALY MARKET SHARE ANALYSIS BY END USER (2024)
FIGURE 170 BRAZIL MARKET SHARE ANALYSIS BY TYPE (2024)
FIGURE 171 BRAZIL MARKET SHARE ANALYSIS BY END USER (2024)
FIGURE 172 ARGENTINA MARKET SHARE ANALYSIS BY TYPE (2024)
FIGURE 173 ARGENTINA MARKET SHARE ANALYSIS BY END USER (2024)
FIGURE 174 COLUMBIA MARKET SHARE ANALYSIS BY TYPE (2024)
FIGURE 175 COLUMBIA MARKET SHARE ANALYSIS BY END USER (2024)
FIGURE 176 GLOBAL ELECTROHYDRAULIC ACTUATOR CURRENT AND FUTURE MARKET KEY COUNTRY LEVEL ANALYSIS, 2024–2034, (USD MILLION)
FIGURE 177 FINANCIAL OVERVIEW:
Key Player Analysis
Bosch Rexroth AG: Bosch Rexroth AG maintains its position as a global leader in the electrohydraulic actuator market, renowned for its extensive automation and motion control portfolio. The company’s EHAs are integrated into a wide range of industrial and mobile applications, particularly in the manufacturing, construction, and energy sectors. In 2025, Bosch Rexroth has strengthened its market position through strategic investments in smart actuator technologies, embedding IoT connectivity and real-time diagnostics into its systems. The launch of its next-generation CytroMotion platform has enabled compact, energy-efficient solutions for decentralized automation—aligning with the industry shift toward sustainability and predictive maintenance. Bosch Rexroth’s strong European manufacturing base, combined with growing presence in Asia-Pacific, gives it a competitive edge in both mature and emerging markets.
Parker Hannifin Corporation: Parker Hannifin stands out as a key innovator in the electrohydraulic actuator space, with a focus on delivering high-performance motion control solutions across aerospace, defense, and heavy industrial sectors. Its tailored actuator systems are particularly valued in applications requiring extreme reliability and environmental resilience. In 2025, Parker has intensified its focus on digitally integrated solutions, leveraging AI-driven controls and smart hydraulic platforms under its “Parker IQAN” series to enhance precision and reduce energy waste. The company’s continued investment in R&D—over $400 million annually—has also resulted in the development of advanced materials and fluid technologies, improving actuator efficiency and lifespan. Parker’s global footprint, particularly in North America and Europe, is bolstered by long-standing OEM relationships and a reputation for engineering excellence.
Eaton Corporation: Eaton Corporation operates as a strategic challenger in the electrohydraulic actuator market, leveraging its strong electrical and industrial systems expertise to offer integrated control solutions. Its EHAs are widely used in energy infrastructure, utilities, and mining applications, where Eaton’s dual strength in hydraulics and electrical power provides a synergistic advantage. In 2025, Eaton has pursued a focused expansion strategy through targeted acquisitions in Asia and Latin America, tapping into high-growth markets with rising infrastructure demand. The company has also prioritized sustainability-driven innovation, developing actuators compatible with biodegradable fluids and low-leakage designs. Eaton’s diversified portfolio, combined with its emphasis on ESG-aligned engineering, makes it a preferred partner for industries navigating both automation and environmental compliance.
Moog Inc: Moog Inc. is recognized as a high-tech disruptor in the electrohydraulic actuator landscape, known for its advanced systems in aerospace, defense, and precision industrial applications. In 2025, the company continues to lead in mission-critical EHA solutions, particularly in aerospace flight control systems and defense-grade mobility platforms. Moog’s investment in smart actuation platforms—integrating digital twins, condition-based monitoring, and fault-tolerant control—positions it at the forefront of the industry’s transition to intelligent automation. The company’s ability to deliver ultra-high-performance actuators with minimal latency and exacting control standards differentiates it in premium, low-volume markets. With a strong U.S. defense customer base and expanding global reach in Asia-Pacific, Moog remains a strategic player driving the next wave of actuation innovation.
Market Key Players:
Wipro Infrastructure Engineering
Rexa, LLC
Atos Spa
Moog Inc.
Bosch Rexroth AG
Oilgear
Parker Hannifin Corporation
IMI Precision Engineering
Eaton Corporation
Rotork plc
Other Key Players
Driver:
Automation Demand Fuels Rising Adoption of Electrohydraulic Actuators
As of 2025, the demand for advanced automation and precision control systems continues to accelerate across critical sectors such as oil & gas, energy, aerospace, and industrial manufacturing. Electrohydraulic actuators (EHAs) are gaining traction due to their ability to deliver high-force output with precise motion control—making them essential in environments where safety, efficiency, and reliability are non-negotiable. The integration of IoT-enabled monitoring and smart diagnostics has further enhanced their value proposition, allowing operators to track performance in real time, reduce unplanned downtime, and improve lifecycle management. This convergence of mechanical power and digital intelligence is positioning EHAs as a foundational component in next-generation industrial automation strategies, propelling sustained market growth at a projected CAGR of 3.5% through 2033.
Restraint:
High Costs & Technical Complexity Limit Broader Market Penetration
Despite strong market momentum, high upfront costs and complex maintenance requirements remain significant barriers to broader adoption. Electrohydraulic systems often involve intricate engineering and the use of high-grade components to ensure optimal performance in demanding conditions. This complexity not only drives up procurement costs but also necessitates specialized skills for installation, calibration, and ongoing maintenance—resources that many small and mid-sized enterprises may lack. In cost-sensitive markets and emerging economies, these financial and technical burdens can deter investment, slowing penetration in industries that prioritize low-CAPEX solutions. As a result, manufacturers are under increasing pressure to develop more affordable and modular EHA systems to tap into underserved segments.
Opportunity:
Renewable Energy & Infrastructure Expansion Unlock New EHA Growth
A promising growth avenue for the Electrohydraulic Actuator Market lies in the renewable energy and infrastructure development sectors, both of which are scaling rapidly in response to global sustainability goals. EHAs are becoming increasingly integral to applications such as solar panel orientation, wind turbine pitch control, and dam gate automation, where precise, reliable motion control is essential. For instance, global investments in clean energy infrastructure surpassed USD 1.8 trillion in 2024 and are projected to grow steadily through 2030. Additionally, the expansion of water management systems, high-speed rail networks, and smart urban projects across Asia Pacific and the Middle East presents lucrative opportunities for actuator suppliers. These high-growth sectors are expected to contribute significantly to the market’s diversification and long-term scalability.
Trend:
AI Integration, Miniaturization & Eco-Friendly EHAs Redefine the Market
The Electrohydraulic Actuator Market is undergoing a technological transformation fueled by digital integration, miniaturization, and environmental compliance. In 2025, a growing number of OEMs are embedding AI algorithms and edge computing into actuator systems, enabling predictive maintenance, autonomous operation, and adaptive control in real time. This trend is reshaping industrial asset management, as organizations shift from reactive to predictive maintenance models. Concurrently, sustainability pressures are driving innovations in eco-friendly EHAs—such as systems using biodegradable hydraulic fluids and low-energy consumption designs. Another notable trend is the miniaturization of EHAs, expanding their use into compact and mobile platforms including robotics, medical equipment, and mobile machinery. These advancements are not only broadening the application landscape but also intensifying competitive differentiation among global suppliers.
Recent Developments
Dec 2024 – Parker Hannifin Corporation: The company unveiled its new IQAN-XC22E electrohydraulic controller, designed to enhance real-time actuation feedback and reduce energy consumption in mobile and industrial platforms. The system is projected to improve operational efficiency by up to 18%, especially in heavy-duty applications. This product launch reinforces Parker's position as a technology innovator in smart fluid power systems.
Feb 2025 – Eaton Corporation: Eaton announced the acquisition of a majority stake in HydroMotion India Pvt. Ltd., a regional manufacturer of hydraulic and actuator systems, in a deal estimated at USD 74 million. The move grants Eaton deeper access to India’s growing infrastructure and energy sectors. This acquisition strengthens Eaton’s footprint in high-growth Asia-Pacific markets and diversifies its supply chain.
Apr 2025 – Bosch Rexroth AG: The company launched its next-generation CytroForce-M actuator line for precision automation in manufacturing and energy operations, featuring plug-and-play digital integration and smart condition monitoring. Early adoption by European OEMs is projected to generate USD 45 million in incremental revenue by year-end. The launch enhances Bosch Rexroth’s competitiveness in intelligent, high-efficiency actuator solutions.
Jul 2025 – Moog Inc: Moog entered into a strategic collaboration with Siemens Digital Industries to co-develop AI-enhanced control systems for electrohydraulic actuators used in aerospace and defense. The platform integrates Moog’s actuator hardware with Siemens’ industrial AI suite for predictive diagnostics and autonomous adjustment. This partnership positions Moog as a pioneer in next-gen smart actuation technologies with dual-use military and commercial applications.
Sep 2025 – Emerson Electric Co.: Emerson announced its entry into the electrohydraulic actuator market with the launch of the FlowPro-EH Series, targeting oil & gas and power sectors in North America. The new series offers 30% faster response times and reduced leakage rates, supported by Emerson’s diagnostics-enabled control infrastructure. This market entry disrupts the competitive landscape and signals broader convergence between flow control and actuation technologies.