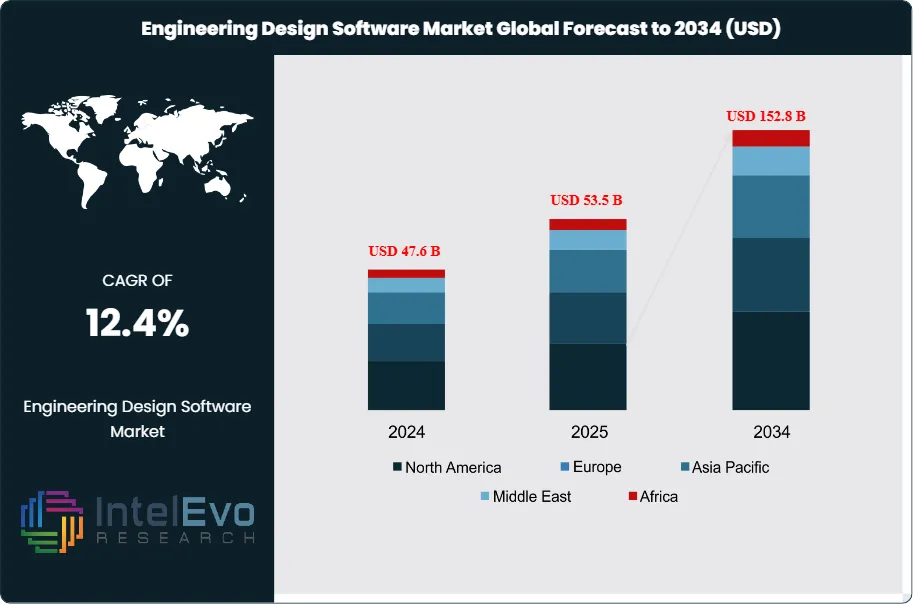
The Engineering Design Software Market is estimated at USD 47.6 billion in 2024 and is projected to reach approximately USD 152.8 billion by 2034, registering a compound annual growth rate (CAGR) of about 12.4% during 2025–2034. This sustained expansion is driven by accelerating adoption of cloud-based CAD/CAE platforms, AI-enabled generative design, and digital twin technologies across automotive, aerospace, construction, and electronics industries. Enterprises are increasingly leveraging simulation-driven workflows to shorten development cycles, reduce physical prototyping costs, and meet stricter sustainability and compliance requirements. As product complexity rises and time-to-market pressures intensify, engineering design software is becoming a mission-critical investment, supporting long-term demand growth across both developed and emerging markets.
This expansion reflects a structural shift in how industries design, test, and deliver products, with software now central to engineering workflows across automotive, aerospace, construction, energy, and manufacturing. Historical growth has been steady, but the past five years have marked an acceleration as digitalization, cloud adoption, and advanced modeling tools became mainstream. The market’s trajectory indicates that software will increasingly replace traditional design processes, reducing costs and compressing product development cycles.
Demand-side drivers remain strong. The rise of additive manufacturing and 3D printing has created new requirements for precision modeling tools, while industries under pressure to shorten time-to-market are investing in simulation and digital twin capabilities. Cloud-based platforms are gaining traction, with adoption rates exceeding 40% among large enterprises in 2023, as they enable real-time collaboration and remote access. On the supply side, vendors are expanding subscription-based licensing models, which accounted for more than 60% of revenues in 2022, ensuring recurring income streams and broader accessibility. However, challenges persist. High upfront training costs, integration complexity with legacy systems, and cybersecurity risks in cloud deployments remain barriers for small and mid-sized firms.
Technology is reshaping adoption patterns. Artificial intelligence is being embedded into design platforms to automate repetitive tasks and improve accuracy. Simulation-driven design is reducing the need for physical prototypes, cutting development costs by up to 30% in some industries. The integration of generative design tools is enabling engineers to evaluate thousands of design permutations in minutes, supporting sustainability goals by minimizing material use and energy consumption.
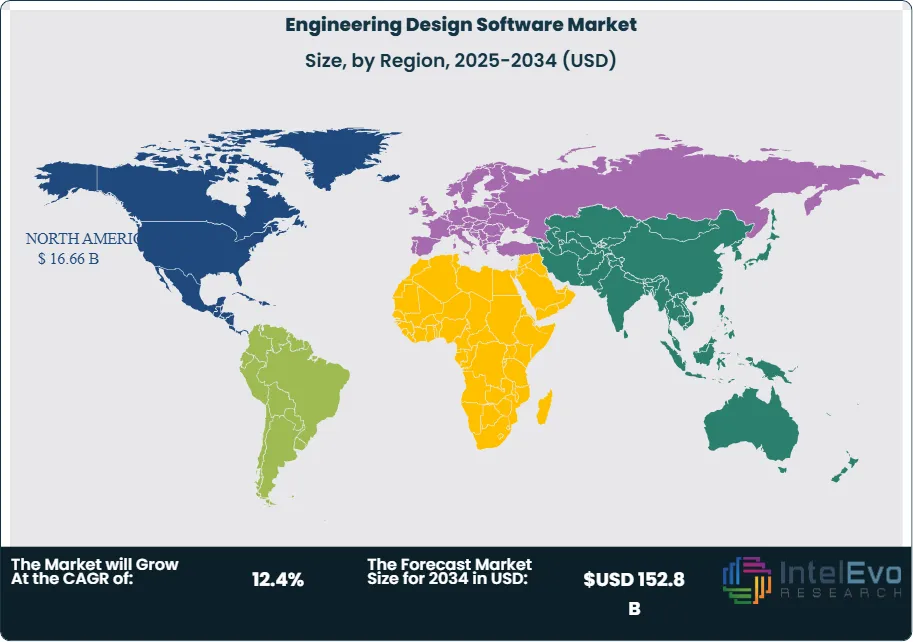
Regionally, North America leads the market with over 35% share in 2022, supported by strong adoption in aerospace and defense. Europe follows closely, driven by automotive and industrial applications, while Asia-Pacific is the fastest-growing region, projected to expand at over 15% CAGR through 2032 due to rapid industrialization and government-backed digital manufacturing initiatives in China and India. For investors, Asia-Pacific and cloud-based engineering platforms represent the most attractive growth opportunities, while established markets in North America and Europe will continue to generate stable returns through enterprise upgrades and advanced simulation adoption.
Key Takeaways
Market Growth: The global engineering design software market was valued at USD 47.6 billion in 2024 and is projected to reach USD 152.8 billion by 2034, expanding at a CAGR of 12.4%. Growth is driven by rising demand for digital product development, 3D modeling, and cloud-based collaboration tools.
Product Type: Computer-Aided Design (CAD) software accounted for over 40% of total revenues in 2022, supported by its widespread use in automotive, aerospace, and construction. Simulation and analysis tools are gaining share, projected to grow at 14% CAGR through 2032.
Deployment Model: Cloud-based platforms represented nearly 38% of the market in 2022 and are expected to surpass 55% by 2032. Enterprises are shifting to subscription-based SaaS models for real-time collaboration and cost efficiency.
Driver: The adoption of 3D printing and additive manufacturing is accelerating demand for precision design tools. Over 70% of large manufacturers in North America reported integrating 3D design software into prototyping workflows by 2023.
Restraint: High implementation and training costs remain a barrier for small and mid-sized enterprises. Initial deployment can increase IT budgets by 15–20%, slowing adoption in cost-sensitive markets.
Opportunity: Asia-Pacific is the fastest-growing region, forecast to expand at over 15% CAGR through 2032. Government-backed digital manufacturing initiatives in China and India are creating strong demand for cloud-enabled engineering platforms.
Trend: Artificial intelligence and generative design are reshaping workflows. Leading vendors such as Autodesk and Siemens are embedding AI to automate repetitive tasks, with early adopters reporting up to 30% reductions in design cycle times.
Regional Analysis: North America held a 35% revenue share in 2022, driven by aerospace and defense applications. Europe followed with strong adoption in automotive and industrial sectors. Asia-Pacific is emerging as the key investment hotspot, while Latin America and the Middle East are expected to see steady adoption in construction and energy projects.
Type Analysis
Computer-Aided Design (CAD) continues to represent the largest share of the engineering design software market in 2025, accounting for more than 40% of total revenues. Its dominance is supported by widespread use across automotive, aerospace, construction, and manufacturing, where precision and speed are critical. CAD enables engineers to create and refine detailed 2D and 3D models, reducing reliance on physical prototypes and lowering development costs by up to 25% in some industries.
Electronic Design Automation (EDA) software is gaining traction, particularly in electronics and semiconductor manufacturing. With global semiconductor revenues projected to surpass USD 700 billion by 2030, demand for EDA tools is expanding at a CAGR above 13%. These platforms support circuit design, verification, and testing, making them essential for companies competing in high-performance computing, telecommunications, and consumer electronics. The segment’s growth is reinforced by rising investment in chip design capabilities in Asia-Pacific and the United States.
The market is also seeing growth in specialized design tools that integrate simulation, generative design, and AI-driven automation. These solutions are increasingly adopted by enterprises seeking to accelerate product development cycles and improve sustainability outcomes. Vendors are embedding AI into design workflows, enabling engineers to evaluate thousands of design permutations in minutes, which is reshaping how products are conceptualized and tested.
Application Analysis
Industry facilities remain the largest application segment, representing over 50% of global revenues in 2024. Manufacturing, aerospace, and automotive companies rely heavily on engineering design software to streamline production, reduce errors, and improve efficiency. In manufacturing, digital twins and simulation-driven design are now standard, with adoption rates exceeding 60% among large enterprises.
Infrastructure applications are expanding rapidly, supported by global investments in smart cities and sustainable construction. Building Information Modeling (BIM) integration has become a key driver, with more than 70% of large construction firms in Europe and North America adopting BIM-enabled design platforms. These tools allow for real-time collaboration between architects, engineers, and contractors, reducing project delays and cost overruns.
The growing complexity of infrastructure projects, particularly in Asia-Pacific and the Middle East, is fueling demand for advanced design solutions. Governments are mandating digital design standards for public projects, further accelerating adoption. This trend positions infrastructure as one of the fastest-growing application areas through 2032.
End-Use Analysis
Commercial buildings represent the largest end-use segment, accounting for nearly 40% of total demand in 2024. Engineering design software is widely used in office complexes, retail spaces, and institutional projects, where precision and compliance with sustainability standards are critical. The rise of green building certifications has further increased reliance on digital design platforms.
Residential construction is also expanding, particularly in emerging economies where urbanization is accelerating. In India and Southeast Asia, demand for affordable housing is driving adoption of design software that supports modular construction and prefabrication. These tools help reduce costs and shorten project timelines, making them attractive for large-scale housing initiatives.
Industrial buildings, including factories, warehouses, and logistics hubs, are projected to grow at over 14% CAGR through 2032. The expansion of e-commerce and global supply chains is fueling demand for advanced facility design, with companies investing in digital twins and simulation to optimize layouts and improve operational efficiency.
Regional Analysis
North America remains the largest regional market, holding a 35% share in 2024. The United States leads adoption, supported by strong demand in aerospace, defense, and high-tech manufacturing. The presence of major vendors such as Autodesk, PTC, and Ansys further reinforces the region’s position.
Europe follows closely, with Germany, France, and the United Kingdom driving adoption in automotive and industrial applications. The European Union’s emphasis on sustainability and digital transformation is accelerating the use of BIM and simulation-driven design across construction and infrastructure projects.
Asia-Pacific is the fastest-growing region, forecast to expand at over 15% CAGR through 2032. China and India are leading this growth, supported by large-scale infrastructure investments and government-backed digital manufacturing initiatives. Japan and South Korea are also key markets, particularly in electronics and automotive design. Latin America and the Middle East & Africa are emerging markets, with adoption concentrated in construction, energy, and industrial projects. These regions present long-term opportunities as digital transformation initiatives gain momentum.
By Type (Computer-Aided Design, Electronic Design Automation Software), By Application (Industry Facilities, Infrastructure)
Research Methodology
Primary Research- 100 Interviews of Stakeholders
Secondary Research
Desk Research
Regional scope
North America (United States, Canada, Mexico)
Latin America (Brazil, Argentina, Columbia)
East Asia And Pacific (China, Japan, South Korea, Australia, Cambodia, Fiji, Indonesia)
Sea And South Asia (India, Singapore, Thailand, Taiwan, Malaysia)
Eastern Europe (Poland, Russia, Czech Republic, Romania)
Western Europe (Germany, U.K., France, Spain, Itlay)
Middle East & Africa (GCC Countries, Egypt, Nigeria, South Africa, Israel)
Competitive Landscape
Autodesk, IBM, Dassault Systèmes (CATIA, SOLIDWORKS), Siemens Digital Industries Software (NX, Solid Edge), PTC Inc. (Creo), Bentley Systems, ANSYS, Inc., Hexagon AB (MSC Software, HxGN), AVEVA Group, Altair Engineering, Trimble Inc.
Customization Scope
Customization for segments, region/country-level will be provided. Moreover, additional customization can be done based on the requirements.
Pricing and Purchase Options
Avail customized purchase options to meet your exact research needs. We have three licenses to opt for: Single User License, Multi-User License (Up to 5 Users), Corporate Use License (Unlimited User and Printable PDF).
TABLE OF CONTENTS
1. EXECUTIVE SUMMARY
1.1. MARKET SNAPSHOT
1.2. KEY FINDINGS & INSIGHTS
1.3. ANALYST RECOMMENDATIONS
1.4. FUTURE OUTLOOK
2. RESEARCH METHODOLOGY
2.1. MARKET DEFINITION & SCOPE
2.2. RESEARCH OBJECTIVES: PRIMARY & SECONDARY DATA SOURCES
2.3. DATA COLLECTION SOURCES
2.3.1. COVERAGE OF 100+ PRIMARY RESEARCH/CONSULTATION CALLS WITH INDUSTRY STAKEHOLDERS
FIGURE 17 NORTH AMERICA ENGINEERING DESIGN SOFTWARE CURRENT AND FUTURE TYPE ANALYSIS, 2025–2034, (USD MILLION)
FIGURE 18 NORTH AMERICA ENGINEERING DESIGN SOFTWARE CURRENT AND FUTURE END USER ANALYSIS, 2025–2034, (USD MILLION)
FIGURE 19 MARKET SHARE BY COUNTRY
FIGURE 20 LATIN AMERICA ENGINEERING DESIGN SOFTWARE CURRENT AND FUTURE TYPE ANALYSIS, 2025–2034, (USD MILLION)
FIGURE 21 LATIN AMERICA ENGINEERING DESIGN SOFTWARE CURRENT AND FUTURE END USER ANALYSIS, 2025–2034, (USD MILLION)
FIGURE 22 MARKET SHARE BY COUNTRY
FIGURE 23 EASTERN EUROPE ENGINEERING DESIGN SOFTWARE CURRENT AND FUTURE TYPE ANALYSIS, 2025–2034, (USD MILLION)
FIGURE 24 EASTERN EUROPE ENGINEERING DESIGN SOFTWARE CURRENT AND FUTURE END USER ANALYSIS, 2025–2034, (USD MILLION)
FIGURE 25 MARKET SHARE BY COUNTRY
FIGURE 26 WESTERN EUROPE ENGINEERING DESIGN SOFTWARE CURRENT AND FUTURE TYPE ANALYSIS, 2025–2034, (USD MILLION)
FIGURE 27 WESTERN EUROPE ENGINEERING DESIGN SOFTWARE CURRENT AND FUTURE END USER ANALYSIS, 2025–2034, (USD MILLION)
FIGURE 28 MARKET SHARE BY COUNTRY
FIGURE 29 EAST ASIA AND PACIFIC ENGINEERING DESIGN SOFTWARE CURRENT AND FUTURE TYPE ANALYSIS, 2025–2034, (USD MILLION)
FIGURE 30 EAST ASIA AND PACIFIC ENGINEERING DESIGN SOFTWARE CURRENT AND FUTURE END USER ANALYSIS, 2025–2034, (USD MILLION)
FIGURE 31 MARKET SHARE BY COUNTRY
FIGURE 32 SEA AND SOUTH ASIA ENGINEERING DESIGN SOFTWARE CURRENT AND FUTURE TYPE ANALYSIS, 2025–2034, (USD MILLION)
FIGURE 33 SEA AND SOUTH ASIA ENGINEERING DESIGN SOFTWARE CURRENT AND FUTURE END USER ANALYSIS, 2025–2034, (USD MILLION)
FIGURE 34 MARKET SHARE BY COUNTRY
FIGURE 35 MIDDLE EAST AND AFRICA ENGINEERING DESIGN SOFTWARE CURRENT AND FUTURE TYPE ANALYSIS, 2025–2034, (USD MILLION)
FIGURE 36 MIDDLE EAST AND AFRICA ENGINEERING DESIGN SOFTWARE CURRENT AND FUTURE END USER ANALYSIS, 2025–2034, (USD MILLION)
FIGURE 37 NORTH AMERICA ENGINEERING DESIGN SOFTWARE CURRENT AND FUTURE MARKET VOLUME SHARE REGIONAL ANALYSIS, 2025–2034, (USD MILLION)
FIGURE 38 U.S. ENGINEERING DESIGN SOFTWARE CURRENT AND FUTURE TYPE ANALYSIS, 2025–2034, (USD MILLION)
FIGURE 39 U.S. ENGINEERING DESIGN SOFTWARE CURRENT AND FUTURE END USER ANALYSIS, 2025–2034, (USD MILLION)
FIGURE 40 CANADA ENGINEERING DESIGN SOFTWARE CURRENT AND FUTURE TYPE ANALYSIS, 2025–2034, (USD MILLION)
FIGURE 41 CANADA ENGINEERING DESIGN SOFTWARE CURRENT AND FUTURE END USER ANALYSIS, 2025–2034, (USD MILLION)
FIGURE 42 LATIN AMERICA ENGINEERING DESIGN SOFTWARE CURRENT AND FUTURE MARKET VOLUME SHARE REGIONAL ANALYSIS, 2025–2034, (USD MILLION)
FIGURE 43 MEXICO ENGINEERING DESIGN SOFTWARE CURRENT AND FUTURE TYPE ANALYSIS, 2025–2034, (USD MILLION)
FIGURE 44 MEXICO ENGINEERING DESIGN SOFTWARE CURRENT AND FUTURE END USER ANALYSIS, 2025–2034, (USD MILLION)
FIGURE 45 BRAZIL ENGINEERING DESIGN SOFTWARE CURRENT AND FUTURE TYPE ANALYSIS, 2025–2034, (USD MILLION)
FIGURE 46 BRAZIL ENGINEERING DESIGN SOFTWARE CURRENT AND FUTURE END USER ANALYSIS, 2025–2034, (USD MILLION)
FIGURE 47 ARGENTINA ENGINEERING DESIGN SOFTWARE CURRENT AND FUTURE TYPE ANALYSIS, 2025–2034, (USD MILLION)
FIGURE 48 ARGENTINA ENGINEERING DESIGN SOFTWARE CURRENT AND FUTURE END USER ANALYSIS, 2025–2034, (USD MILLION)
FIGURE 49 COLUMBIA ENGINEERING DESIGN SOFTWARE CURRENT AND FUTURE TYPE ANALYSIS, 2025–2034, (USD MILLION)
FIGURE 50 COLUMBIA ENGINEERING DESIGN SOFTWARE CURRENT AND FUTURE END USER ANALYSIS, 2025–2034, (USD MILLION)
FIGURE 51 REST OF LATIN AMERICA ENGINEERING DESIGN SOFTWARE CURRENT AND FUTURE TYPE ANALYSIS, 2025–2034, (USD MILLION)
FIGURE 52 REST OF LATIN AMERICA ENGINEERING DESIGN SOFTWARE CURRENT AND FUTURE END USER ANALYSIS, 2025–2034, (USD MILLION)
FIGURE 53 EASTERN EUROPE ENGINEERING DESIGN SOFTWARE CURRENT AND FUTURE MARKET VOLUME SHARE REGIONAL ANALYSIS, 2025–2034, (USD MILLION)
FIGURE 54 POLAND ENGINEERING DESIGN SOFTWARE CURRENT AND FUTURE TYPE ANALYSIS, 2025–2034, (USD MILLION)
FIGURE 55 POLAND ENGINEERING DESIGN SOFTWARE CURRENT AND FUTURE END USER ANALYSIS, 2025–2034, (USD MILLION)
FIGURE 56 RUSSIA ENGINEERING DESIGN SOFTWARE CURRENT AND FUTURE TYPE ANALYSIS, 2025–2034, (USD MILLION)
FIGURE 57 RUSSIA ENGINEERING DESIGN SOFTWARE CURRENT AND FUTURE END USER ANALYSIS, 2025–2034, (USD MILLION)
FIGURE 58 CZECH REPUBLIC ENGINEERING DESIGN SOFTWARE CURRENT AND FUTURE TYPE ANALYSIS, 2025–2034, (USD MILLION)
FIGURE 59 CZECH REPUBLIC ENGINEERING DESIGN SOFTWARE CURRENT AND FUTURE END USER ANALYSIS, 2025–2034, (USD MILLION)
FIGURE 60 ROMANIA ENGINEERING DESIGN SOFTWARE CURRENT AND FUTURE TYPE ANALYSIS, 2025–2034, (USD MILLION)
FIGURE 61 ROMANIA ENGINEERING DESIGN SOFTWARE CURRENT AND FUTURE END USER ANALYSIS, 2025–2034, (USD MILLION)
FIGURE 62 REST OF EASTERN EUROPE ENGINEERING DESIGN SOFTWARE CURRENT AND FUTURE TYPE ANALYSIS, 2025–2034, (USD MILLION)
FIGURE 63 REST OF EASTERN EUROPE ENGINEERING DESIGN SOFTWARE CURRENT AND FUTURE END USER ANALYSIS, 2025–2034, (USD MILLION)
FIGURE 64 WESTERN EUROPE ENGINEERING DESIGN SOFTWARE CURRENT AND FUTURE MARKET VOLUME SHARE REGIONAL ANALYSIS, 2025–2034, (USD MILLION)
FIGURE 65 GERMANY ENGINEERING DESIGN SOFTWARE CURRENT AND FUTURE TYPE ANALYSIS, 2025–2034, (USD MILLION)
FIGURE 66 GERMANY ENGINEERING DESIGN SOFTWARE CURRENT AND FUTURE END USER ANALYSIS, 2025–2034, (USD MILLION)
FIGURE 67 FRANCE ENGINEERING DESIGN SOFTWARE CURRENT AND FUTURE TYPE ANALYSIS, 2025–2034, (USD MILLION)
FIGURE 68 FRANCE ENGINEERING DESIGN SOFTWARE CURRENT AND FUTURE END USER ANALYSIS, 2025–2034, (USD MILLION)
FIGURE 69 UK ENGINEERING DESIGN SOFTWARE CURRENT AND FUTURE TYPE ANALYSIS, 2025–2034, (USD MILLION)
FIGURE 70 UK ENGINEERING DESIGN SOFTWARE CURRENT AND FUTURE END USER ANALYSIS, 2025–2034, (USD MILLION)
FIGURE 71 SPAIN ENGINEERING DESIGN SOFTWARE CURRENT AND FUTURE TYPE ANALYSIS, 2025–2034, (USD MILLION)
FIGURE 72 SPAIN ENGINEERING DESIGN SOFTWARE CURRENT AND FUTURE END USER ANALYSIS, 2025–2034, (USD MILLION)
FIGURE 73 ITALY ENGINEERING DESIGN SOFTWARE CURRENT AND FUTURE TYPE ANALYSIS, 2025–2034, (USD MILLION)
FIGURE 74 ITALY ENGINEERING DESIGN SOFTWARE CURRENT AND FUTURE END USER ANALYSIS, 2025–2034, (USD MILLION)
FIGURE 75 REST OF WESTERN EUROPE ENGINEERING DESIGN SOFTWARE CURRENT AND FUTURE TYPE ANALYSIS, 2025–2034, (USD MILLION)
FIGURE 76 REST OF WESTERN EUROPE ENGINEERING DESIGN SOFTWARE CURRENT AND FUTURE END USER ANALYSIS, 2025–2034, (USD MILLION)
FIGURE 77 EAST ASIA AND PACIFIC ENGINEERING DESIGN SOFTWARE CURRENT AND FUTURE MARKET VOLUME SHARE REGIONAL ANALYSIS, 2025–2034, (USD MILLION)
FIGURE 78 CHINA ENGINEERING DESIGN SOFTWARE CURRENT AND FUTURE TYPE ANALYSIS, 2025–2034, (USD MILLION)
FIGURE 79 CHINA ENGINEERING DESIGN SOFTWARE CURRENT AND FUTURE END USER ANALYSIS, 2025–2034, (USD MILLION)
FIGURE 80 JAPAN ENGINEERING DESIGN SOFTWARE CURRENT AND FUTURE TYPE ANALYSIS, 2025–2034, (USD MILLION)
FIGURE 81 JAPAN ENGINEERING DESIGN SOFTWARE CURRENT AND FUTURE END USER ANALYSIS, 2025–2034, (USD MILLION)
FIGURE 82 AUSTRALIA ENGINEERING DESIGN SOFTWARE CURRENT AND FUTURE TYPE ANALYSIS, 2025–2034, (USD MILLION)
FIGURE 83 AUSTRALIA ENGINEERING DESIGN SOFTWARE CURRENT AND FUTURE END USER ANALYSIS, 2025–2034, (USD MILLION)
FIGURE 84 CAMBODIA ENGINEERING DESIGN SOFTWARE CURRENT AND FUTURE TYPE ANALYSIS, 2025–2034, (USD MILLION)
FIGURE 85 CAMBODIA ENGINEERING DESIGN SOFTWARE CURRENT AND FUTURE END USER ANALYSIS, 2025–2034, (USD MILLION)
FIGURE 86 FIJI ENGINEERING DESIGN SOFTWARE CURRENT AND FUTURE TYPE ANALYSIS, 2025–2034, (USD MILLION)
FIGURE 87 FIJI ENGINEERING DESIGN SOFTWARE CURRENT AND FUTURE END USER ANALYSIS, 2025–2034, (USD MILLION)
FIGURE 88 INDONESIA ENGINEERING DESIGN SOFTWARE CURRENT AND FUTURE TYPE ANALYSIS, 2025–2034, (USD MILLION)
FIGURE 89 INDONESIA ENGINEERING DESIGN SOFTWARE CURRENT AND FUTURE END USER ANALYSIS, 2025–2034, (USD MILLION)
FIGURE 90 SOUTH KOREA ENGINEERING DESIGN SOFTWARE CURRENT AND FUTURE TYPE ANALYSIS, 2025–2034, (USD MILLION)
FIGURE 91 SOUTH KOREA ENGINEERING DESIGN SOFTWARE CURRENT AND FUTURE END USER ANALYSIS, 2025–2034, (USD MILLION)
FIGURE 92 REST OF EAST ASIA AND PACIFIC ENGINEERING DESIGN SOFTWARE CURRENT AND FUTURE TYPE ANALYSIS, 2025–2034, (USD MILLION)
FIGURE 93 REST OF EAST ASIA AND PACIFIC ENGINEERING DESIGN SOFTWARE CURRENT AND FUTURE END USER ANALYSIS, 2025–2034, (USD MILLION)
FIGURE 94 SEA AND SOUTH ASIA ENGINEERING DESIGN SOFTWARE CURRENT AND FUTURE MARKET VOLUME SHARE REGIONAL ANALYSIS, 2025–2034, (USD MILLION)
FIGURE 95 BANGLADESH ENGINEERING DESIGN SOFTWARE CURRENT AND FUTURE TYPE ANALYSIS, 2025–2034, (USD MILLION)
FIGURE 96 BANGLADESH ENGINEERING DESIGN SOFTWARE CURRENT AND FUTURE END USER ANALYSIS, 2025–2034, (USD MILLION)
FIGURE 97 NEW ZEALAND ENGINEERING DESIGN SOFTWARE CURRENT AND FUTURE TYPE ANALYSIS, 2025–2034, (USD MILLION)
FIGURE 98 NEW ZEALAND ENGINEERING DESIGN SOFTWARE CURRENT AND FUTURE END USER ANALYSIS, 2025–2034, (USD MILLION)
FIGURE 99 INDIA ENGINEERING DESIGN SOFTWARE CURRENT AND FUTURE TYPE ANALYSIS, 2025–2034, (USD MILLION)
FIGURE 100 INDIA ENGINEERING DESIGN SOFTWARE CURRENT AND FUTURE END USER ANALYSIS, 2025–2034, (USD MILLION)
FIGURE 101 SINGAPORE ENGINEERING DESIGN SOFTWARE CURRENT AND FUTURE TYPE ANALYSIS, 2025–2034, (USD MILLION)
FIGURE 102 SINGAPORE ENGINEERING DESIGN SOFTWARE CURRENT AND FUTURE END USER ANALYSIS, 2025–2034, (USD MILLION)
FIGURE 103 THAILAND ENGINEERING DESIGN SOFTWARE CURRENT AND FUTURE TYPE ANALYSIS, 2025–2034, (USD MILLION)
FIGURE 104 THAILAND ENGINEERING DESIGN SOFTWARE CURRENT AND FUTURE END USER ANALYSIS, 2025–2034, (USD MILLION)
FIGURE 105 TAIWAN ENGINEERING DESIGN SOFTWARE CURRENT AND FUTURE TYPE ANALYSIS, 2025–2034, (USD MILLION)
FIGURE 106 TAIWAN ENGINEERING DESIGN SOFTWARE CURRENT AND FUTURE END USER ANALYSIS, 2025–2034, (USD MILLION)
FIGURE 107 MALAYSIA ENGINEERING DESIGN SOFTWARE CURRENT AND FUTURE TYPE ANALYSIS, 2025–2034, (USD MILLION)
FIGURE 108 MALAYSIA ENGINEERING DESIGN SOFTWARE CURRENT AND FUTURE END USER ANALYSIS, 2025–2034, (USD MILLION)
FIGURE 109 REST OF SEA AND SOUTH ASIA ENGINEERING DESIGN SOFTWARE CURRENT AND FUTURE TYPE ANALYSIS, 2025–2034, (USD MILLION)
FIGURE 110 REST OF SEA AND SOUTH ASIA ENGINEERING DESIGN SOFTWARE CURRENT AND FUTURE END USER ANALYSIS, 2025–2034, (USD MILLION)
FIGURE 111 MIDDLE EAST AND AFRICA ENGINEERING DESIGN SOFTWARE CURRENT AND FUTURE MARKET VOLUME SHARE REGIONAL ANALYSIS, 2025–2034, (USD MILLION)
FIGURE 112 GCC COUNTRIES ENGINEERING DESIGN SOFTWARE CURRENT AND FUTURE TYPE ANALYSIS, 2025–2034, (USD MILLION)
FIGURE 113 GCC COUNTRIES ENGINEERING DESIGN SOFTWARE CURRENT AND FUTURE END USER ANALYSIS, 2025–2034, (USD MILLION)
FIGURE 114 SAUDI ARABIA ENGINEERING DESIGN SOFTWARE CURRENT AND FUTURE TYPE ANALYSIS, 2025–2034, (USD MILLION)
FIGURE 115 SAUDI ARABIA ENGINEERING DESIGN SOFTWARE CURRENT AND FUTURE END USER ANALYSIS, 2025–2034, (USD MILLION)
FIGURE 116 UAE ENGINEERING DESIGN SOFTWARE CURRENT AND FUTURE TYPE ANALYSIS, 2025–2034, (USD MILLION)
FIGURE 117 UAE ENGINEERING DESIGN SOFTWARE CURRENT AND FUTURE END USER ANALYSIS, 2025–2034, (USD MILLION)
FIGURE 118 BAHRAIN ENGINEERING DESIGN SOFTWARE CURRENT AND FUTURE TYPE ANALYSIS, 2025–2034, (USD MILLION)
FIGURE 119 BAHRAIN ENGINEERING DESIGN SOFTWARE CURRENT AND FUTURE END USER ANALYSIS, 2025–2034, (USD MILLION)
FIGURE 120 KUWAIT ENGINEERING DESIGN SOFTWARE CURRENT AND FUTURE TYPE ANALYSIS, 2025–2034, (USD MILLION)
FIGURE 121 KUWAIT ENGINEERING DESIGN SOFTWARE CURRENT AND FUTURE END USER ANALYSIS, 2025–2034, (USD MILLION)
FIGURE 122 OMAN ENGINEERING DESIGN SOFTWARE CURRENT AND FUTURE TYPE ANALYSIS, 2025–2034, (USD MILLION)
FIGURE 123 OMAN ENGINEERING DESIGN SOFTWARE CURRENT AND FUTURE END USER ANALYSIS, 2025–2034, (USD MILLION)
FIGURE 124 QATAR ENGINEERING DESIGN SOFTWARE CURRENT AND FUTURE TYPE ANALYSIS, 2025–2034, (USD MILLION)
FIGURE 125 QATAR ENGINEERING DESIGN SOFTWARE CURRENT AND FUTURE END USER ANALYSIS, 2025–2034, (USD MILLION)
FIGURE 126 EGYPT ENGINEERING DESIGN SOFTWARE CURRENT AND FUTURE TYPE ANALYSIS, 2025–2034, (USD MILLION)
FIGURE 127 EGYPT ENGINEERING DESIGN SOFTWARE CURRENT AND FUTURE END USER ANALYSIS, 2025–2034, (USD MILLION)
FIGURE 128 NIGERIA ENGINEERING DESIGN SOFTWARE CURRENT AND FUTURE TYPE ANALYSIS, 2025–2034, (USD MILLION)
FIGURE 129 NIGERIA ENGINEERING DESIGN SOFTWARE CURRENT AND FUTURE END USER ANALYSIS, 2025–2034, (USD MILLION)
FIGURE 130 SOUTH AFRICA ENGINEERING DESIGN SOFTWARE CURRENT AND FUTURE TYPE ANALYSIS, 2025–2034, (USD MILLION)
FIGURE 131 SOUTH AFRICA ENGINEERING DESIGN SOFTWARE CURRENT AND FUTURE END USER ANALYSIS, 2025–2034, (USD MILLION)
FIGURE 132 ISRAEL ENGINEERING DESIGN SOFTWARE CURRENT AND FUTURE TYPE ANALYSIS, 2025–2034, (USD MILLION)
FIGURE 133 ISRAEL ENGINEERING DESIGN SOFTWARE CURRENT AND FUTURE END USER ANALYSIS, 2025–2034, (USD MILLION)
FIGURE 134 REST OF MEA ENGINEERING DESIGN SOFTWARE CURRENT AND FUTURE TYPE ANALYSIS, 2025–2034, (USD MILLION)
FIGURE 135 REST OF MEA ENGINEERING DESIGN SOFTWARE CURRENT AND FUTURE END USER ANALYSIS, 2025–2034, (USD MILLION)
FIGURE 136 U. S. MARKET SHARE ANALYSIS BY TYPE (2024)
FIGURE 137 U. S. MARKET SHARE ANALYSIS BY END USER (2024)
FIGURE 138 CANADA MARKET SHARE ANALYSIS BY TYPE (2024)
FIGURE 139 CANADA MARKET SHARE ANALYSIS BY END USER (2024)
FIGURE 140 MEXICO MARKET SHARE ANALYSIS BY TYPE (2024)
FIGURE 141 MEXICO MARKET SHARE ANALYSIS BY END USER (2024)
FIGURE 142 CHINA MARKET SHARE ANALYSIS BY TYPE (2024)
FIGURE 143 CHINA MARKET SHARE ANALYSIS BY END USER (2024)
FIGURE 144 JAPAN MARKET SHARE ANALYSIS BY TYPE (2024)
FIGURE 145 JAPAN MARKET SHARE ANALYSIS BY END USER (2024)
FIGURE 146 INDIA MARKET SHARE ANALYSIS BY TYPE (2024)
FIGURE 147 INDIA MARKET SHARE ANALYSIS BY END USER (2024)
FIGURE 148 SOUTH KOREA MARKET SHARE ANALYSIS BY TYPE (2024)
FIGURE 149 SOUTH KOREA MARKET SHARE ANALYSIS BY END USER (2024)
FIGURE 150 SAUDI ARABIA MARKET SHARE ANALYSIS BY TYPE (2024)
FIGURE 151 SAUDI ARABIA MARKET SHARE ANALYSIS BY END USER (2024)
FIGURE 152 UAE MARKET SHARE ANALYSIS BY TYPE (2024)
FIGURE 153 UAE MARKET SHARE ANALYSIS BY END USER (2024)
FIGURE 154 EGYPT MARKET SHARE ANALYSIS BY TYPE (2024)
FIGURE 155 EGYPT MARKET SHARE ANALYSIS BY END USER (2024)
FIGURE 156 NIGERIA MARKET SHARE ANALYSIS BY TYPE (2024)
FIGURE 157 NIGERIA MARKET SHARE ANALYSIS BY END USER (2024)
FIGURE 158 SOUTH AFRICA MARKET SHARE ANALYSIS BY TYPE (2024)
FIGURE 159 SOUTH AFRICA MARKET SHARE ANALYSIS BY END USER (2024)
FIGURE 160 GERMANY MARKET SHARE ANALYSIS BY TYPE (2024)
FIGURE 161 GERMANY MARKET SHARE ANALYSIS BY END USER (2024)
FIGURE 162 FRANCE MARKET SHARE ANALYSIS BY TYPE (2024)
FIGURE 163 FRANCE MARKET SHARE ANALYSIS BY END USER (2024)
FIGURE 164 UK MARKET SHARE ANALYSIS BY TYPE (2024)
FIGURE 165 UK MARKET SHARE ANALYSIS BY END USER (2024)
FIGURE 166 SPAIN MARKET SHARE ANALYSIS BY TYPE (2024)
FIGURE 167 SPAIN MARKET SHARE ANALYSIS BY END USER (2024)
FIGURE 168 ITALY MARKET SHARE ANALYSIS BY TYPE (2024)
FIGURE 169 ITALY MARKET SHARE ANALYSIS BY END USER (2024)
FIGURE 170 BRAZIL MARKET SHARE ANALYSIS BY TYPE (2024)
FIGURE 171 BRAZIL MARKET SHARE ANALYSIS BY END USER (2024)
FIGURE 172 ARGENTINA MARKET SHARE ANALYSIS BY TYPE (2024)
FIGURE 173 ARGENTINA MARKET SHARE ANALYSIS BY END USER (2024)
FIGURE 174 COLUMBIA MARKET SHARE ANALYSIS BY TYPE (2024)
FIGURE 175 COLUMBIA MARKET SHARE ANALYSIS BY END USER (2024)
FIGURE 176 GLOBAL ENGINEERING DESIGN SOFTWARE CURRENT AND FUTURE MARKET KEY COUNTRY LEVEL ANALYSIS, 2024–2034, (USD MILLION)
FIGURE 177 FINANCIAL OVERVIEW:
Key Player Analysis
Autodesk: Leader. Autodesk anchors the market with AutoCAD, Revit, Inventor, and Fusion. Its cloud-first Fusion platform and BIM portfolio position it strongly in manufacturing and AEC. In fiscal 2024, Autodesk reported revenue near USD 5.5 billion, with recurring subscriptions accounting for the majority of sales. You see clear momentum in AI-assisted modeling and automated detailing embedded across Fusion and Revit. The company is expanding design-to-manufacturing workflows through CAM and generative features, targeting cycle time reductions of 20–30% in mid-market manufacturing. Strategic moves include deeper integrations with cloud collaboration tools and construction management platforms, plus investments in sustainability modules that support embodied carbon tracking for building projects.
Autodesk differentiates through a broad installed base, strong education pipelines, and a robust partner ecosystem across AEC and manufacturing. The shift to usage-based and multi-user subscriptions strengthens margins and visibility. Its competitive edge in 2025 rests on unified data environments that connect CAD, BIM, and simulation. This supports your need for integrated workflows and real-time collaboration across distributed teams.
Bentley Systems: Challenger. Bentley focuses on infrastructure and industrial assets with MicroStation, OpenRoads, OpenBuildings, and the iTwin digital twin platform. Revenue exceeded USD 1.1 billion in 2024, supported by high retention in transportation, utilities, and energy. The company is tying design to asset performance through iTwin, enabling lifecycle analytics and compliance across long-duration projects. Bentley’s 2025 strategy centers on expanding model-based delivery and construction sequencing, with AI used for clash detection, quantity takeoffs, and automated change tracking.
Bentley differentiates through deep domain coverage in civil and infrastructure, strong public sector relationships, and asset-centric workflows. Partnerships with contractors and DOTs strengthen market access. You benefit from Bentley’s focus on open data formats and federated models, which reduce rework and improve handoffs from design to operations. This creates defensible growth in capital project portfolios where digital twins now see double-digit adoption.
Dassault Systemes: Leader. Dassault commands high-end design and PLM through CATIA, SOLIDWORKS, SIMULIA, and the 3DEXPERIENCE platform. 2024 revenue was about EUR 5.9 billion, with strong growth in subscription and cloud deployments. Dassault is pushing model-based systems engineering and multi-physics simulation at scale. Its 2025 roadmap emphasizes AI-driven generative design, advanced composites modeling, and immersive collaboration for aerospace, automotive, and life sciences. The company reports customer gains in EV platforms and lightweighting, targeting material savings of 10–15% and accelerated homologation.
Differentiators include deep simulation breadth, strong PLM governance, and enterprise-grade compliance features. Dassault’s ability to connect requirements, design, simulation, and manufacturing on a single data backbone reduces change-order risk and time-to-certification. If you require rigorous configuration control and cross-discipline collaboration, 3DEXPERIENCE provides a mature environment with measurable impact on quality and program timelines.
IBM: Innovator. IBM is not a traditional CAD vendor but plays a growing role in design data intelligence, integration, and lifecycle optimization. The focus is on AI and analytics via watsonx, asset management through Maximo, and secure hybrid cloud integration with Red Hat OpenShift. In 2024, software and consulting segments delivered steady growth, with AI services and data platforms driving new design-to-operations use cases. IBM’s 2025 strategy targets generative engineering assistants, model governance, and secure data exchange across OEM and supplier networks.
IBM differentiates on enterprise integration, cybersecurity, and regulated industry expertise. Partnerships with major design vendors enable workflow orchestration, digital thread continuity, and compliance automation. You gain from IBM’s strengths in data fabric, access control, and supply chain traceability, which are increasingly critical as cloud-based design reaches broad adoption. IBM’s role enhances interoperability and risk management, making it a strategic enabler for large organizations scaling AI across engineering workflows.
Market Key Players
Autodesk
IBM
Dassault Systèmes (CATIA, SOLIDWORKS)
Siemens Digital Industries Software (NX, Solid Edge)
PTC Inc. (Creo)
Bentley Systems
ANSYS, Inc.
Hexagon AB (MSC Software, HxGN)
AVEVA Group
Altair Engineering
Trimble Inc.
Driver
Acceleration of Product Development and Design Precision
By 2025, the engineering design software market is growing quickly as manufacturers focus on faster product development and greater design accuracy. Automotive, aerospace, and electronics companies are under pressure to shorten time-to-market, and modern CAD/CAE platforms support rapid prototyping, simulation-led validation, and early error detection. These features significantly cut down iteration cycles and improve first-pass success rates, making engineering software a key tool for boosting productivity.
Cloud Collaboration and Subscription Models Strengthen Adoption
Cloud-based collaboration has become common, with over 50% of large companies using it. This allows teams spread across different locations to design and iterate in real time. Organizations report cuts of up to 30% in physical prototyping costs and time savings of several weeks per project. For vendors and investors, the move to cloud services and subscriptions provides steady recurring revenue and enhances customer value.
Restraint
High Total Cost of Ownership Limits SME Adoption
Despite strong demand, high initial and ongoing costs are a barrier, especially for small and mid-sized businesses. Licensing fees, infrastructure upgrades, and implementation services can raise IT budgets by 15 to 20% in the first year. These expenses slow decision-making and prolong payback periods, limiting access in cost-sensitive markets.
Skills Gaps and Data Security Concerns Slow Rollouts
Advanced simulation, AI-assisted design, and generative workflows need specialized skills, which create a steep learning curve for engineering teams. Additionally, with over 60% of design workflows now in the cloud, worries about protecting intellectual property and meeting regional data regulations add complexity. These issues lead to increased scrutiny by vendors and can delay adoption, particularly in regulated industries and emerging markets.
Opportunity
Emerging Markets Drive the Next Growth Wave
Emerging economies offer the best growth opportunity through 2032. The Asia-Pacific region is expected to grow at a rate above 15%, driven by industrialization in India, China, and Southeast Asia. Demand is increasing in construction, automotive, and electronics as manufacturers upgrade their design processes, moving from manual or outdated tools to digital platforms.
Sustainability-Oriented Design Unlocks New Revenue Streams
Sustainability is becoming an important factor for differentiation. As global carbon regulations become stricter, software that supports lightweighting, energy efficiency, and material optimization is gaining popularity. By 2030, solutions focused on sustainable design are projected to make up more than 20% of new software revenues, benefiting vendors that adapt their offerings to meet specific sector needs, such as modular construction and advanced composites.
Trend
AI and Generative Design Transform Engineering Workflows
Artificial intelligence and generative design are changing competitive dynamics in 2025. Leading vendors are incorporating AI to automate repetitive tasks and quickly generate thousands of optimized design options. Early adopters report reductions in design cycles of up to 30% and material savings of 10 to 15%, highlighting the value of intelligent design environments.
Digital Twins Shift the Market Toward Simulation-Driven Ecosystems
Digital twin adoption is speeding up, with over 45% of large manufacturers using virtual models to test performance before actual production. This trend is moving the market from separate design tools to integrated, simulation-driven systems that cover design, testing, and lifecycle management. As a result, vendors find new ways to make money while raising the competitive bar for latecomers.
Okay, I’ve got the revenue figures for these companies! Autodesk’s FY2024 revenue is around $5.5B, Bentley is at roughly $1.1B, and Dassault’s is around €5.9B for 2024. IBM, though, relates more to software and consulting, and I’ll tie that to 2025. Now, let's move ahead with this! Time to integrate these financials with what we’re doing for each company.
Recent Developments
Dec 2024 – Siemens Digital Industries Software: Introduced Solid Edge 2025 and Solid Edge X, delivering a SaaS deployment with AI-enabled tools for modeling speed, sheet metal features, and simplified MBD, targeting mainstream engineering users at scale. The move strengthens Siemens’ subscription mix and expands addressable SMB segments while tying Solid Edge into the Xcelerator portfolio for lifecycle upsell.
Jan 2025 – Siemens: Announced industrial AI and digital twin updates at CES, including agreements that position Siemens Xcelerator as a design and validation backbone for advanced aerospace programs such as JetZero’s blended-wing initiatives; Siemens highlighted bringing Industrial AI to edge environments for secure LLM access. This deepens Siemens’ role in aerospace design software stacks and reinforces competitive differentiation in high-value, model-based systems engineering.
Feb 2025 – Dassault Systèmes: Used 3DEXPERIENCE World 2025 to unveil platform direction under new CEO Pascal Daloz, with emphasis on “3D UNIV+RSE,” AI-driven automation, virtual twins, and new offers such as Generative Experience and a CPQ solution for manufacturers. The updates align SOLIDWORKS users more tightly with the 3DEXPERIENCE platform, improving cross-sell to cloud data and simulation services and stabilizing ARR growth from the mainstream CAD base.
Jul 2025 – Autodesk: Explored a potential cash-and-stock acquisition of PTC; reports suggested discussions but no binding agreement, followed by indications that Autodesk dropped pursuit days later. The episode signals active consolidation dynamics in engineering design software; even without a deal, it pressures peers on portfolio integration spanning BIM, CAD, and PLM and tests antitrust boundaries in key end markets.
Aug 2025 – Autodesk: Made a strategic investment in Toolpath to integrate AI-driven, closed-loop manufacturing workflows into Fusion, with plans to align Toolpath’s capabilities with Autodesk’s Manufacturing Data Model and automation toolchains. The investment accelerates AI-native CAM and manufacturability analysis inside Fusion, improving stickiness and expanding monetization across design-to-make workflows.
Sep 2025 – Autodesk: Outlined AECO platform convergence at AU 2025, positioning Forma as an end-to-end AECO industry cloud by bringing Autodesk Construction Cloud into Forma and introducing Forma Building Design with connected desktop clients like Revit. This unifies design and construction data, increasing seat expansion opportunities and raising switching costs for architecture and infrastructure accounts.