Global eVTOL Aircraft Market Size, Share & Industry Analysis by Aircraft Type (Passenger eVTOL, Cargo eVTOL, Air Taxi), by Propulsion & Power Source (Battery Electric, Hybrid Electric), by Range & Payload Capacity, by Application (Urban Air Mobility, Air Taxi Services, Logistics & Cargo, Emergency Medical Services, Defense & Security), by End User (Commercial Operators, Government & Defense), Regional Outlook, Key Players, Market Dynamics, Investment Trends & Forecast 2025–2034
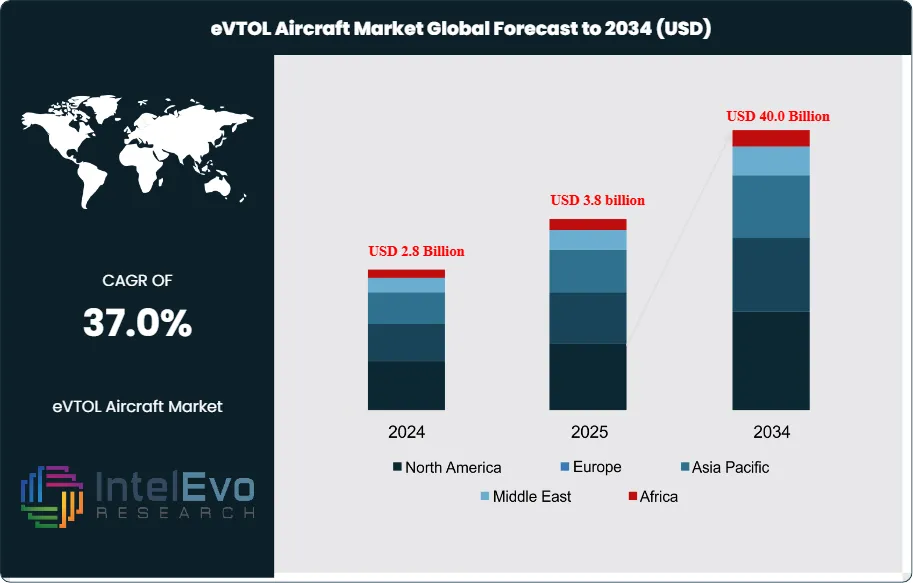
The eVTOL Aircraft Market is estimated at USD 2.8 billion in 2024 and is on track to reach roughly USD 40 billion by 2034, implying a compound annual growth rate of 37.0% over 2025–2034. This exceptional growth trajectory is driven by accelerating investments in urban air mobility, rising demand for sustainable aviation solutions, and strong backing from governments and private investors. Rapid advancements in battery technology, autonomous flight systems, and regulatory frameworks are further bringing commercial eVTOL deployment closer to reality. As major aerospace players and startups race toward certification and pilot programs, the market is positioned to redefine short-distance air transport over the next decade.
This projection reflects rapid commercialisation driven by improvements in battery energy density, falling unit costs, and sustained private and public capital inflows. Base-year revenues concentrate in demonstrator programs and early commercial pilots, while 2034 revenues shift to recurring operations and service contracts. By 2034, commercial intra-city travel and air taxi services are projected to represent roughly 45% of total market revenue, emergency medical services 20%, and cargo and logistics 15%, with the balance from training, maintenance, and infrastructure fees.
Demand dynamics show strong urban adoption where average trip distances are under 100 miles and congestion imposes high economic costs. Supply-side forces include OEM scale-up, battery cell capacity expansion, and new vertiport construction. Battery energy density gains average 6–8% per annum in industry forecasts. Integration of AI and automation reduces pilot-related operating expense by an estimated 15–25% and improves dispatch efficiency. Digitalisation of traffic management and predictive maintenance will lift aircraft utilisation by an estimated 10 percentage points relative to current rotorcraft norms.
Regulatory frameworks present a mixed picture. Certification timelines shorten in jurisdictions with clear UAM roadmaps, while airspace integration and noise ordinances extend project lead times in dense urban centres. Noise levels near 65 decibels support closer urban operations compared with helicopters. Governments in North America and Asia Pacific have announced funding and trials that position those regions as investment hotspots. Market share by region for 2024 is estimated at North America 40%, Asia Pacific 30%, Europe 20%, Rest of World 10%. By 2034, Asia Pacific share rises to 35% as domestic mobility programs scale.
Key risk factors include battery raw material supply constraints, certification delays, public acceptance following any safety incident, and infrastructure permitting. Financing risk concentrates in late-stage manufacturing funding where capital intensity escalates. Strategic opportunities exist in vertically integrated service models and in software-enabled fleet management. Investors should treat timelines as contingent on regulatory progress and onshore industrial policy. Operational metrics, including a typical range of 60–100 miles and per-flight emission reductions up to 80% relative to conventional aviation, support a strong case for continued capital deployment.
Key Takeaways
Market Growth: The global eVTOL aircraft market grows from USD 2.8 billion in 2024 to USD 40.0 billion by 2034. The CAGR reaches 36.8 percent, driven by higher investment in urban air mobility programs and steady improvements in battery performance.
Lift Technology: Vectored Thrust leads the lift technology segment with 42.1 percent share in 2024. OEMs favor this configuration for higher control authority and better payload efficiency during commercial operations.
Mode of Operation: Piloted aircraft hold a 33.2 percent share in 2024. Regulators and operators rely on piloted models to speed up certification and early route approvals while autonomous systems mature.
Range: The 200–500 km range category accounts for 56.7 percent of the market in 2024. Operators prefer this range for high-frequency regional and urban missions that balance payload, energy use, and route profitability.
Maximum Take-off Weight: Units under 250 kg secure 28.5 percent share in 2024. These models attract interest from cargo and short-hop service providers due to lower development costs and simplified regulatory requirements.
Application: Commercial use cases lead with 47.5 percent share in 2024. Demand rises for scheduled air taxi operations, regional connectors, and medical transport services in congested metro areas.
Driver: Battery density increases by roughly 6 to 8 percent each year, enabling longer routes and lower operating cost. OEMs report double-digit reductions in energy expense as pack efficiency improves.
Restraint: Certification timelines extend project launch dates by 12 to 24 months in several markets. Airspace integration and noise rules slow scale-up for operators planning dense urban routes.
Opportunity: Asia Pacific emerges as a high-growth region. National mobility programs support double-digit fleet expansion and signal strong demand for aircraft in the 200–500 km category.
Trend: Automation and AI-based flight management reduce pilot workload and strengthen safety systems. Early testing shows up to 20 percent improvement in dispatch reliability for fleets using advanced analytics.
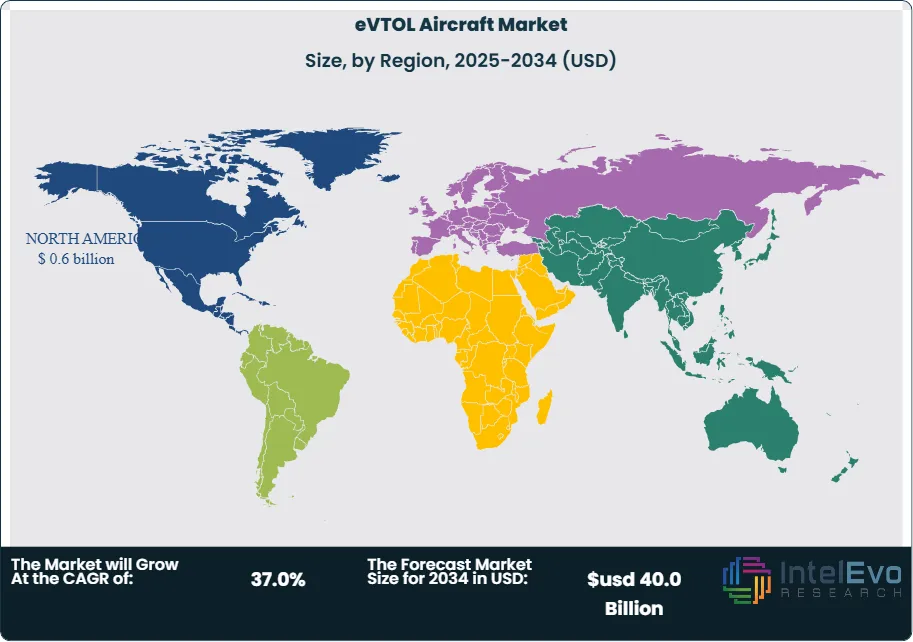
Regional Analysis: North America holds 36.5 percent share and USD 0.62 billion revenue in 2024. Asia Pacific gains momentum at a faster CAGR due to infrastructure investment and early commercial trials.
Lift Technology Analysis
The lift technology landscape continues to shift as the eVTOL market enters 2025 with growing commercial trials and certification activity. Vectored Thrust retains the largest position, holding more than 42 percent of global deployments in the latest assessment. Operators value this configuration for its maneuverability during dense urban operations and for its ability to support higher-speed routes. Multirotor platforms maintain close to 30 percent share. You see this segment gain steady interest from service providers targeting short-range, high-frequency missions where simplicity and redundancy remain priorities.
Lift Plus Cruise follows with roughly 28 percent share. This hybrid configuration appeals to programs focused on extended-range regional links. The segment benefits from advances in battery output and lighter propulsion assemblies, which extend effective range while controlling noise levels. Certification bodies across North America, Europe, and Asia Pacific continue to test performance and safety standards for all three architectures. The rising pipeline of commercial air taxi pilots signals stronger adoption across these lift categories through 2030.
These lift technologies shape investment decisions for aircraft developers and infrastructure partners. Each configuration presents different performance limits, cost structures, and regulatory pathways. Your assessment of route planning, battery cycles, and maintenance profiles will determine which models deliver the strongest returns in early commercial networks.
Mode of Operation Analysis
Piloted aircraft lead the operational mix heading into 2025 with more than 33 percent share. Regulators continue to prioritize piloted systems for initial passenger services, which supports faster approval cycles and stronger public confidence. Semi-autonomous configurations follow closely with a similar share. Operators adopt these systems to reduce cockpit workload and improve routing accuracy during high-density operations.
Autonomous aircraft hold close to 34 percent share. Their growth accelerates as AI-based flight management, detect-and-avoid sensors, and cloud-based traffic coordination improve. You see major OEMs preparing for phased transitions from piloted to fully autonomous operations as infrastructure and regulatory frameworks mature. Testing corridors in the United States, Europe, China, and the Gulf states show rising flight hours, which helps validate autonomy software and maintenance standards.
This mix reflects an industry balancing safety requirements with the cost benefits of automation. As regulators publish new frameworks for autonomous passenger and cargo missions, adoption rates across semi-autonomous and autonomous systems will rise through the next decade.
Range Analysis
The 200 to 500 km range class holds more than 56 percent share in the latest dataset. This segment fits emerging air taxi and regional mobility routes where operators seek to replace short-haul ground transport. Aircraft in this category benefit from steady gains in lithium-based battery density and thermal management. The 0 to 200 km segment continues to serve inner-city applications. It attracts interest from delivery networks and medical response providers who value rapid turnaround times and smaller landing footprints.
Route economics drive these share distributions. Longer-range models deliver higher revenue per trip and support intercity operations, while shorter-range aircraft fit dense mobility networks in metro regions. Battery costs and charging infrastructure expansion will influence segment growth through 2030.
Maximum Take-off Weight Analysis
Aircraft under 250 kg secured more than 28 percent share in the most recent analysis. This category expands in logistics and emergency support due to lower certification hurdles and lower operating expenses. Programs above 1500 kg form the fastest-growing category, supported by commercial passenger operators and defense agencies seeking higher payload capacity and extended mission ranges.
Weight class selection shapes procurement strategies. Lighter aircraft provide faster deployment cycles, while higher-weight platforms deliver broader mission versatility. Your operational model determines which category offers the strongest margins.
Propulsion Type Analysis
Battery-electric systems remain the dominant propulsion type in 2025 deployments. Their share rises as energy density improves and charging infrastructure expands across major cities. Hybrid-electric aircraft gain interest for regional missions where operators need higher reliability during extended flights. Hydrogen-electric propulsion remains in early testing. Japan, Germany, and the United States report progress in fuel-cell integration, positioning the segment for gradual adoption after 2030.
Propulsion choices influence cost per flight, emission reductions, and maintenance scheduling. Operators planning long-range services may consider hybrid systems, while urban operators benefit from the lower operating cost of battery-electric aircraft
Application Analysis
Commercial services account for more than 47 percent of global eVTOL demand. Air taxi programs, scheduled regional links, and express logistics drive this segment. Military agencies increase investment in surveillance, perimeter security, and rapid-response missions. Emergency medical services emerge as a high-growth segment. Faster response times and lower operating cost attract interest from hospitals and public agencies evaluating alternatives to traditional rotorcraft.
Each application category carries its own regulatory and certification requirements. You will see adoption accelerate as authorities approve dedicated air corridors for passenger and cargo flights.
By End-Use
Commercial buildings represent the highest adoption rate as property developers integrate vertiports into mixed-use projects. Real estate groups in the United States, UAE, and South Korea announce partnerships to enable rooftop access for air taxi operations. Residential demand grows in premium developments that plan private landing pads. Industrial facilities evaluate eVTOLs for site-to-site transport and emergency operations.
End-use patterns align with urban congestion levels, land availability, and local permitting rules. Markets with strong public-private partnerships move faster toward integration.
Regional Analysis
North America leads with more than 36 percent share and revenue above USD 0.6 billion. The region benefits from strong OEM presence, FAA-led regulatory pathways, and early vertiport development in major cities. Europe follows with steady progress supported by environmental mandates and joint government-industry pilot programs.
Asia Pacific records the fastest growth. China, South Korea, and Japan increase flight testing and invest in hydrogen and battery-electric propulsion ecosystems. Latin America and the Middle East & Africa remain early-stage markets. Both regions explore eVTOL corridors for tourism, medical response, and remote-area access.
Regional adoption will depend on airspace regulation, infrastructure funding, and public readiness for aerial mobility services through 2035.
By Lift Technology, Vectored Thrust, Multirotor, Lift Plus Cruise, By Mode of Operation, Piloted, Autonomous, Semi-Autonomous, By Range, 0-200 Km, 200-500 Km, By Maximum Take-off Weight (MTOW), <250 Kg, 250-500 Kg, 500-1500 Kg, >1500 Kg, By Propulsion Type, Battery-Electric, Hybrid-Electric, Hydrogen-Electric, By Application, Commercial, Military, Emergency Medical Service
Research Methodology
Primary Research- 100 Interviews of Stakeholders
Secondary Research
Desk Research
Regional scope
North America (United States, Canada, Mexico)
Latin America (Brazil, Argentina, Columbia)
East Asia And Pacific (China, Japan, South Korea, Australia, Cambodia, Fiji, Indonesia)
Sea And South Asia (India, Singapore, Thailand, Taiwan, Malaysia)
Eastern Europe (Poland, Russia, Czech Republic, Romania)
Western Europe (Germany, U.K., France, Spain, Itlay)
Middle East & Africa (GCC Countries, Egypt, Nigeria, South Africa, Israel)
Competitive Landscape
EHang Holdings Ltd., Beta Technologies, Elbit Systems Ltd., Joby Aviation, Volocopter, Airbus SE, Jaunt Air Mobility, EHang Holdings Limited
Customization Scope
Customization for segments, region/country-level will be provided. Moreover, additional customization can be done based on the requirements.
Pricing and Purchase Options
Avail customized purchase options to meet your exact research needs. We have three licenses to opt for: Single User License, Multi-User License (Up to 5 Users), Corporate Use License (Unlimited User and Printable PDF).
TABLE OF CONTENTS
1. EXECUTIVE SUMMARY
1.1. MARKET SNAPSHOT
1.2. KEY FINDINGS & INSIGHTS
1.3. ANALYST RECOMMENDATIONS
1.4. FUTURE OUTLOOK
2. RESEARCH METHODOLOGY
2.1. MARKET DEFINITION & SCOPE
2.2. RESEARCH OBJECTIVES: PRIMARY & SECONDARY DATA SOURCES
2.3. DATA COLLECTION SOURCES
2.3.1. COVERAGE OF 100+ PRIMARY RESEARCH/CONSULTATION CALLS WITH INDUSTRY STAKEHOLDERS
FIGURE 17 NORTH AMERICA EVTOL AIRCRAFT CURRENT AND FUTURE TYPE ANALYSIS, 2025–2034, (USD MILLION)
FIGURE 18 NORTH AMERICA EVTOL AIRCRAFT CURRENT AND FUTURE END USER ANALYSIS, 2025–2034, (USD MILLION)
FIGURE 19 MARKET SHARE BY COUNTRY
FIGURE 20 LATIN AMERICA EVTOL AIRCRAFT CURRENT AND FUTURE TYPE ANALYSIS, 2025–2034, (USD MILLION)
FIGURE 21 LATIN AMERICA EVTOL AIRCRAFT CURRENT AND FUTURE END USER ANALYSIS, 2025–2034, (USD MILLION)
FIGURE 22 MARKET SHARE BY COUNTRY
FIGURE 23 EASTERN EUROPE EVTOL AIRCRAFT CURRENT AND FUTURE TYPE ANALYSIS, 2025–2034, (USD MILLION)
FIGURE 24 EASTERN EUROPE EVTOL AIRCRAFT CURRENT AND FUTURE END USER ANALYSIS, 2025–2034, (USD MILLION)
FIGURE 25 MARKET SHARE BY COUNTRY
FIGURE 26 WESTERN EUROPE EVTOL AIRCRAFT CURRENT AND FUTURE TYPE ANALYSIS, 2025–2034, (USD MILLION)
FIGURE 27 WESTERN EUROPE EVTOL AIRCRAFT CURRENT AND FUTURE END USER ANALYSIS, 2025–2034, (USD MILLION)
FIGURE 28 MARKET SHARE BY COUNTRY
FIGURE 29 EAST ASIA AND PACIFIC EVTOL AIRCRAFT CURRENT AND FUTURE TYPE ANALYSIS, 2025–2034, (USD MILLION)
FIGURE 30 EAST ASIA AND PACIFIC EVTOL AIRCRAFT CURRENT AND FUTURE END USER ANALYSIS, 2025–2034, (USD MILLION)
FIGURE 31 MARKET SHARE BY COUNTRY
FIGURE 32 SEA AND SOUTH ASIA EVTOL AIRCRAFT CURRENT AND FUTURE TYPE ANALYSIS, 2025–2034, (USD MILLION)
FIGURE 33 SEA AND SOUTH ASIA EVTOL AIRCRAFT CURRENT AND FUTURE END USER ANALYSIS, 2025–2034, (USD MILLION)
FIGURE 34 MARKET SHARE BY COUNTRY
FIGURE 35 MIDDLE EAST AND AFRICA EVTOL AIRCRAFT CURRENT AND FUTURE TYPE ANALYSIS, 2025–2034, (USD MILLION)
FIGURE 36 MIDDLE EAST AND AFRICA EVTOL AIRCRAFT CURRENT AND FUTURE END USER ANALYSIS, 2025–2034, (USD MILLION)
FIGURE 37 NORTH AMERICA EVTOL AIRCRAFT CURRENT AND FUTURE MARKET VOLUME SHARE REGIONAL ANALYSIS, 2025–2034, (USD MILLION)
FIGURE 38 U.S. EVTOL AIRCRAFT CURRENT AND FUTURE TYPE ANALYSIS, 2025–2034, (USD MILLION)
FIGURE 39 U.S. EVTOL AIRCRAFT CURRENT AND FUTURE END USER ANALYSIS, 2025–2034, (USD MILLION)
FIGURE 40 CANADA EVTOL AIRCRAFT CURRENT AND FUTURE TYPE ANALYSIS, 2025–2034, (USD MILLION)
FIGURE 41 CANADA EVTOL AIRCRAFT CURRENT AND FUTURE END USER ANALYSIS, 2025–2034, (USD MILLION)
FIGURE 42 LATIN AMERICA EVTOL AIRCRAFT CURRENT AND FUTURE MARKET VOLUME SHARE REGIONAL ANALYSIS, 2025–2034, (USD MILLION)
FIGURE 43 MEXICO EVTOL AIRCRAFT CURRENT AND FUTURE TYPE ANALYSIS, 2025–2034, (USD MILLION)
FIGURE 44 MEXICO EVTOL AIRCRAFT CURRENT AND FUTURE END USER ANALYSIS, 2025–2034, (USD MILLION)
FIGURE 45 BRAZIL EVTOL AIRCRAFT CURRENT AND FUTURE TYPE ANALYSIS, 2025–2034, (USD MILLION)
FIGURE 46 BRAZIL EVTOL AIRCRAFT CURRENT AND FUTURE END USER ANALYSIS, 2025–2034, (USD MILLION)
FIGURE 47 ARGENTINA EVTOL AIRCRAFT CURRENT AND FUTURE TYPE ANALYSIS, 2025–2034, (USD MILLION)
FIGURE 48 ARGENTINA EVTOL AIRCRAFT CURRENT AND FUTURE END USER ANALYSIS, 2025–2034, (USD MILLION)
FIGURE 49 COLUMBIA EVTOL AIRCRAFT CURRENT AND FUTURE TYPE ANALYSIS, 2025–2034, (USD MILLION)
FIGURE 50 COLUMBIA EVTOL AIRCRAFT CURRENT AND FUTURE END USER ANALYSIS, 2025–2034, (USD MILLION)
FIGURE 51 REST OF LATIN AMERICA EVTOL AIRCRAFT CURRENT AND FUTURE TYPE ANALYSIS, 2025–2034, (USD MILLION)
FIGURE 52 REST OF LATIN AMERICA EVTOL AIRCRAFT CURRENT AND FUTURE END USER ANALYSIS, 2025–2034, (USD MILLION)
FIGURE 53 EASTERN EUROPE EVTOL AIRCRAFT CURRENT AND FUTURE MARKET VOLUME SHARE REGIONAL ANALYSIS, 2025–2034, (USD MILLION)
FIGURE 54 POLAND EVTOL AIRCRAFT CURRENT AND FUTURE TYPE ANALYSIS, 2025–2034, (USD MILLION)
FIGURE 55 POLAND EVTOL AIRCRAFT CURRENT AND FUTURE END USER ANALYSIS, 2025–2034, (USD MILLION)
FIGURE 56 RUSSIA EVTOL AIRCRAFT CURRENT AND FUTURE TYPE ANALYSIS, 2025–2034, (USD MILLION)
FIGURE 57 RUSSIA EVTOL AIRCRAFT CURRENT AND FUTURE END USER ANALYSIS, 2025–2034, (USD MILLION)
FIGURE 58 CZECH REPUBLIC EVTOL AIRCRAFT CURRENT AND FUTURE TYPE ANALYSIS, 2025–2034, (USD MILLION)
FIGURE 59 CZECH REPUBLIC EVTOL AIRCRAFT CURRENT AND FUTURE END USER ANALYSIS, 2025–2034, (USD MILLION)
FIGURE 60 ROMANIA EVTOL AIRCRAFT CURRENT AND FUTURE TYPE ANALYSIS, 2025–2034, (USD MILLION)
FIGURE 61 ROMANIA EVTOL AIRCRAFT CURRENT AND FUTURE END USER ANALYSIS, 2025–2034, (USD MILLION)
FIGURE 62 REST OF EASTERN EUROPE EVTOL AIRCRAFT CURRENT AND FUTURE TYPE ANALYSIS, 2025–2034, (USD MILLION)
FIGURE 63 REST OF EASTERN EUROPE EVTOL AIRCRAFT CURRENT AND FUTURE END USER ANALYSIS, 2025–2034, (USD MILLION)
FIGURE 64 WESTERN EUROPE EVTOL AIRCRAFT CURRENT AND FUTURE MARKET VOLUME SHARE REGIONAL ANALYSIS, 2025–2034, (USD MILLION)
FIGURE 65 GERMANY EVTOL AIRCRAFT CURRENT AND FUTURE TYPE ANALYSIS, 2025–2034, (USD MILLION)
FIGURE 66 GERMANY EVTOL AIRCRAFT CURRENT AND FUTURE END USER ANALYSIS, 2025–2034, (USD MILLION)
FIGURE 67 FRANCE EVTOL AIRCRAFT CURRENT AND FUTURE TYPE ANALYSIS, 2025–2034, (USD MILLION)
FIGURE 68 FRANCE EVTOL AIRCRAFT CURRENT AND FUTURE END USER ANALYSIS, 2025–2034, (USD MILLION)
FIGURE 69 UK EVTOL AIRCRAFT CURRENT AND FUTURE TYPE ANALYSIS, 2025–2034, (USD MILLION)
FIGURE 70 UK EVTOL AIRCRAFT CURRENT AND FUTURE END USER ANALYSIS, 2025–2034, (USD MILLION)
FIGURE 71 SPAIN EVTOL AIRCRAFT CURRENT AND FUTURE TYPE ANALYSIS, 2025–2034, (USD MILLION)
FIGURE 72 SPAIN EVTOL AIRCRAFT CURRENT AND FUTURE END USER ANALYSIS, 2025–2034, (USD MILLION)
FIGURE 73 ITALY EVTOL AIRCRAFT CURRENT AND FUTURE TYPE ANALYSIS, 2025–2034, (USD MILLION)
FIGURE 74 ITALY EVTOL AIRCRAFT CURRENT AND FUTURE END USER ANALYSIS, 2025–2034, (USD MILLION)
FIGURE 75 REST OF WESTERN EUROPE EVTOL AIRCRAFT CURRENT AND FUTURE TYPE ANALYSIS, 2025–2034, (USD MILLION)
FIGURE 76 REST OF WESTERN EUROPE EVTOL AIRCRAFT CURRENT AND FUTURE END USER ANALYSIS, 2025–2034, (USD MILLION)
FIGURE 77 EAST ASIA AND PACIFIC EVTOL AIRCRAFT CURRENT AND FUTURE MARKET VOLUME SHARE REGIONAL ANALYSIS, 2025–2034, (USD MILLION)
FIGURE 78 CHINA EVTOL AIRCRAFT CURRENT AND FUTURE TYPE ANALYSIS, 2025–2034, (USD MILLION)
FIGURE 79 CHINA EVTOL AIRCRAFT CURRENT AND FUTURE END USER ANALYSIS, 2025–2034, (USD MILLION)
FIGURE 80 JAPAN EVTOL AIRCRAFT CURRENT AND FUTURE TYPE ANALYSIS, 2025–2034, (USD MILLION)
FIGURE 81 JAPAN EVTOL AIRCRAFT CURRENT AND FUTURE END USER ANALYSIS, 2025–2034, (USD MILLION)
FIGURE 82 AUSTRALIA EVTOL AIRCRAFT CURRENT AND FUTURE TYPE ANALYSIS, 2025–2034, (USD MILLION)
FIGURE 83 AUSTRALIA EVTOL AIRCRAFT CURRENT AND FUTURE END USER ANALYSIS, 2025–2034, (USD MILLION)
FIGURE 84 CAMBODIA EVTOL AIRCRAFT CURRENT AND FUTURE TYPE ANALYSIS, 2025–2034, (USD MILLION)
FIGURE 85 CAMBODIA EVTOL AIRCRAFT CURRENT AND FUTURE END USER ANALYSIS, 2025–2034, (USD MILLION)
FIGURE 86 FIJI EVTOL AIRCRAFT CURRENT AND FUTURE TYPE ANALYSIS, 2025–2034, (USD MILLION)
FIGURE 87 FIJI EVTOL AIRCRAFT CURRENT AND FUTURE END USER ANALYSIS, 2025–2034, (USD MILLION)
FIGURE 88 INDONESIA EVTOL AIRCRAFT CURRENT AND FUTURE TYPE ANALYSIS, 2025–2034, (USD MILLION)
FIGURE 89 INDONESIA EVTOL AIRCRAFT CURRENT AND FUTURE END USER ANALYSIS, 2025–2034, (USD MILLION)
FIGURE 90 SOUTH KOREA EVTOL AIRCRAFT CURRENT AND FUTURE TYPE ANALYSIS, 2025–2034, (USD MILLION)
FIGURE 91 SOUTH KOREA EVTOL AIRCRAFT CURRENT AND FUTURE END USER ANALYSIS, 2025–2034, (USD MILLION)
FIGURE 92 REST OF EAST ASIA AND PACIFIC EVTOL AIRCRAFT CURRENT AND FUTURE TYPE ANALYSIS, 2025–2034, (USD MILLION)
FIGURE 93 REST OF EAST ASIA AND PACIFIC EVTOL AIRCRAFT CURRENT AND FUTURE END USER ANALYSIS, 2025–2034, (USD MILLION)
FIGURE 94 SEA AND SOUTH ASIA EVTOL AIRCRAFT CURRENT AND FUTURE MARKET VOLUME SHARE REGIONAL ANALYSIS, 2025–2034, (USD MILLION)
FIGURE 95 BANGLADESH EVTOL AIRCRAFT CURRENT AND FUTURE TYPE ANALYSIS, 2025–2034, (USD MILLION)
FIGURE 96 BANGLADESH EVTOL AIRCRAFT CURRENT AND FUTURE END USER ANALYSIS, 2025–2034, (USD MILLION)
FIGURE 97 NEW ZEALAND EVTOL AIRCRAFT CURRENT AND FUTURE TYPE ANALYSIS, 2025–2034, (USD MILLION)
FIGURE 98 NEW ZEALAND EVTOL AIRCRAFT CURRENT AND FUTURE END USER ANALYSIS, 2025–2034, (USD MILLION)
FIGURE 99 INDIA EVTOL AIRCRAFT CURRENT AND FUTURE TYPE ANALYSIS, 2025–2034, (USD MILLION)
FIGURE 100 INDIA EVTOL AIRCRAFT CURRENT AND FUTURE END USER ANALYSIS, 2025–2034, (USD MILLION)
FIGURE 101 SINGAPORE EVTOL AIRCRAFT CURRENT AND FUTURE TYPE ANALYSIS, 2025–2034, (USD MILLION)
FIGURE 102 SINGAPORE EVTOL AIRCRAFT CURRENT AND FUTURE END USER ANALYSIS, 2025–2034, (USD MILLION)
FIGURE 103 THAILAND EVTOL AIRCRAFT CURRENT AND FUTURE TYPE ANALYSIS, 2025–2034, (USD MILLION)
FIGURE 104 THAILAND EVTOL AIRCRAFT CURRENT AND FUTURE END USER ANALYSIS, 2025–2034, (USD MILLION)
FIGURE 105 TAIWAN EVTOL AIRCRAFT CURRENT AND FUTURE TYPE ANALYSIS, 2025–2034, (USD MILLION)
FIGURE 106 TAIWAN EVTOL AIRCRAFT CURRENT AND FUTURE END USER ANALYSIS, 2025–2034, (USD MILLION)
FIGURE 107 MALAYSIA EVTOL AIRCRAFT CURRENT AND FUTURE TYPE ANALYSIS, 2025–2034, (USD MILLION)
FIGURE 108 MALAYSIA EVTOL AIRCRAFT CURRENT AND FUTURE END USER ANALYSIS, 2025–2034, (USD MILLION)
FIGURE 109 REST OF SEA AND SOUTH ASIA EVTOL AIRCRAFT CURRENT AND FUTURE TYPE ANALYSIS, 2025–2034, (USD MILLION)
FIGURE 110 REST OF SEA AND SOUTH ASIA EVTOL AIRCRAFT CURRENT AND FUTURE END USER ANALYSIS, 2025–2034, (USD MILLION)
FIGURE 111 MIDDLE EAST AND AFRICA EVTOL AIRCRAFT CURRENT AND FUTURE MARKET VOLUME SHARE REGIONAL ANALYSIS, 2025–2034, (USD MILLION)
FIGURE 112 GCC COUNTRIES EVTOL AIRCRAFT CURRENT AND FUTURE TYPE ANALYSIS, 2025–2034, (USD MILLION)
FIGURE 113 GCC COUNTRIES EVTOL AIRCRAFT CURRENT AND FUTURE END USER ANALYSIS, 2025–2034, (USD MILLION)
FIGURE 114 SAUDI ARABIA EVTOL AIRCRAFT CURRENT AND FUTURE TYPE ANALYSIS, 2025–2034, (USD MILLION)
FIGURE 115 SAUDI ARABIA EVTOL AIRCRAFT CURRENT AND FUTURE END USER ANALYSIS, 2025–2034, (USD MILLION)
FIGURE 116 UAE EVTOL AIRCRAFT CURRENT AND FUTURE TYPE ANALYSIS, 2025–2034, (USD MILLION)
FIGURE 117 UAE EVTOL AIRCRAFT CURRENT AND FUTURE END USER ANALYSIS, 2025–2034, (USD MILLION)
FIGURE 118 BAHRAIN EVTOL AIRCRAFT CURRENT AND FUTURE TYPE ANALYSIS, 2025–2034, (USD MILLION)
FIGURE 119 BAHRAIN EVTOL AIRCRAFT CURRENT AND FUTURE END USER ANALYSIS, 2025–2034, (USD MILLION)
FIGURE 120 KUWAIT EVTOL AIRCRAFT CURRENT AND FUTURE TYPE ANALYSIS, 2025–2034, (USD MILLION)
FIGURE 121 KUWAIT EVTOL AIRCRAFT CURRENT AND FUTURE END USER ANALYSIS, 2025–2034, (USD MILLION)
FIGURE 122 OMAN EVTOL AIRCRAFT CURRENT AND FUTURE TYPE ANALYSIS, 2025–2034, (USD MILLION)
FIGURE 123 OMAN EVTOL AIRCRAFT CURRENT AND FUTURE END USER ANALYSIS, 2025–2034, (USD MILLION)
FIGURE 124 QATAR EVTOL AIRCRAFT CURRENT AND FUTURE TYPE ANALYSIS, 2025–2034, (USD MILLION)
FIGURE 125 QATAR EVTOL AIRCRAFT CURRENT AND FUTURE END USER ANALYSIS, 2025–2034, (USD MILLION)
FIGURE 126 EGYPT EVTOL AIRCRAFT CURRENT AND FUTURE TYPE ANALYSIS, 2025–2034, (USD MILLION)
FIGURE 127 EGYPT EVTOL AIRCRAFT CURRENT AND FUTURE END USER ANALYSIS, 2025–2034, (USD MILLION)
FIGURE 128 NIGERIA EVTOL AIRCRAFT CURRENT AND FUTURE TYPE ANALYSIS, 2025–2034, (USD MILLION)
FIGURE 129 NIGERIA EVTOL AIRCRAFT CURRENT AND FUTURE END USER ANALYSIS, 2025–2034, (USD MILLION)
FIGURE 130 SOUTH AFRICA EVTOL AIRCRAFT CURRENT AND FUTURE TYPE ANALYSIS, 2025–2034, (USD MILLION)
FIGURE 131 SOUTH AFRICA EVTOL AIRCRAFT CURRENT AND FUTURE END USER ANALYSIS, 2025–2034, (USD MILLION)
FIGURE 132 ISRAEL EVTOL AIRCRAFT CURRENT AND FUTURE TYPE ANALYSIS, 2025–2034, (USD MILLION)
FIGURE 133 ISRAEL EVTOL AIRCRAFT CURRENT AND FUTURE END USER ANALYSIS, 2025–2034, (USD MILLION)
FIGURE 134 REST OF MEA EVTOL AIRCRAFT CURRENT AND FUTURE TYPE ANALYSIS, 2025–2034, (USD MILLION)
FIGURE 135 REST OF MEA EVTOL AIRCRAFT CURRENT AND FUTURE END USER ANALYSIS, 2025–2034, (USD MILLION)
FIGURE 136 U. S. MARKET SHARE ANALYSIS BY TYPE (2024)
FIGURE 137 U. S. MARKET SHARE ANALYSIS BY END USER (2024)
FIGURE 138 CANADA MARKET SHARE ANALYSIS BY TYPE (2024)
FIGURE 139 CANADA MARKET SHARE ANALYSIS BY END USER (2024)
FIGURE 140 MEXICO MARKET SHARE ANALYSIS BY TYPE (2024)
FIGURE 141 MEXICO MARKET SHARE ANALYSIS BY END USER (2024)
FIGURE 142 CHINA MARKET SHARE ANALYSIS BY TYPE (2024)
FIGURE 143 CHINA MARKET SHARE ANALYSIS BY END USER (2024)
FIGURE 144 JAPAN MARKET SHARE ANALYSIS BY TYPE (2024)
FIGURE 145 JAPAN MARKET SHARE ANALYSIS BY END USER (2024)
FIGURE 146 INDIA MARKET SHARE ANALYSIS BY TYPE (2024)
FIGURE 147 INDIA MARKET SHARE ANALYSIS BY END USER (2024)
FIGURE 148 SOUTH KOREA MARKET SHARE ANALYSIS BY TYPE (2024)
FIGURE 149 SOUTH KOREA MARKET SHARE ANALYSIS BY END USER (2024)
FIGURE 150 SAUDI ARABIA MARKET SHARE ANALYSIS BY TYPE (2024)
FIGURE 151 SAUDI ARABIA MARKET SHARE ANALYSIS BY END USER (2024)
FIGURE 152 UAE MARKET SHARE ANALYSIS BY TYPE (2024)
FIGURE 153 UAE MARKET SHARE ANALYSIS BY END USER (2024)
FIGURE 154 EGYPT MARKET SHARE ANALYSIS BY TYPE (2024)
FIGURE 155 EGYPT MARKET SHARE ANALYSIS BY END USER (2024)
FIGURE 156 NIGERIA MARKET SHARE ANALYSIS BY TYPE (2024)
FIGURE 157 NIGERIA MARKET SHARE ANALYSIS BY END USER (2024)
FIGURE 158 SOUTH AFRICA MARKET SHARE ANALYSIS BY TYPE (2024)
FIGURE 159 SOUTH AFRICA MARKET SHARE ANALYSIS BY END USER (2024)
FIGURE 160 GERMANY MARKET SHARE ANALYSIS BY TYPE (2024)
FIGURE 161 GERMANY MARKET SHARE ANALYSIS BY END USER (2024)
FIGURE 162 FRANCE MARKET SHARE ANALYSIS BY TYPE (2024)
FIGURE 163 FRANCE MARKET SHARE ANALYSIS BY END USER (2024)
FIGURE 164 UK MARKET SHARE ANALYSIS BY TYPE (2024)
FIGURE 165 UK MARKET SHARE ANALYSIS BY END USER (2024)
FIGURE 166 SPAIN MARKET SHARE ANALYSIS BY TYPE (2024)
FIGURE 167 SPAIN MARKET SHARE ANALYSIS BY END USER (2024)
FIGURE 168 ITALY MARKET SHARE ANALYSIS BY TYPE (2024)
FIGURE 169 ITALY MARKET SHARE ANALYSIS BY END USER (2024)
FIGURE 170 BRAZIL MARKET SHARE ANALYSIS BY TYPE (2024)
FIGURE 171 BRAZIL MARKET SHARE ANALYSIS BY END USER (2024)
FIGURE 172 ARGENTINA MARKET SHARE ANALYSIS BY TYPE (2024)
FIGURE 173 ARGENTINA MARKET SHARE ANALYSIS BY END USER (2024)
FIGURE 174 COLUMBIA MARKET SHARE ANALYSIS BY TYPE (2024)
FIGURE 175 COLUMBIA MARKET SHARE ANALYSIS BY END USER (2024)
FIGURE 176 GLOBAL EVTOL AIRCRAFT CURRENT AND FUTURE MARKET KEY COUNTRY LEVEL ANALYSIS, 2024–2034, (USD MILLION)
FIGURE 177 FINANCIAL OVERVIEW:
Key Player Analysis
EHang Holdings Ltd.: EHang positions itself as a leader in autonomous eVTOL development with a portfolio focused on passenger-grade aircraft and unmanned aerial systems. The company strengthens its market position through fully autonomous platforms that target urban mobility, tourism corridors, and emergency response. By 2025, EHang advances toward scaled operations in China after securing multiple approvals for commercial demonstration flights. Its EH216 series accounts for a significant share of domestic pilot programs, supported by partnerships with municipal authorities and tourism operators. EHang differentiates its strategy through end-to-end control systems that integrate flight management, battery monitoring, and ground coordination into a unified platform. This model appeals to operators seeking predictable operating cost and reduced pilot dependency as autonomy becomes more accepted across Asia Pacific.
EHang’s expansion strategy includes joint infrastructure projects for vertiports and autonomous command centers. These investments strengthen long-term revenue opportunities and help you assess the firm’s ability to maintain early-mover advantage. The company continues to scale production capacity to meet demand projections linked to China’s urban mobility initiatives, which plan for thousands of annual eVTOL sorties by the end of the decade.
Elbit Systems Ltd.: Elbit Systems operates as a strong challenger with deep experience in avionics, autonomous control, and defense-grade sensors. The company extends its capabilities into the eVTOL market through mission systems, onboard safety software, and flight automation components used by both commercial and military partners. In 2025, Elbit benefits from rising procurement in surveillance and logistics missions that rely on advanced detection and communication layers. Its avionics suites support high-reliability operations in congested airspace, which positions the firm as a preferred supplier for programs seeking enhanced situational awareness and redundancy.
Strategically, Elbit invests in collaborations with eVTOL OEMs to integrate its autonomy stack into piloted and semi-autonomous configurations. These partnerships give the company a stake in long-term fleet deployments rather than one-off component sales. Its global defense relationships and strong presence in Europe and the Middle East provide a steady pipeline of projects, including cross-border security operations that require lightweight aerial platforms. This balance of commercial and defense exposure helps you view Elbit as a stable, technology-focused contender in the sector.
Embraer SA: Embraer positions itself as a major market leader through its subsidiary Eve Air Mobility. The company uses its commercial aviation expertise, global service network, and established regulatory relationships to accelerate eVTOL integration into existing aviation ecosystems. By 2025, Eve secures thousands of provisional aircraft orders from operators in North America, Europe, and Latin America. Embraer’s experience in certification and fleet support gives the company a structural advantage over newer entrants. Its eVTOL design emphasizes lower maintenance cost and modular propulsion, which appeals to operators planning multi-city air taxi networks.
The company expands through partnerships with airport authorities, vertiport developers, and regional governments. These collaborations support flight corridor planning, air traffic management interfaces, and service models tied to Embraer’s broader aviation infrastructure. The firm’s strong presence in Brazil and the United States gives it access to two of the most active early deployment zones. Its global MRO network helps operators manage fleet uptime and safety metrics as eVTOL services scale. Embraer’s strategic integration of aircraft production, training, and operational support positions the company as a long-term anchor for commercial eVTOL deployment.
MarketKey Players
EHang Holdings Ltd.
Beta Technologies
Elbit Systems Ltd.
Joby Aviation
Volocopter
Airbus SE
Jaunt Air Mobility
EHang Holdings Limited
Driver:
Urban Congestion and Sustainability Push
By 2025, global demand for faster, cleaner mobility is accelerating eVTOL adoption as cities struggle with chronic congestion and emission targets. Urban traffic density continues to rise, and eVTOL services offer route time reductions of more than 40% compared with ground transport on high-frequency corridors. This efficiency advantage is particularly compelling for megacities where last-mile bottlenecks constrain productivity and quality of life. At the same time, steady improvements in battery energy density—advancing at roughly 6–8% annually—are extending flight range while lowering cost per trip. Governments are supporting this transition by opening low-altitude air mobility corridors across the United States, Europe, and parts of Asia. Together, congestion pressure, decarbonization mandates, and maturing propulsion technology are driving sustained capital inflows into aircraft platforms, software systems, and vertiport ecosystems.
Technology Maturity and Regulatory Enablement
Advances in flight control systems, distributed electric propulsion, and lightweight materials are strengthening confidence in eVTOL safety and reliability. Manufacturers are demonstrating higher dispatch reliability during pilot programs, which reassures regulators and infrastructure partners. These technical gains reduce perceived operational risk and support broader ecosystem participation. Regulatory agencies are also playing a more active enabling role. Aviation authorities are expanding sandbox programs and conditional certifications that allow controlled commercial trials. This staged regulatory approach helps you validate operational models while refining safety standards, accelerating the path from prototype testing to limited revenue service.
Restraint:
Infrastructure Readiness Constraints
Despite strong momentum, infrastructure gaps remain a major restraint in 2025. Vertiports, high-capacity charging systems, and designated landing zones are developing more slowly than aircraft programs, which limits route density and raises early-stage capital requirements. These bottlenecks force operators to concentrate services in a small number of urban nodes rather than pursue network-scale deployment. Certification frameworks also vary significantly by region, creating approval delays of 12–24 months for some commercial programs. Differences in airspace integration rules, pilot requirements, and vehicle certification increase compliance complexity. As a result, operators prioritize phased rollouts and demonstration routes instead of aggressive expansion, slowing near-term revenue realization.
Public Acceptance and Compliance Pressure
Public perception around noise, safety, and visual impact continues to influence regulatory pace. Community concerns restrict landing permissions in dense residential zones, even where technical noise levels meet regulatory thresholds. This social dimension adds uncertainty to site selection and increases stakeholder engagement costs. In parallel, regulators are tightening requirements for redundancy, detect-and-avoid systems, and cyber-secure flight controls. These measures improve long-term safety but raise development and certification expenses in the short term. For you, higher compliance spending can compress margins during early commercialization phases.
Opportunity:
Cargo, Emergency, and Regional Use Cases
The strongest growth opportunities are emerging beyond passenger air taxis. Cargo logistics, emergency medical response, and regional mobility offer faster commercialization paths due to lower regulatory and social barriers. By 2030, autonomous cargo eVTOL operations alone are projected to generate more than USD 3 billion annually, driven by demand for rapid, low-cost short-haul delivery. Governments are increasingly partnering with operators to co-invest in vertiports and charging hubs near logistics centers and hospitals. This collaboration reduces infrastructure risk and accelerates scale-up. For you, these segments provide earlier cash flow and operational learning that can later support passenger-focused expansion.
Autonomy and Cost-Efficiency Upside
Advances in autonomy and AI-based traffic management represent another major opportunity. Pilot-optional or remotely supervised operations can significantly reduce cost per seat mile and enable higher service frequency. These capabilities are particularly valuable for regional routes and non-passenger missions where economics are highly sensitive to labor costs. As autonomy matures, operators gain flexibility to deploy fleets across multiple use cases with higher asset utilization. This improves return on invested capital and strengthens the long-term business case for large-scale eVTOL networks.
Trend:
Autonomous Flight as a Strategic Differentiator
Autonomy is emerging as the defining trend shaping competition in 2025. Advanced flight management systems now support automated routing, precision landing, and contingency handling, reducing pilot workload by more than 50% in trial operations. These capabilities improve safety consistency and operational scalability. Developers are also designing multi-mission platforms that can switch between passenger transport, cargo delivery, and emergency services. This flexibility allows you to adapt fleet deployment based on demand patterns and regulatory readiness, improving utilization across market cycles.
Noise Reduction and Integrated Infrastructure Development
Noise mitigation is becoming a central design priority as operators target acceptance in dense urban environments. Aircraft manufacturers are pushing toward the 60–65 decibel threshold required for routine operations in city corridors, using optimized rotor designs and advanced materials. At the same time, airport authorities and real estate developers are planning integrated vertiport projects within commercial districts and transport hubs. These investments signal growing infrastructure readiness and reinforce the long-term shift toward quieter, automated, and multi-use eVTOL fleets capable of sustained commercial operations.
Recent Developments
Dec 2024 – Joby Aviation: Joby completed three of five formal FAA type certification stages and reported progress into the fourth phase while also conducting flight tests in South Korea under the K-UAM Grand Challenge. These milestones validate Joby’s certification trajectory and broaden its test-data set for international approvals, supporting planned commercial launches and pilot training programs.
Feb 2025 – Lilium GmbH: Lilium filed for insolvency after a proposed €200 million rescue failed to materialize, triggering workforce reductions and an operational pause that affected roughly 1,000 employees. The exit removes a high-profile competitor and frees up engineers, intellectual property, and supplier capacity; it also increases consolidation risks for remaining OEMs and suppliers.
Apr 2025 – Volocopter GmbH: Volocopter entered formal restructuring talks with new industrial partners and confirmed investor negotiations that preserved its European certification path; the company announced a reorganisation plan to stabilize cash flow and resume type approval work. The transaction preserves the VoloCity certification pipeline and keeps European vertiport trials viable, which maintains market continuity for regional regulators and infrastructure partners.
Jul 2025 – Archer Aviation: Archer announced first crewed flights of its Midnight P1 prototype and accelerated flight-test hours across its U.S. corridors; the company also confirmed a recent $430 million capital raise to support product development and a defense-focused partnership. The successful crewed flights validate key systems and compress expected certification timelines, increasing the company’s credibility with fleet operators and launch customers.
Sep 2025 – U.S. Federal Aviation Administration and Industry: The FAA launched a national eVTOL Integration Pilot Program in September, selecting multiple public-private partnerships and inviting participation from Joby, Archer, and other firms; early participants saw share-price uplifts of 2–5 percent on the announcement. The program enables limited commercial operations ahead of full certification, which shortens routes to revenue for mature OEMs and gives local authorities a playbook for vertiport siting and airspace management.