The Facial Injectables Market is valued at approximately USD 16.4 Billion in 2024 and is projected to reach nearly USD 52.8 Billion by 2034, expanding at an estimated CAGR of around 12.9% during 2025–2034. Rising adoption of minimally invasive aesthetic procedures, social-media–driven beauty trends, and the expansion of medical spas are accelerating global demand. Advancements in hyaluronic acid fillers, long-lasting neurotoxins, and collagen stimulators are reshaping treatment preferences worldwide. The next decade will mark a strong growth era as younger demographics and men increasingly enter the aesthetic treatment segment.
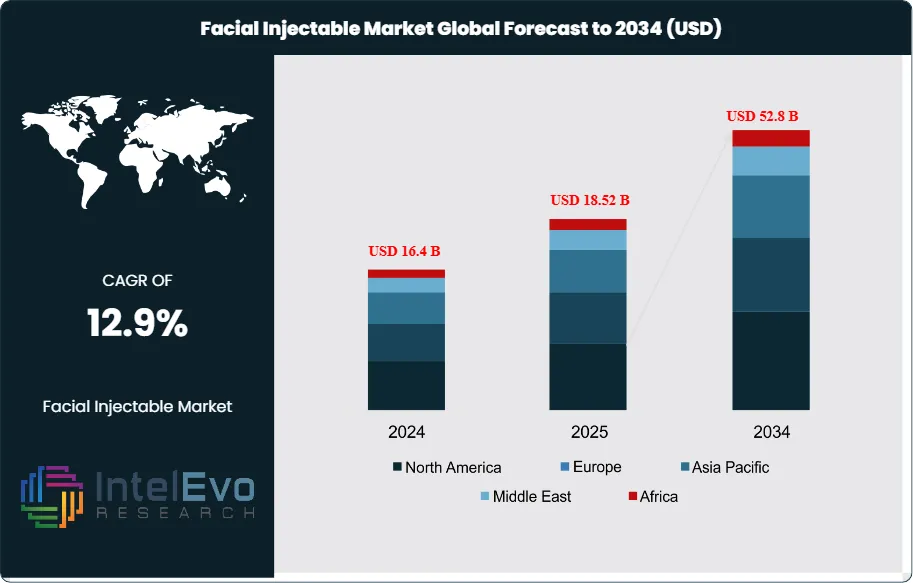
Market expansion has accelerated over the past five years as minimally invasive aesthetics gain mainstream acceptance and procedure accessibility improves. Non-surgical aesthetic interventions have roughly tripled since 2012, and pandemic-era telepresence catalyzed a sustained “Zoom Boom,” keeping procedure volumes in double-digit growth through the recovery period. Category mix remains favorable: botulinum toxin accounts for an estimated 45–50% of total procedure counts, while hyaluronic acid (HA) fillers represent about 60% of filler revenues; newer biostimulators (e.g., CaHA, PLLA) are the fastest-growing subsegment, expanding at 12–14% annually from a smaller base. Core applications span nasolabial folds, lips, periorbital lines, cheek contouring, and rejuvenation of acne- or age-related atrophy, with product innovation extending duration of effect from 6–18 months depending on indication and formulation.
Demand-side drivers include rising disposable incomes, social-media influence on beauty norms, and growing male participation (now ~15% of volumes), alongside consumer preference for quick, low-downtime treatments. On the supply side, advances in cross-linking chemistry, lidocaine-containing formulations, microcannula techniques, and longer-acting neuromodulators are lifting outcomes and patient satisfaction scores. Digitalization is reshaping the care pathway: AI-enabled facial analysis, 3D imaging for treatment planning, teleconsults, and practice-management automation are compressing consult-to-treatment cycles and improving clinic throughput by an estimated 10–15%. Key headwinds include adverse-event risk requiring skilled injectors, tightening regulatory scrutiny (e.g., EU MDR post-market surveillance), counterfeit and gray-market product circulation, and macro-sensitivity given the discretionary nature of spend. Pricing competition in fragmented med-spa channels also pressures margins, partly offset by premiumization and combination protocols (toxin + filler + biostimulator).
Regionally, North America leads with ~35% of global revenue on dense clinic networks and high spend per capita, while Western Europe contributes ~30% with strong adoption in the UK, Germany, and France. Asia-Pacific is the growth engine, projected at 13–15% CAGR, led by China and South Korea and underpinned by medical tourism in Thailand and Australia. Emerging hotspots include the GCC (UAE, Saudi Arabia), Brazil and Mexico in Latin America, and Tier-1/2 Indian metros. Investment opportunities are most compelling in premium HA portfolios, longer-duration toxins, biostimulators, AI-driven consultation tools, injector training ecosystems, and scaled clinic roll-ups with rigorous compliance and supply-chain controls.
Key Takeaways
Market Growth: The global Facial Injectables market was USD 16.4 Billion in 2024 and is projected to reach USD 52.8 Billion by 2034 (12.9% CAGR), propelled by mainstreaming of minimally invasive aesthetics, social-media/telepresence effects, and expanding med-spa capacity. High procedure repeatability (often 2–3 sessions per patient annually) underpins resilient, subscription-like revenue.
Product Type: Botulinum Toxin Type A led with 48.2% of 2024 revenue, supported by broad indications for dynamic lines and a 3–4-month retreatment cycle that drives adherence; category anchors include Allergan Aesthetics (Botox), Ipsen (Dysport), and Evolus (Jeuveau).
Application: Facial line correction represented 34.2% of revenue in 2024, reflecting strong demand for rapid, low-downtime correction of glabellar/periorbital lines and routine maintenance protocols that bundle toxin with HA fillers.
Driver: Non-surgical cosmetic procedures continue to outpace surgical options as consumers favor less downtime and reversibility; procedure volumes have roughly tripled since 2012, while awareness campaigns and financing options broaden access across age and gender cohorts.
Restraint: Safety and regulatory requirements elevate operating costs and slow product cycles—serious adverse events are rare (<0.1%) but training/insurance and post-market surveillance can lift clinic cost bases by ~5–10% and delay launches by multiple quarters, particularly under EU MDR.
Opportunity: Asia–Pacific is the growth engine, forecast to compound at ~13–15% through 2034 and potentially exceed USD 11–12 billion, led by China and South Korea and supported by medical tourism. Biostimulators (CaHA, PLLA) offer premium pricing and longer duration, expanding at an estimated 12–14% CAGR from a low base.
Trend: Longer-duration neuromodulators (e.g., Revance’s Daxxify) extend median effect toward ~6 months versus 3–4 months for legacy toxins, raising ASPs and improving patient satisfaction. Concurrently, AI-enabled facial analysis, 3D imaging, and automated practice management are lifting conversion and clinic throughput by ~10–15%.
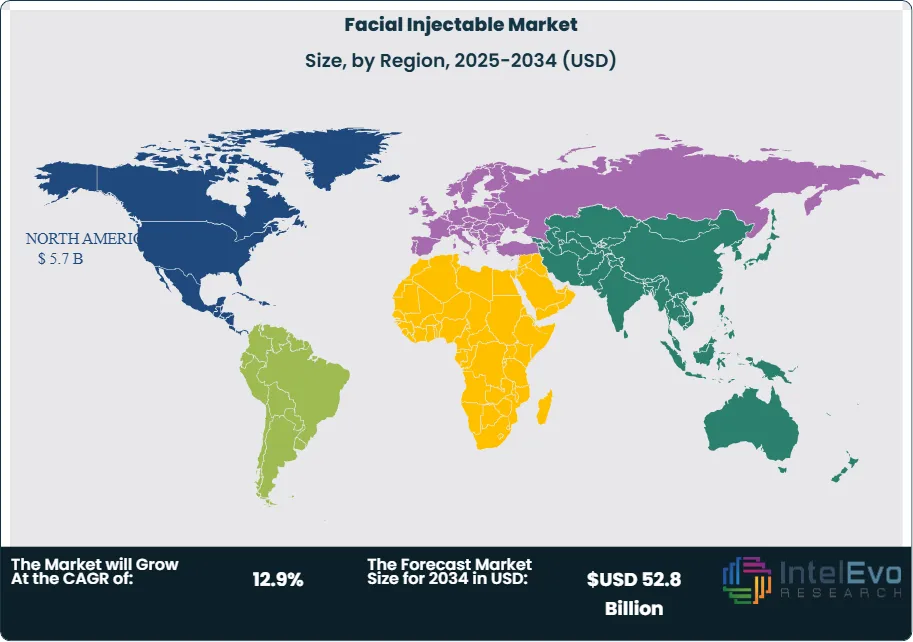
Regional Analysis: North America led in 2024 with 40.5% share (USD 5.7 billion), supported by high per-capita spend and dense injector networks; Western Europe remains sizable but slower-growing. Asia–Pacific is the fastest-growing region (low-teens CAGR), while the GCC and select Latin American markets emerge as investment hotspots on rising aesthetic tourism and expanding private clinics.
Product Analysis
Botulinum Toxin Type A remains the revenue anchor in 2025, sustaining the leadership position it held with 48.2% share in 2024. Its dominance is underwritten by broad indications for dynamic lines, predictable outcomes, and high retreatment frequency (typically every 3–4 months). Innovation is shifting the mix toward longer-acting formulations—such as six-month neuromodulators—which support premium pricing and higher lifetime value per patient as adherence improves post-pandemic.
Hyaluronic Acid (HA) continues to expand at a robust pace (often ~7–9% CAGR through 2034) given its safety profile, reversibility with hyaluronidase, and versatility across lip, mid-face, and periorbital indications. HA accounts for the majority of filler procedures and roughly ~60% of filler revenues in many mature markets, with newer, highly cross-linked gels offering improved longevity and rheology for contouring. Biostimulators—CaHA and PLLA—are accelerating from a smaller base, benefiting from demand for collagen neogenesis and 12–24-month durability; double-digit growth is common where practitioner training and patient education are strong. Collagen and PMMA microspheres remain niche for select cases requiring longer persistence, while “Other Products” (e.g., combination fillers with lidocaine) focus on patient comfort and injector efficiency.
Application Analysis
Facial line correction is the largest use case and retained the leading revenue share at 34.2% in 2024, a position it is expected to maintain through the late 2020s. Sustained demand stems from immediate, visible outcomes in glabellar, forehead, and periorbital lines, with combination protocols (toxin plus HA) lifting average spend per visit and lengthening maintenance cycles.
Beyond lines, lip augmentation and mid-face volumization are gaining as younger cohorts seek subtle enhancement and symmetry, while acne-scar revision and lipoatrophy treatment expand the market’s reconstructive adjacency. Adjunct “liquid facelift” approaches that blend neuromodulators, HA, and biostimulators are improving contour and skin quality, supported by 3D imaging and AI-guided treatment planning that sharpen dosing and improve reproducibility. Collectively, these applications diversify revenue and reduce reliance on a single indication, stabilizing clinic throughput.
End-Use Analysis
MedSpas constitute the most dynamic commercial channel in 2025, capturing an estimated near-half of procedure volumes in developed markets as retail locations scale membership models, financing, and targeted marketing. Standardized protocols, bundled packages, and extended hours drive higher utilization, while digital scheduling and CRM tools compress consult-to-treatment intervals.
Dermatology clinics remain critical for complex cases, adverse-event management, and technique leadership, typically commanding higher average selling prices due to specialist skill and premium product mixes. Hospitals account for a smaller share, focused on reconstructive indications and peri-operative aesthetics; however, they play a pivotal role in training, clinical trials, and compliance, particularly under stricter post-market surveillance regimes. Across settings, operating efficiency is improving via microcannula techniques, ultrasound-guided injections, and inventory controls that lower wastage and improve margins.
Regional Analysis
North America continues to set the revenue pace, representing 40.5% of global sales in 2024 (USD 5.7 billion) and benefiting in 2025 from high per-capita spend, dense injector networks, and rapid diffusion of longer-duration neuromodulators. Repeat utilization among the 35–64 cohort, strong loyalty programs, and aggressive direct-to-consumer campaigns sustain resilience even amid macro volatility.
Asia Pacific is the fastest-growing region into 2034, led by China and South Korea and supported by medical tourism hubs in Thailand and Australia; India is on track for the highest country-level CAGR as urban middle-class consumers expand. Europe remains sizable with steady adoption in the UK, Germany, and France, though regulatory stringency can lengthen launch timelines. Latin America (Brazil, Mexico) and the Middle East & Africa (UAE, Saudi Arabia) are emerging hotspots where clinic chains, aesthetic tourism, and rising disposable incomes are unlocking double-digit growth, positioning these regions to contribute a disproportionate share of incremental global demand over the forecast horizon.
Customization for segments, region/country-level will be provided. Moreover, additional customization can be done based on the requirements.
Pricing and Purchase Options
Avail customized purchase options to meet your exact research needs. We have three licenses to opt for: Single User License, Multi-User License (Up to 5 Users), Corporate Use License (Unlimited User and Printable PDF).
TABLE OF CONTENTS
1. EXECUTIVE SUMMARY
1.1. MARKET SNAPSHOT
1.2. KEY FINDINGS & INSIGHTS
1.3. ANALYST RECOMMENDATIONS
1.4. FUTURE OUTLOOK
2. RESEARCH METHODOLOGY
2.1. MARKET DEFINITION & SCOPE
2.2. RESEARCH OBJECTIVES: PRIMARY & SECONDARY DATA SOURCES
2.3. DATA COLLECTION SOURCES
2.3.1. COVERAGE OF 100+ PRIMARY RESEARCH/CONSULTATION CALLS WITH INDUSTRY STAKEHOLDERS
FIGURE 17 NORTH AMERICA FACIAL INJECTABLE SYSTEM CURRENT AND FUTURE TYPE ANALYSIS, 2025–2034, (USD MILLION)
FIGURE 18 NORTH AMERICA FACIAL INJECTABLE SYSTEM CURRENT AND FUTURE END USER ANALYSIS, 2025–2034, (USD MILLION)
FIGURE 19 MARKET SHARE BY COUNTRY
FIGURE 20 LATIN AMERICA FACIAL INJECTABLE SYSTEM CURRENT AND FUTURE TYPE ANALYSIS, 2025–2034, (USD MILLION)
FIGURE 21 LATIN AMERICA FACIAL INJECTABLE SYSTEM CURRENT AND FUTURE END USER ANALYSIS, 2025–2034, (USD MILLION)
FIGURE 22 MARKET SHARE BY COUNTRY
FIGURE 23 EASTERN EUROPE FACIAL INJECTABLE SYSTEM CURRENT AND FUTURE TYPE ANALYSIS, 2025–2034, (USD MILLION)
FIGURE 24 EASTERN EUROPE FACIAL INJECTABLE SYSTEM CURRENT AND FUTURE END USER ANALYSIS, 2025–2034, (USD MILLION)
FIGURE 25 MARKET SHARE BY COUNTRY
FIGURE 26 WESTERN EUROPE FACIAL INJECTABLE SYSTEM CURRENT AND FUTURE TYPE ANALYSIS, 2025–2034, (USD MILLION)
FIGURE 27 WESTERN EUROPE FACIAL INJECTABLE SYSTEM CURRENT AND FUTURE END USER ANALYSIS, 2025–2034, (USD MILLION)
FIGURE 28 MARKET SHARE BY COUNTRY
FIGURE 29 EAST ASIA AND PACIFIC FACIAL INJECTABLE SYSTEM CURRENT AND FUTURE TYPE ANALYSIS, 2025–2034, (USD MILLION)
FIGURE 30 EAST ASIA AND PACIFIC FACIAL INJECTABLE SYSTEM CURRENT AND FUTURE END USER ANALYSIS, 2025–2034, (USD MILLION)
FIGURE 31 MARKET SHARE BY COUNTRY
FIGURE 32 SEA AND SOUTH ASIA FACIAL INJECTABLE SYSTEM CURRENT AND FUTURE TYPE ANALYSIS, 2025–2034, (USD MILLION)
FIGURE 33 SEA AND SOUTH ASIA FACIAL INJECTABLE SYSTEM CURRENT AND FUTURE END USER ANALYSIS, 2025–2034, (USD MILLION)
FIGURE 34 MARKET SHARE BY COUNTRY
FIGURE 35 MIDDLE EAST AND AFRICA FACIAL INJECTABLE SYSTEM CURRENT AND FUTURE TYPE ANALYSIS, 2025–2034, (USD MILLION)
FIGURE 36 MIDDLE EAST AND AFRICA FACIAL INJECTABLE SYSTEM CURRENT AND FUTURE END USER ANALYSIS, 2025–2034, (USD MILLION)
FIGURE 37 NORTH AMERICA FACIAL INJECTABLE SYSTEM CURRENT AND FUTURE MARKET VOLUME SHARE REGIONAL ANALYSIS, 2025–2034, (USD MILLION)
FIGURE 38 U.S. FACIAL INJECTABLE SYSTEM CURRENT AND FUTURE TYPE ANALYSIS, 2025–2034, (USD MILLION)
FIGURE 39 U.S. FACIAL INJECTABLE SYSTEM CURRENT AND FUTURE END USER ANALYSIS, 2025–2034, (USD MILLION)
FIGURE 40 CANADA FACIAL INJECTABLE SYSTEM CURRENT AND FUTURE TYPE ANALYSIS, 2025–2034, (USD MILLION)
FIGURE 41 CANADA FACIAL INJECTABLE SYSTEM CURRENT AND FUTURE END USER ANALYSIS, 2025–2034, (USD MILLION)
FIGURE 42 LATIN AMERICA FACIAL INJECTABLE SYSTEM CURRENT AND FUTURE MARKET VOLUME SHARE REGIONAL ANALYSIS, 2025–2034, (USD MILLION)
FIGURE 43 MEXICO FACIAL INJECTABLE SYSTEM CURRENT AND FUTURE TYPE ANALYSIS, 2025–2034, (USD MILLION)
FIGURE 44 MEXICO FACIAL INJECTABLE SYSTEM CURRENT AND FUTURE END USER ANALYSIS, 2025–2034, (USD MILLION)
FIGURE 45 BRAZIL FACIAL INJECTABLE SYSTEM CURRENT AND FUTURE TYPE ANALYSIS, 2025–2034, (USD MILLION)
FIGURE 46 BRAZIL FACIAL INJECTABLE SYSTEM CURRENT AND FUTURE END USER ANALYSIS, 2025–2034, (USD MILLION)
FIGURE 47 ARGENTINA FACIAL INJECTABLE SYSTEM CURRENT AND FUTURE TYPE ANALYSIS, 2025–2034, (USD MILLION)
FIGURE 48 ARGENTINA FACIAL INJECTABLE SYSTEM CURRENT AND FUTURE END USER ANALYSIS, 2025–2034, (USD MILLION)
FIGURE 49 COLUMBIA FACIAL INJECTABLE SYSTEM CURRENT AND FUTURE TYPE ANALYSIS, 2025–2034, (USD MILLION)
FIGURE 50 COLUMBIA FACIAL INJECTABLE SYSTEM CURRENT AND FUTURE END USER ANALYSIS, 2025–2034, (USD MILLION)
FIGURE 51 REST OF LATIN AMERICA FACIAL INJECTABLE SYSTEM CURRENT AND FUTURE TYPE ANALYSIS, 2025–2034, (USD MILLION)
FIGURE 52 REST OF LATIN AMERICA FACIAL INJECTABLE SYSTEM CURRENT AND FUTURE END USER ANALYSIS, 2025–2034, (USD MILLION)
FIGURE 53 EASTERN EUROPE FACIAL INJECTABLE SYSTEM CURRENT AND FUTURE MARKET VOLUME SHARE REGIONAL ANALYSIS, 2025–2034, (USD MILLION)
FIGURE 54 POLAND FACIAL INJECTABLE SYSTEM CURRENT AND FUTURE TYPE ANALYSIS, 2025–2034, (USD MILLION)
FIGURE 55 POLAND FACIAL INJECTABLE SYSTEM CURRENT AND FUTURE END USER ANALYSIS, 2025–2034, (USD MILLION)
FIGURE 56 RUSSIA FACIAL INJECTABLE SYSTEM CURRENT AND FUTURE TYPE ANALYSIS, 2025–2034, (USD MILLION)
FIGURE 57 RUSSIA FACIAL INJECTABLE SYSTEM CURRENT AND FUTURE END USER ANALYSIS, 2025–2034, (USD MILLION)
FIGURE 58 CZECH REPUBLIC FACIAL INJECTABLE SYSTEM CURRENT AND FUTURE TYPE ANALYSIS, 2025–2034, (USD MILLION)
FIGURE 59 CZECH REPUBLIC FACIAL INJECTABLE SYSTEM CURRENT AND FUTURE END USER ANALYSIS, 2025–2034, (USD MILLION)
FIGURE 60 ROMANIA FACIAL INJECTABLE SYSTEM CURRENT AND FUTURE TYPE ANALYSIS, 2025–2034, (USD MILLION)
FIGURE 61 ROMANIA FACIAL INJECTABLE SYSTEM CURRENT AND FUTURE END USER ANALYSIS, 2025–2034, (USD MILLION)
FIGURE 62 REST OF EASTERN EUROPE FACIAL INJECTABLE SYSTEM CURRENT AND FUTURE TYPE ANALYSIS, 2025–2034, (USD MILLION)
FIGURE 63 REST OF EASTERN EUROPE FACIAL INJECTABLE SYSTEM CURRENT AND FUTURE END USER ANALYSIS, 2025–2034, (USD MILLION)
FIGURE 64 WESTERN EUROPE FACIAL INJECTABLE SYSTEM CURRENT AND FUTURE MARKET VOLUME SHARE REGIONAL ANALYSIS, 2025–2034, (USD MILLION)
FIGURE 65 GERMANY FACIAL INJECTABLE SYSTEM CURRENT AND FUTURE TYPE ANALYSIS, 2025–2034, (USD MILLION)
FIGURE 66 GERMANY FACIAL INJECTABLE SYSTEM CURRENT AND FUTURE END USER ANALYSIS, 2025–2034, (USD MILLION)
FIGURE 67 FRANCE FACIAL INJECTABLE SYSTEM CURRENT AND FUTURE TYPE ANALYSIS, 2025–2034, (USD MILLION)
FIGURE 68 FRANCE FACIAL INJECTABLE SYSTEM CURRENT AND FUTURE END USER ANALYSIS, 2025–2034, (USD MILLION)
FIGURE 69 UK FACIAL INJECTABLE SYSTEM CURRENT AND FUTURE TYPE ANALYSIS, 2025–2034, (USD MILLION)
FIGURE 70 UK FACIAL INJECTABLE SYSTEM CURRENT AND FUTURE END USER ANALYSIS, 2025–2034, (USD MILLION)
FIGURE 71 SPAIN FACIAL INJECTABLE SYSTEM CURRENT AND FUTURE TYPE ANALYSIS, 2025–2034, (USD MILLION)
FIGURE 72 SPAIN FACIAL INJECTABLE SYSTEM CURRENT AND FUTURE END USER ANALYSIS, 2025–2034, (USD MILLION)
FIGURE 73 ITALY FACIAL INJECTABLE SYSTEM CURRENT AND FUTURE TYPE ANALYSIS, 2025–2034, (USD MILLION)
FIGURE 74 ITALY FACIAL INJECTABLE SYSTEM CURRENT AND FUTURE END USER ANALYSIS, 2025–2034, (USD MILLION)
FIGURE 75 REST OF WESTERN EUROPE FACIAL INJECTABLE SYSTEM CURRENT AND FUTURE TYPE ANALYSIS, 2025–2034, (USD MILLION)
FIGURE 76 REST OF WESTERN EUROPE FACIAL INJECTABLE SYSTEM CURRENT AND FUTURE END USER ANALYSIS, 2025–2034, (USD MILLION)
FIGURE 77 EAST ASIA AND PACIFIC FACIAL INJECTABLE SYSTEM CURRENT AND FUTURE MARKET VOLUME SHARE REGIONAL ANALYSIS, 2025–2034, (USD MILLION)
FIGURE 78 CHINA FACIAL INJECTABLE SYSTEM CURRENT AND FUTURE TYPE ANALYSIS, 2025–2034, (USD MILLION)
FIGURE 79 CHINA FACIAL INJECTABLE SYSTEM CURRENT AND FUTURE END USER ANALYSIS, 2025–2034, (USD MILLION)
FIGURE 80 JAPAN FACIAL INJECTABLE SYSTEM CURRENT AND FUTURE TYPE ANALYSIS, 2025–2034, (USD MILLION)
FIGURE 81 JAPAN FACIAL INJECTABLE SYSTEM CURRENT AND FUTURE END USER ANALYSIS, 2025–2034, (USD MILLION)
FIGURE 82 AUSTRALIA FACIAL INJECTABLE SYSTEM CURRENT AND FUTURE TYPE ANALYSIS, 2025–2034, (USD MILLION)
FIGURE 83 AUSTRALIA FACIAL INJECTABLE SYSTEM CURRENT AND FUTURE END USER ANALYSIS, 2025–2034, (USD MILLION)
FIGURE 84 CAMBODIA FACIAL INJECTABLE SYSTEM CURRENT AND FUTURE TYPE ANALYSIS, 2025–2034, (USD MILLION)
FIGURE 85 CAMBODIA FACIAL INJECTABLE SYSTEM CURRENT AND FUTURE END USER ANALYSIS, 2025–2034, (USD MILLION)
FIGURE 86 FIJI FACIAL INJECTABLE SYSTEM CURRENT AND FUTURE TYPE ANALYSIS, 2025–2034, (USD MILLION)
FIGURE 87 FIJI FACIAL INJECTABLE SYSTEM CURRENT AND FUTURE END USER ANALYSIS, 2025–2034, (USD MILLION)
FIGURE 88 INDONESIA FACIAL INJECTABLE SYSTEM CURRENT AND FUTURE TYPE ANALYSIS, 2025–2034, (USD MILLION)
FIGURE 89 INDONESIA FACIAL INJECTABLE SYSTEM CURRENT AND FUTURE END USER ANALYSIS, 2025–2034, (USD MILLION)
FIGURE 90 SOUTH KOREA FACIAL INJECTABLE SYSTEM CURRENT AND FUTURE TYPE ANALYSIS, 2025–2034, (USD MILLION)
FIGURE 91 SOUTH KOREA FACIAL INJECTABLE SYSTEM CURRENT AND FUTURE END USER ANALYSIS, 2025–2034, (USD MILLION)
FIGURE 92 REST OF EAST ASIA AND PACIFIC FACIAL INJECTABLE SYSTEM CURRENT AND FUTURE TYPE ANALYSIS, 2025–2034, (USD MILLION)
FIGURE 93 REST OF EAST ASIA AND PACIFIC FACIAL INJECTABLE SYSTEM CURRENT AND FUTURE END USER ANALYSIS, 2025–2034, (USD MILLION)
FIGURE 94 SEA AND SOUTH ASIA FACIAL INJECTABLE SYSTEM CURRENT AND FUTURE MARKET VOLUME SHARE REGIONAL ANALYSIS, 2025–2034, (USD MILLION)
FIGURE 95 BANGLADESH FACIAL INJECTABLE SYSTEM CURRENT AND FUTURE TYPE ANALYSIS, 2025–2034, (USD MILLION)
FIGURE 96 BANGLADESH FACIAL INJECTABLE SYSTEM CURRENT AND FUTURE END USER ANALYSIS, 2025–2034, (USD MILLION)
FIGURE 97 NEW ZEALAND FACIAL INJECTABLE SYSTEM CURRENT AND FUTURE TYPE ANALYSIS, 2025–2034, (USD MILLION)
FIGURE 98 NEW ZEALAND FACIAL INJECTABLE SYSTEM CURRENT AND FUTURE END USER ANALYSIS, 2025–2034, (USD MILLION)
FIGURE 99 INDIA FACIAL INJECTABLE SYSTEM CURRENT AND FUTURE TYPE ANALYSIS, 2025–2034, (USD MILLION)
FIGURE 100 INDIA FACIAL INJECTABLE SYSTEM CURRENT AND FUTURE END USER ANALYSIS, 2025–2034, (USD MILLION)
FIGURE 101 SINGAPORE FACIAL INJECTABLE SYSTEM CURRENT AND FUTURE TYPE ANALYSIS, 2025–2034, (USD MILLION)
FIGURE 102 SINGAPORE FACIAL INJECTABLE SYSTEM CURRENT AND FUTURE END USER ANALYSIS, 2025–2034, (USD MILLION)
FIGURE 103 THAILAND FACIAL INJECTABLE SYSTEM CURRENT AND FUTURE TYPE ANALYSIS, 2025–2034, (USD MILLION)
FIGURE 104 THAILAND FACIAL INJECTABLE SYSTEM CURRENT AND FUTURE END USER ANALYSIS, 2025–2034, (USD MILLION)
FIGURE 105 TAIWAN FACIAL INJECTABLE SYSTEM CURRENT AND FUTURE TYPE ANALYSIS, 2025–2034, (USD MILLION)
FIGURE 106 TAIWAN FACIAL INJECTABLE SYSTEM CURRENT AND FUTURE END USER ANALYSIS, 2025–2034, (USD MILLION)
FIGURE 107 MALAYSIA FACIAL INJECTABLE SYSTEM CURRENT AND FUTURE TYPE ANALYSIS, 2025–2034, (USD MILLION)
FIGURE 108 MALAYSIA FACIAL INJECTABLE SYSTEM CURRENT AND FUTURE END USER ANALYSIS, 2025–2034, (USD MILLION)
FIGURE 109 REST OF SEA AND SOUTH ASIA FACIAL INJECTABLE SYSTEM CURRENT AND FUTURE TYPE ANALYSIS, 2025–2034, (USD MILLION)
FIGURE 110 REST OF SEA AND SOUTH ASIA FACIAL INJECTABLE SYSTEM CURRENT AND FUTURE END USER ANALYSIS, 2025–2034, (USD MILLION)
FIGURE 111 MIDDLE EAST AND AFRICA FACIAL INJECTABLE SYSTEM CURRENT AND FUTURE MARKET VOLUME SHARE REGIONAL ANALYSIS, 2025–2034, (USD MILLION)
FIGURE 112 GCC COUNTRIES FACIAL INJECTABLE SYSTEM CURRENT AND FUTURE TYPE ANALYSIS, 2025–2034, (USD MILLION)
FIGURE 113 GCC COUNTRIES FACIAL INJECTABLE SYSTEM CURRENT AND FUTURE END USER ANALYSIS, 2025–2034, (USD MILLION)
FIGURE 114 SAUDI ARABIA FACIAL INJECTABLE SYSTEM CURRENT AND FUTURE TYPE ANALYSIS, 2025–2034, (USD MILLION)
FIGURE 115 SAUDI ARABIA FACIAL INJECTABLE SYSTEM CURRENT AND FUTURE END USER ANALYSIS, 2025–2034, (USD MILLION)
FIGURE 116 UAE FACIAL INJECTABLE SYSTEM CURRENT AND FUTURE TYPE ANALYSIS, 2025–2034, (USD MILLION)
FIGURE 117 UAE FACIAL INJECTABLE SYSTEM CURRENT AND FUTURE END USER ANALYSIS, 2025–2034, (USD MILLION)
FIGURE 118 BAHRAIN FACIAL INJECTABLE SYSTEM CURRENT AND FUTURE TYPE ANALYSIS, 2025–2034, (USD MILLION)
FIGURE 119 BAHRAIN FACIAL INJECTABLE SYSTEM CURRENT AND FUTURE END USER ANALYSIS, 2025–2034, (USD MILLION)
FIGURE 120 KUWAIT FACIAL INJECTABLE SYSTEM CURRENT AND FUTURE TYPE ANALYSIS, 2025–2034, (USD MILLION)
FIGURE 121 KUWAIT FACIAL INJECTABLE SYSTEM CURRENT AND FUTURE END USER ANALYSIS, 2025–2034, (USD MILLION)
FIGURE 122 OMAN FACIAL INJECTABLE SYSTEM CURRENT AND FUTURE TYPE ANALYSIS, 2025–2034, (USD MILLION)
FIGURE 123 OMAN FACIAL INJECTABLE SYSTEM CURRENT AND FUTURE END USER ANALYSIS, 2025–2034, (USD MILLION)
FIGURE 124 QATAR FACIAL INJECTABLE SYSTEM CURRENT AND FUTURE TYPE ANALYSIS, 2025–2034, (USD MILLION)
FIGURE 125 QATAR FACIAL INJECTABLE SYSTEM CURRENT AND FUTURE END USER ANALYSIS, 2025–2034, (USD MILLION)
FIGURE 126 EGYPT FACIAL INJECTABLE SYSTEM CURRENT AND FUTURE TYPE ANALYSIS, 2025–2034, (USD MILLION)
FIGURE 127 EGYPT FACIAL INJECTABLE SYSTEM CURRENT AND FUTURE END USER ANALYSIS, 2025–2034, (USD MILLION)
FIGURE 128 NIGERIA FACIAL INJECTABLE SYSTEM CURRENT AND FUTURE TYPE ANALYSIS, 2025–2034, (USD MILLION)
FIGURE 129 NIGERIA FACIAL INJECTABLE SYSTEM CURRENT AND FUTURE END USER ANALYSIS, 2025–2034, (USD MILLION)
FIGURE 130 SOUTH AFRICA FACIAL INJECTABLE SYSTEM CURRENT AND FUTURE TYPE ANALYSIS, 2025–2034, (USD MILLION)
FIGURE 131 SOUTH AFRICA FACIAL INJECTABLE SYSTEM CURRENT AND FUTURE END USER ANALYSIS, 2025–2034, (USD MILLION)
FIGURE 132 ISRAEL FACIAL INJECTABLE SYSTEM CURRENT AND FUTURE TYPE ANALYSIS, 2025–2034, (USD MILLION)
FIGURE 133 ISRAEL FACIAL INJECTABLE SYSTEM CURRENT AND FUTURE END USER ANALYSIS, 2025–2034, (USD MILLION)
FIGURE 134 REST OF MEA FACIAL INJECTABLE SYSTEM CURRENT AND FUTURE TYPE ANALYSIS, 2025–2034, (USD MILLION)
FIGURE 135 REST OF MEA FACIAL INJECTABLE SYSTEM CURRENT AND FUTURE END USER ANALYSIS, 2025–2034, (USD MILLION)
FIGURE 136 U. S. MARKET SHARE ANALYSIS BY TYPE (2024)
FIGURE 137 U. S. MARKET SHARE ANALYSIS BY END USER (2024)
FIGURE 138 CANADA MARKET SHARE ANALYSIS BY TYPE (2024)
FIGURE 139 CANADA MARKET SHARE ANALYSIS BY END USER (2024)
FIGURE 140 MEXICO MARKET SHARE ANALYSIS BY TYPE (2024)
FIGURE 141 MEXICO MARKET SHARE ANALYSIS BY END USER (2024)
FIGURE 142 CHINA MARKET SHARE ANALYSIS BY TYPE (2024)
FIGURE 143 CHINA MARKET SHARE ANALYSIS BY END USER (2024)
FIGURE 144 JAPAN MARKET SHARE ANALYSIS BY TYPE (2024)
FIGURE 145 JAPAN MARKET SHARE ANALYSIS BY END USER (2024)
FIGURE 146 INDIA MARKET SHARE ANALYSIS BY TYPE (2024)
FIGURE 147 INDIA MARKET SHARE ANALYSIS BY END USER (2024)
FIGURE 148 SOUTH KOREA MARKET SHARE ANALYSIS BY TYPE (2024)
FIGURE 149 SOUTH KOREA MARKET SHARE ANALYSIS BY END USER (2024)
FIGURE 150 SAUDI ARABIA MARKET SHARE ANALYSIS BY TYPE (2024)
FIGURE 151 SAUDI ARABIA MARKET SHARE ANALYSIS BY END USER (2024)
FIGURE 152 UAE MARKET SHARE ANALYSIS BY TYPE (2024)
FIGURE 153 UAE MARKET SHARE ANALYSIS BY END USER (2024)
FIGURE 154 EGYPT MARKET SHARE ANALYSIS BY TYPE (2024)
FIGURE 155 EGYPT MARKET SHARE ANALYSIS BY END USER (2024)
FIGURE 156 NIGERIA MARKET SHARE ANALYSIS BY TYPE (2024)
FIGURE 157 NIGERIA MARKET SHARE ANALYSIS BY END USER (2024)
FIGURE 158 SOUTH AFRICA MARKET SHARE ANALYSIS BY TYPE (2024)
FIGURE 159 SOUTH AFRICA MARKET SHARE ANALYSIS BY END USER (2024)
FIGURE 160 GERMANY MARKET SHARE ANALYSIS BY TYPE (2024)
FIGURE 161 GERMANY MARKET SHARE ANALYSIS BY END USER (2024)
FIGURE 162 FRANCE MARKET SHARE ANALYSIS BY TYPE (2024)
FIGURE 163 FRANCE MARKET SHARE ANALYSIS BY END USER (2024)
FIGURE 164 UK MARKET SHARE ANALYSIS BY TYPE (2024)
FIGURE 165 UK MARKET SHARE ANALYSIS BY END USER (2024)
FIGURE 166 SPAIN MARKET SHARE ANALYSIS BY TYPE (2024)
FIGURE 167 SPAIN MARKET SHARE ANALYSIS BY END USER (2024)
FIGURE 168 ITALY MARKET SHARE ANALYSIS BY TYPE (2024)
FIGURE 169 ITALY MARKET SHARE ANALYSIS BY END USER (2024)
FIGURE 170 BRAZIL MARKET SHARE ANALYSIS BY TYPE (2024)
FIGURE 171 BRAZIL MARKET SHARE ANALYSIS BY END USER (2024)
FIGURE 172 ARGENTINA MARKET SHARE ANALYSIS BY TYPE (2024)
FIGURE 173 ARGENTINA MARKET SHARE ANALYSIS BY END USER (2024)
FIGURE 174 COLUMBIA MARKET SHARE ANALYSIS BY TYPE (2024)
FIGURE 175 COLUMBIA MARKET SHARE ANALYSIS BY END USER (2024)
FIGURE 176 GLOBAL FACIAL INJECTABLE SYSTEM CURRENT AND FUTURE MARKET KEY COUNTRY LEVEL ANALYSIS, 2024–2034, (USD MILLION)
FIGURE 177 FINANCIAL OVERVIEW:
Key Player Analysis
Ipsen: Ipsen positions itself as a leading player in the global facial injectable market, with a strong footprint in botulinum toxin therapies. Its flagship product, Dysport, has gained significant adoption in both therapeutic and aesthetic indications, accounting for a notable share of the neuromodulator segment. In 2025, Ipsen continues to invest in expanding its aesthetic medicine portfolio, leveraging R&D to enhance toxin formulations with longer-lasting effects and improved patient outcomes. Strategic partnerships with dermatology clinics and distribution networks in Europe and North America further reinforce its market leadership. Ipsen’s differentiator lies in its dual-market presence—balancing therapeutic and cosmetic applications—enabling consistent revenue diversification and competitive resilience.
Merz Pharma: Merz Pharma is positioned as a challenger and innovator, focusing on a diversified injectable portfolio that includes Belotero (HA fillers), Radiesse (CaHA filler), and Xeomin (botulinum toxin). The company has steadily built market share across Europe and the United States, with a growing presence in Asia-Pacific. Merz’s competitive edge stems from its emphasis on natural-looking outcomes and biostimulatory fillers, particularly Radiesse, which appeals to patients seeking collagen regeneration and long-term results. In 2025, Merz has prioritized digital engagement and AI-enabled treatment planning tools to enhance practitioner adoption and patient satisfaction. Continuous investments in physician training programs also strengthen brand loyalty and clinical outcomes, positioning Merz as a credible alternative to market leaders.
Suneva Medical, Inc.: Suneva Medical operates as a niche player with a specialization in regenerative aesthetics. Its core product, Bellafill, is a long-lasting dermal filler that combines collagen with PMMA microspheres, offering results that extend up to five years—substantially longer than most HA-based fillers. This unique positioning appeals to patients seeking durable outcomes, although it limits Suneva’s addressable market compared to more reversible fillers. In recent years, the company has pursued growth through distribution agreements in North America and select international markets, while emphasizing physician education on safety and efficacy. In 2025, Suneva’s differentiation rests on longevity and regenerative science, aligning with the rising trend of biostimulatory injectables and collagen-inducing therapies.
Medytox Inc.: Medytox is an emerging innovator in the facial injectables market, with a strong emphasis on R&D in botulinum toxin and filler technologies. Based in South Korea, the company has benefited from Asia-Pacific’s rapid growth trajectory, particularly in the medical aesthetics hubs of South Korea and China. Medytox’s strategic collaborations—most notably with Allergan and Evolus—have accelerated global commercialization of its botulinum toxin pipeline. In 2025, the company is advancing novel toxin formulations with extended duration and fewer retreatments, directly addressing consumer demand for convenience and cost efficiency. Medytox differentiates itself through its biotech-driven approach and consistent investment in next-generation injectables, positioning it as a disruptor in an increasingly competitive market landscape.
Key Market Players
Allergan Aesthetics (AbbVie Inc.)
Galderma S.A.
Merz Pharmaceuticals GmbH
Revance Therapeutics, Inc.
Ipsen Pharma
Sinclair Pharma
Prollenium Medical Technologies Inc.
Suneva Medical, Inc.
Teoxane Laboratories
HUONS Co., Ltd.
Medytox Inc.
Bloomage BioTechnology
Laboratoires Vivacy
BioPlus Co., Ltd.
Croma-Pharma GmbH
Driver:
Rising Demand for Minimally Invasive Aesthetic Treatments
As of 2025, the primary growth catalyst for the facial injectables market is the surging demand for minimally invasive aesthetic solutions. Consumers increasingly favor treatments that deliver visible results with reduced downtime and lower risk compared to surgical alternatives. Botulinum toxin, hyaluronic acid (HA) fillers, and collagen stimulators are at the forefront, supported by rising procedure volumes among both younger demographics seeking preventive care and older populations seeking rejuvenation. Advances in formulation technology—such as longer-acting neuromodulators and next-generation cross-linked HA gels—are enhancing safety, efficacy, and treatment durability, further strengthening adoption. The market’s expansion is also reinforced by growing male participation, now representing nearly 15% of procedure demand globally, underscoring a widening consumer base and steady revenue streams for providers.
Restraint:
High Costs, Regulatory Delays, and Skilled-Practitioner Gaps
Despite double-digit growth potential, affordability and access remain significant constraints. A single injectable session can cost anywhere from USD 400 to USD 2,000 depending on geography and product, which limits penetration in lower-income segments. In addition, stringent regulatory oversight—especially in the U.S. and Europe—delays product approvals and inflates compliance costs, extending go-to-market timelines by 12–24 months in some cases. Clinical risks, though rare, also pose reputational threats: complications such as vascular occlusion or persistent swelling account for <1% of procedures but generate outsized consumer concern. The need for highly skilled practitioners is another bottleneck, with uneven training standards across markets often restricting safe scale-up in high-growth regions.
Opportunity:
Accelerating Adoption Across Emerging Global Markets
Emerging markets present the most attractive investment horizon. Asia Pacific alone is forecast to grow at 13–15% CAGR through 2034, with China, India, and South Korea leading due to expanding middle-class populations, rising disposable income, and increasing cultural acceptance of aesthetic enhancements. Latin America and the Middle East are also expanding rapidly, driven by medical tourism hubs in Brazil, Mexico, and the UAE. On the product side, biostimulators such as Poly-L-Lactic Acid (PLLA) and Calcium Hydroxylapatite (CaHA) offer significant upside, projected to capture a larger share as demand shifts toward natural collagen regeneration and treatments with longer durability (12–24 months). Companies that successfully integrate affordability strategies, tailored training programs, and region-specific marketing stand to capture substantial incremental revenue in these untapped geographies.
Trend:
Multimodal Treatments and AI-Enabled Aesthetic Personalization
A defining trend in 2025 is the rapid adoption of multimodal and combination treatments. Patients are increasingly opting for tailored protocols that blend neuromodulators with HA fillers and biostimulators, resulting in more natural, longer-lasting outcomes. This shift has elevated average procedure spend by 20–30% per patient in mature markets. At the same time, digital technologies are reshaping treatment pathways: AI-enabled facial mapping and 3D imaging are streamlining consultation processes, while augmented reality tools enhance patient education and satisfaction. The proliferation of social media and influencer-driven marketing continues to normalize aesthetic procedures, with platforms like Instagram and TikTok fueling awareness among younger demographics. Collectively, these trends signal a pivot toward personalized, tech-enabled, and lifestyle-integrated aesthetics, reshaping competitive dynamics in favor of companies with broad portfolios and digital engagement strategies.
Recent Developments
Dec 2024 – Crown Laboratories (Revance acquisition): Crown Laboratories amended its agreement and commenced a cash tender offer to acquire Revance Therapeutics at USD 3.10 per share, a reduction from the earlier USD 6.66 per-share proposal, with closing targeted for Q1 2025.
Feb 2025 – Crown Laboratories: Crown completed the acquisition of Revance, with Revance shares halted and subsequently suspended from trading as the deal closed on February 6, 2025.
Apr 2025 – Galderma: Galderma launched Sculptra® in China, expanding access to a collagen-stimulating biostimulator in one of the world’s fastest-growing aesthetics markets; the move followed a record Q1 2025 net sales of USD 1.129 billion, underscoring strong execution into the launch wave.
Jul 2025 – Ipsen: Ipsen upgraded full-year guidance on the back of solid H1 performance and advanced its long-acting neurotoxin program; a Phase II study for IPN10200 initiated in June 2025 as part of a global plan spanning therapeutic and aesthetic indications.
Sep 2025 – Allergan Aesthetics (AbbVie): Allergan unveiled “The One & Only” multichannel campaign for BOTOX® Cosmetic, aimed at reinforcing category leadership and broadening consumer engagement ahead of peak holiday demand.