Facility Management Market Size | Growth Outlook & 11.2% CAGR
Global Facility Management Market Size, Share & Analysis By Type (Outsourced, In-house), By Service (Hard Service, Soft Service, Management Service), By Application (Education, Commercial, Transportation, Industrial, Government & Public, Healthcare, Retail, Others), By Deployment Industry Outlook, Smart Building Trends & Forecast 2025–2034
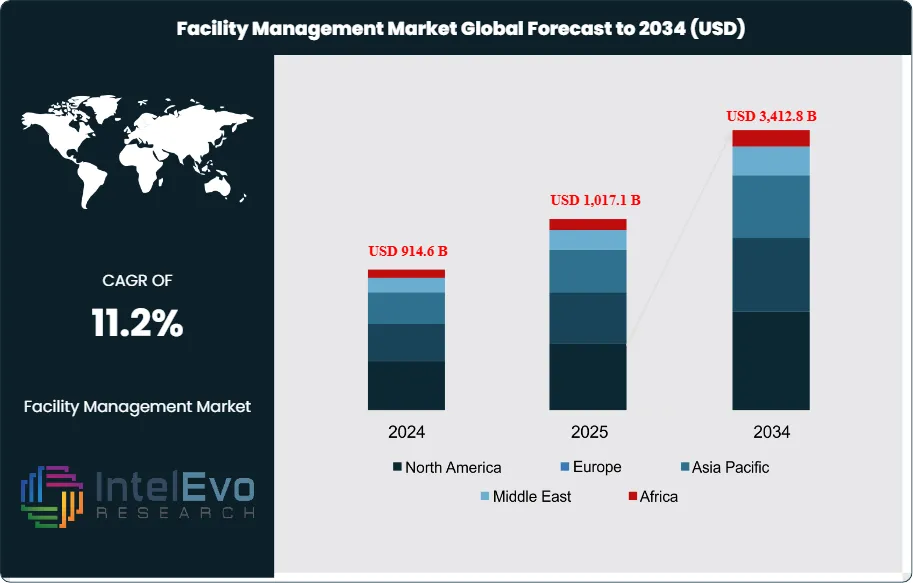
The Facility Management Market is valued at approximately USD 914.6 billion in 2024 and is projected to reach nearly USD 3,412.8 billion by 2034, expanding at a strong CAGR of about 11.2% from 2025–2034. Growth is being driven by rapid urbanization, digital building modernization, and rising demand for integrated services across commercial, industrial, and public infrastructure. As organizations prioritize energy efficiency, ESG compliance, and smart-building automation, FM solutions enabled by IoT, AI-driven maintenance, and real-time asset monitoring are gaining fast adoption. With global enterprises shifting toward outsourced facility operations and predictive management models, the sector continues trending across real estate, infrastructure, and workplace-transformation platforms.
This strong upward trajectory underscores the market’s critical role in enabling operational efficiency, sustainability, and value creation across both public and private infrastructure ecosystems.
Historically, the facility management sector has evolved from basic maintenance and custodial services into a strategic function that integrates property strategy, space planning, compliance, energy management, and digital transformation. Asia-Pacific led the global market in 2023, commanding over 32.6% of total revenue with an estimated USD 211.5 billion, driven by rapid urbanization, infrastructure expansion, and increasing demand for integrated facility solutions across commercial and industrial spaces.
Key growth drivers include a heightened corporate focus on cost optimization and sustainability, prompting organizations to adopt facility management services that reduce energy usage, ensure regulatory compliance, and enhance occupant well-being. Technological innovation is a transformative force in the sector, with smart building systems, IoT integration, and AI-powered analytics streamlining operations and enabling predictive maintenance. For instance, smart sensors are reported to reduce energy costs by up to 20%, while data analytics tools can boost workforce productivity by a similar margin.
Despite significant growth prospects, challenges persist. These include rising labor costs, uneven technology adoption, and underutilization of facility management software—80% of users reportedly fail to leverage their platforms’ full capabilities. Moreover, 44.1% of managers cite work order tracking as time-consuming, pointing to the need for more automated, user-friendly systems.
Investor interest is rising, particularly in digital-first service providers and emerging markets where industrial growth and urban sprawl fuel demand. The recent debt funding secured by SmartCheck in April 2024 underscores the sector’s investment potential, particularly in AI-driven SaaS solutions. Regionally, Asia-Pacific remains a high-growth hotspot, while North America and Europe continue advancing in technology integration and sustainability metrics.
Looking forward, automation, augmented reality, and cloud-based platforms are expected to redefine service delivery, with 27.4% of facility managers aiming to automate repetitive tasks and 26% of manufacturing sites already leveraging AR tools. As facility management becomes increasingly data-centric, the sector is poised for a transformative decade marked by digital efficiency and scalable service models.
Key Takeaways
Market Growth: The global Facility Management Control System (FMCS) market is projected to expand from USD 914.6 billion in 2024 to USD 3,412.8 billion by 2034, registering a robust CAGR of 11.2%. Growth is fueled by increasing demand for operational efficiency, sustainability mandates, and the integration of smart technologies in building management.
Service Delivery Model: The Outsourced segment accounted for over 70% of total market share in 2023, driven by the need for cost optimization and access to specialized expertise across large-scale commercial and industrial facilities.
Service Type: Hard Services, which include HVAC, electrical, and plumbing systems, led the FMCS market in 2023 with more than 40% market share, owing to the critical role these systems play in infrastructure functionality and compliance.
End Use Industry: The Commercial sector emerged as the dominant end user, capturing over 32% of global revenue in 2023. Growth in commercial real estate, particularly in urban centers, and increasing reliance on smart building systems contributed to this leadership.
Driver: The shift toward smart and sustainable buildings is accelerating FMCS adoption. Smart sensors and automated control systems can reduce energy costs by up to 20%, while improving operational productivity by a similar margin, according to recent industry data.
Restraint: Despite the growth potential, technology underutilization remains a key barrier. Approximately 80% of users do not fully leverage the capabilities of their facility management software, limiting ROI and operational efficiency gains.
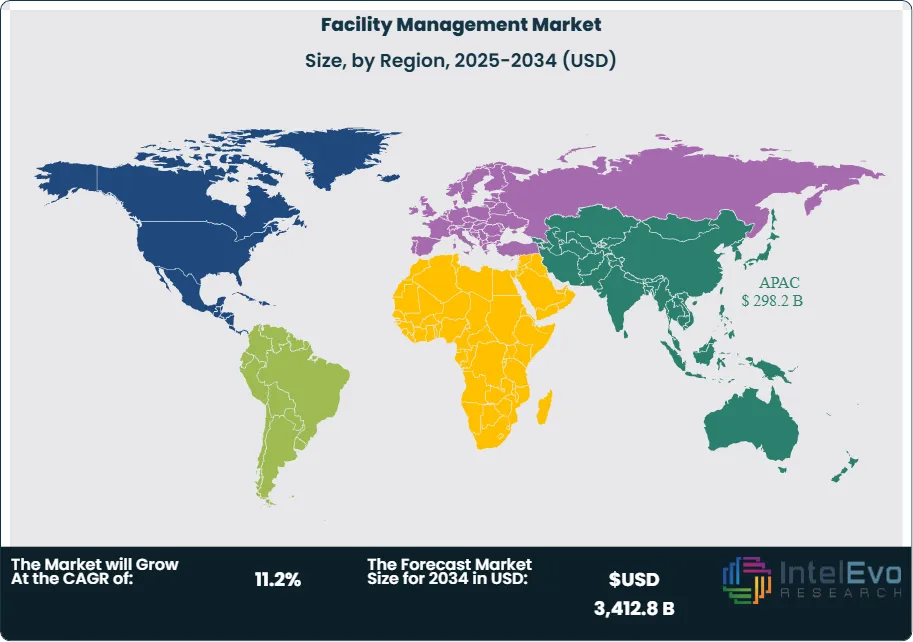
Opportunity: Emerging economies in Asia-Pacific, Latin America, and the Middle East offer high-growth potential, with urbanization, industrial development, and infrastructure investment creating demand for advanced FMCS. The Asia-Pacific region alone generated USD 211.5 billion in revenue in 2023, leading the global market.
Trend: There is a rapid uptick in the integration of AI, IoT, and augmented reality into FMCS platforms. As of 2024, 26% of manufacturing facilities have implemented AR tools, while 27.4% of managers are leveraging automation for repetitive task management, highlighting the sector’s digital transformation.
Regional Analysis: Asia-Pacific led the market in 2023 with a 32.6% global share, followed by North America and Europe, where technology adoption and sustainability compliance are driving FMCS demand. Emerging regions like the Middle East and Africa are also poised for double-digit CAGR growth through 2033.
Type Analysis
As of 2025, the outsourced segment continues to dominate the global facility management market, accounting for over 70% of total market share. This strong preference for outsourcing is driven by organizations’ growing need to streamline operations and concentrate on core competencies. By delegating non-core functions such as maintenance, cleaning, and building operations to specialized service providers, businesses can reduce overhead and enhance strategic focus. This model has proven particularly attractive in complex environments like healthcare, commercial real estate, and education, where operational continuity and compliance are critical.
Cost-efficiency remains a central factor fueling this segment’s dominance. Outsourcing eliminates the need for capital investment in hiring, training, and maintaining in-house teams, while also enabling access to advanced technologies and best-in-class expertise. Service providers are increasingly deploying IoT-enabled devices, AI-driven diagnostics, and smart building systems to deliver predictive maintenance and data-backed performance management. This tech-driven evolution is prompting further outsourcing adoption, especially in regions undergoing digital transformation. In contrast, the in-house segment remains relevant in highly regulated industries, but its share is expected to decline steadily as outsourced models prove more scalable and agile.
Service Analysis
Hard services continue to lead the facility management market in 2025, maintaining a market share of over 40%. These services, encompassing HVAC systems, electrical infrastructure, plumbing, elevators, and structural maintenance, are indispensable for building safety, operational uptime, and regulatory compliance. The growing complexity of modern infrastructure—driven by increased building automation, energy codes, and smart system integration—necessitates expert intervention for installation, upkeep, and periodic upgrades.
Energy efficiency mandates and building performance regulations are further intensifying the demand for hard services. Many commercial and industrial buildings are undergoing retrofitting with energy-efficient HVAC and lighting systems, not only to comply with environmental standards but also to reduce long-term operational costs. Meanwhile, management services—such as asset tracking and facility performance analytics—are gaining traction due to their ability to optimize resource allocation. Soft services like janitorial work and landscaping remain essential but are increasingly bundled within integrated contracts to improve coordination and reduce administrative overhead.
Application Analysis
In 2025, the commercial sector continues to hold the largest share of the facility management market, with over 32% of global revenue. This leadership is attributed to the expanding footprint of office complexes, business parks, retail outlets, and hospitality establishments worldwide. As businesses compete on efficiency, customer experience, and sustainability, facility management has become integral to maintaining high operational standards. Complex needs in this sector—ranging from cleaning and HVAC to workspace optimization—drive the adoption of bundled service models and real-time management systems.
Technology is a pivotal enabler within this segment. The commercial application of IoT sensors, automation platforms, and AI-powered analytics enables real-time asset monitoring, energy optimization, and predictive maintenance. This not only enhances tenant satisfaction but also contributes to long-term cost savings and environmental targets. The healthcare and education segments are also witnessing rising demand for specialized FM services, driven by hygiene protocols, energy efficiency targets, and safety compliance.
By End-Use Analysis
Among end-use categories, commercial buildings represent the most significant demand center for facility management services in 2025. With sustained growth in commercial real estate—especially in urban corridors across Asia-Pacific and North America—this segment has become a key revenue generator. Commercial tenants and building owners alike are placing increasing importance on seamless facility operations to support workforce productivity, occupant comfort, and regulatory compliance.
The industrial segment is also emerging as a high-growth area, particularly as manufacturing hubs embrace Industry 4.0. These facilities require specialized FM solutions to manage complex machinery, environmental controls, and compliance with occupational safety standards. In comparison, residential buildings, while growing, command a smaller share of the market due to fragmented service demand and lower complexity. However, gated communities and high-rise developments are driving the demand for integrated residential FM in emerging economies.
Regional Analysis
In regional terms, Asia Pacific remains the global leader in the facility management market as of 2025, holding over 32.6% of global revenue, or approximately USD 225 billion. This growth is supported by rapid urbanization, infrastructure development, and increased outsourcing across sectors. Countries like China, India, and Southeast Asian nations are investing heavily in commercial real estate, manufacturing, and smart city initiatives—all of which demand comprehensive FM solutions. Regulatory frameworks around energy efficiency and building codes are also maturing, further driving formalization and professionalization of the sector.
North America continues to be a mature but innovation-driven market, where the focus is shifting toward sustainability, digital twins, and ESG-aligned facility strategies. Europe, on the other hand, is characterized by strict compliance standards, which favor bundled service contracts and technology-centric FM models. Meanwhile, Latin America and the Middle East & Africa are emerging as high-opportunity regions, registering CAGR figures above 9%, fueled by industrial expansion and government-led infrastructure modernization. These geographies are seeing a rising influx of global FM providers aiming to capture first-mover advantages.
By Type (Outsourced, In-house), By Service (Hard Service, Soft Service, Management Service), By Application (Education, Commercial, Transportation, Industrial, Government & Public, Healthcare, Retail, Others)
Research Methodology
Primary Research- 100 Interviews of Stakeholders
Secondary Research
Desk Research
Regional scope
North America (United States, Canada, Mexico)
Latin America (Brazil, Argentina, Columbia)
East Asia And Pacific (China, Japan, South Korea, Australia, Cambodia, Fiji, Indonesia)
Sea And South Asia (India, Singapore, Thailand, Taiwan, Malaysia)
Eastern Europe (Poland, Russia, Czech Republic, Romania)
Western Europe (Germany, U.K., France, Spain, Itlay)
Middle East & Africa (GCC Countries, Egypt, Nigeria, South Africa, Israel)
Competitive Landscape
Sodexo Inc., Cushman & Wakefield PLC, Shine Management & Facility Services, CBRE Group Inc., ISS Facility Services Inc., Guardian Service Industries Inc., SMI Facility Services, AHI Facility Services Inc., Emeric Facility Services, Jones Lang LaSalle Incorporated, Other Key Players
Customization Scope
Customization for segments, region/country-level will be provided. Moreover, additional customization can be done based on the requirements.
Pricing and Purchase Options
Avail customized purchase options to meet your exact research needs. We have three licenses to opt for: Single User License, Multi-User License (Up to 5 Users), Corporate Use License (Unlimited User and Printable PDF).
TABLE OF CONTENTS
1. EXECUTIVE SUMMARY
1.1. MARKET SNAPSHOT
1.2. KEY FINDINGS & INSIGHTS
1.3. ANALYST RECOMMENDATIONS
1.4. FUTURE OUTLOOK
2. RESEARCH METHODOLOGY
2.1. MARKET DEFINITION & SCOPE
2.2. RESEARCH OBJECTIVES: PRIMARY & SECONDARY DATA SOURCES
2.3. DATA COLLECTION SOURCES
2.3.1. COVERAGE OF 100+ PRIMARY RESEARCH/CONSULTATION CALLS WITH INDUSTRY STAKEHOLDERS
FIGURE 17 NORTH AMERICA FACILITY MANAGEMENT CURRENT AND FUTURE TYPE ANALYSIS, 2025–2034, (USD MILLION)
FIGURE 18 NORTH AMERICA FACILITY MANAGEMENT CURRENT AND FUTURE END USER ANALYSIS, 2025–2034, (USD MILLION)
FIGURE 19 MARKET SHARE BY COUNTRY
FIGURE 20 LATIN AMERICA FACILITY MANAGEMENT CURRENT AND FUTURE TYPE ANALYSIS, 2025–2034, (USD MILLION)
FIGURE 21 LATIN AMERICA FACILITY MANAGEMENT CURRENT AND FUTURE END USER ANALYSIS, 2025–2034, (USD MILLION)
FIGURE 22 MARKET SHARE BY COUNTRY
FIGURE 23 EASTERN EUROPE FACILITY MANAGEMENT CURRENT AND FUTURE TYPE ANALYSIS, 2025–2034, (USD MILLION)
FIGURE 24 EASTERN EUROPE FACILITY MANAGEMENT CURRENT AND FUTURE END USER ANALYSIS, 2025–2034, (USD MILLION)
FIGURE 25 MARKET SHARE BY COUNTRY
FIGURE 26 WESTERN EUROPE FACILITY MANAGEMENT CURRENT AND FUTURE TYPE ANALYSIS, 2025–2034, (USD MILLION)
FIGURE 27 WESTERN EUROPE FACILITY MANAGEMENT CURRENT AND FUTURE END USER ANALYSIS, 2025–2034, (USD MILLION)
FIGURE 28 MARKET SHARE BY COUNTRY
FIGURE 29 EAST ASIA AND PACIFIC FACILITY MANAGEMENT CURRENT AND FUTURE TYPE ANALYSIS, 2025–2034, (USD MILLION)
FIGURE 30 EAST ASIA AND PACIFIC FACILITY MANAGEMENT CURRENT AND FUTURE END USER ANALYSIS, 2025–2034, (USD MILLION)
FIGURE 31 MARKET SHARE BY COUNTRY
FIGURE 32 SEA AND SOUTH ASIA FACILITY MANAGEMENT CURRENT AND FUTURE TYPE ANALYSIS, 2025–2034, (USD MILLION)
FIGURE 33 SEA AND SOUTH ASIA FACILITY MANAGEMENT CURRENT AND FUTURE END USER ANALYSIS, 2025–2034, (USD MILLION)
FIGURE 34 MARKET SHARE BY COUNTRY
FIGURE 35 MIDDLE EAST AND AFRICA FACILITY MANAGEMENT CURRENT AND FUTURE TYPE ANALYSIS, 2025–2034, (USD MILLION)
FIGURE 36 MIDDLE EAST AND AFRICA FACILITY MANAGEMENT CURRENT AND FUTURE END USER ANALYSIS, 2025–2034, (USD MILLION)
FIGURE 37 NORTH AMERICA FACILITY MANAGEMENT CURRENT AND FUTURE MARKET VOLUME SHARE REGIONAL ANALYSIS, 2025–2034, (USD MILLION)
FIGURE 38 U.S. FACILITY MANAGEMENT CURRENT AND FUTURE TYPE ANALYSIS, 2025–2034, (USD MILLION)
FIGURE 39 U.S. FACILITY MANAGEMENT CURRENT AND FUTURE END USER ANALYSIS, 2025–2034, (USD MILLION)
FIGURE 40 CANADA FACILITY MANAGEMENT CURRENT AND FUTURE TYPE ANALYSIS, 2025–2034, (USD MILLION)
FIGURE 41 CANADA FACILITY MANAGEMENT CURRENT AND FUTURE END USER ANALYSIS, 2025–2034, (USD MILLION)
FIGURE 42 LATIN AMERICA FACILITY MANAGEMENT CURRENT AND FUTURE MARKET VOLUME SHARE REGIONAL ANALYSIS, 2025–2034, (USD MILLION)
FIGURE 43 MEXICO FACILITY MANAGEMENT CURRENT AND FUTURE TYPE ANALYSIS, 2025–2034, (USD MILLION)
FIGURE 44 MEXICO FACILITY MANAGEMENT CURRENT AND FUTURE END USER ANALYSIS, 2025–2034, (USD MILLION)
FIGURE 45 BRAZIL FACILITY MANAGEMENT CURRENT AND FUTURE TYPE ANALYSIS, 2025–2034, (USD MILLION)
FIGURE 46 BRAZIL FACILITY MANAGEMENT CURRENT AND FUTURE END USER ANALYSIS, 2025–2034, (USD MILLION)
FIGURE 47 ARGENTINA FACILITY MANAGEMENT CURRENT AND FUTURE TYPE ANALYSIS, 2025–2034, (USD MILLION)
FIGURE 48 ARGENTINA FACILITY MANAGEMENT CURRENT AND FUTURE END USER ANALYSIS, 2025–2034, (USD MILLION)
FIGURE 49 COLUMBIA FACILITY MANAGEMENT CURRENT AND FUTURE TYPE ANALYSIS, 2025–2034, (USD MILLION)
FIGURE 50 COLUMBIA FACILITY MANAGEMENT CURRENT AND FUTURE END USER ANALYSIS, 2025–2034, (USD MILLION)
FIGURE 51 REST OF LATIN AMERICA FACILITY MANAGEMENT CURRENT AND FUTURE TYPE ANALYSIS, 2025–2034, (USD MILLION)
FIGURE 52 REST OF LATIN AMERICA FACILITY MANAGEMENT CURRENT AND FUTURE END USER ANALYSIS, 2025–2034, (USD MILLION)
FIGURE 53 EASTERN EUROPE FACILITY MANAGEMENT CURRENT AND FUTURE MARKET VOLUME SHARE REGIONAL ANALYSIS, 2025–2034, (USD MILLION)
FIGURE 54 POLAND FACILITY MANAGEMENT CURRENT AND FUTURE TYPE ANALYSIS, 2025–2034, (USD MILLION)
FIGURE 55 POLAND FACILITY MANAGEMENT CURRENT AND FUTURE END USER ANALYSIS, 2025–2034, (USD MILLION)
FIGURE 56 RUSSIA FACILITY MANAGEMENT CURRENT AND FUTURE TYPE ANALYSIS, 2025–2034, (USD MILLION)
FIGURE 57 RUSSIA FACILITY MANAGEMENT CURRENT AND FUTURE END USER ANALYSIS, 2025–2034, (USD MILLION)
FIGURE 58 CZECH REPUBLIC FACILITY MANAGEMENT CURRENT AND FUTURE TYPE ANALYSIS, 2025–2034, (USD MILLION)
FIGURE 59 CZECH REPUBLIC FACILITY MANAGEMENT CURRENT AND FUTURE END USER ANALYSIS, 2025–2034, (USD MILLION)
FIGURE 60 ROMANIA FACILITY MANAGEMENT CURRENT AND FUTURE TYPE ANALYSIS, 2025–2034, (USD MILLION)
FIGURE 61 ROMANIA FACILITY MANAGEMENT CURRENT AND FUTURE END USER ANALYSIS, 2025–2034, (USD MILLION)
FIGURE 62 REST OF EASTERN EUROPE FACILITY MANAGEMENT CURRENT AND FUTURE TYPE ANALYSIS, 2025–2034, (USD MILLION)
FIGURE 63 REST OF EASTERN EUROPE FACILITY MANAGEMENT CURRENT AND FUTURE END USER ANALYSIS, 2025–2034, (USD MILLION)
FIGURE 64 WESTERN EUROPE FACILITY MANAGEMENT CURRENT AND FUTURE MARKET VOLUME SHARE REGIONAL ANALYSIS, 2025–2034, (USD MILLION)
FIGURE 65 GERMANY FACILITY MANAGEMENT CURRENT AND FUTURE TYPE ANALYSIS, 2025–2034, (USD MILLION)
FIGURE 66 GERMANY FACILITY MANAGEMENT CURRENT AND FUTURE END USER ANALYSIS, 2025–2034, (USD MILLION)
FIGURE 67 FRANCE FACILITY MANAGEMENT CURRENT AND FUTURE TYPE ANALYSIS, 2025–2034, (USD MILLION)
FIGURE 68 FRANCE FACILITY MANAGEMENT CURRENT AND FUTURE END USER ANALYSIS, 2025–2034, (USD MILLION)
FIGURE 69 UK FACILITY MANAGEMENT CURRENT AND FUTURE TYPE ANALYSIS, 2025–2034, (USD MILLION)
FIGURE 70 UK FACILITY MANAGEMENT CURRENT AND FUTURE END USER ANALYSIS, 2025–2034, (USD MILLION)
FIGURE 71 SPAIN FACILITY MANAGEMENT CURRENT AND FUTURE TYPE ANALYSIS, 2025–2034, (USD MILLION)
FIGURE 72 SPAIN FACILITY MANAGEMENT CURRENT AND FUTURE END USER ANALYSIS, 2025–2034, (USD MILLION)
FIGURE 73 ITALY FACILITY MANAGEMENT CURRENT AND FUTURE TYPE ANALYSIS, 2025–2034, (USD MILLION)
FIGURE 74 ITALY FACILITY MANAGEMENT CURRENT AND FUTURE END USER ANALYSIS, 2025–2034, (USD MILLION)
FIGURE 75 REST OF WESTERN EUROPE FACILITY MANAGEMENT CURRENT AND FUTURE TYPE ANALYSIS, 2025–2034, (USD MILLION)
FIGURE 76 REST OF WESTERN EUROPE FACILITY MANAGEMENT CURRENT AND FUTURE END USER ANALYSIS, 2025–2034, (USD MILLION)
FIGURE 77 EAST ASIA AND PACIFIC FACILITY MANAGEMENT CURRENT AND FUTURE MARKET VOLUME SHARE REGIONAL ANALYSIS, 2025–2034, (USD MILLION)
FIGURE 78 CHINA FACILITY MANAGEMENT CURRENT AND FUTURE TYPE ANALYSIS, 2025–2034, (USD MILLION)
FIGURE 79 CHINA FACILITY MANAGEMENT CURRENT AND FUTURE END USER ANALYSIS, 2025–2034, (USD MILLION)
FIGURE 80 JAPAN FACILITY MANAGEMENT CURRENT AND FUTURE TYPE ANALYSIS, 2025–2034, (USD MILLION)
FIGURE 81 JAPAN FACILITY MANAGEMENT CURRENT AND FUTURE END USER ANALYSIS, 2025–2034, (USD MILLION)
FIGURE 82 AUSTRALIA FACILITY MANAGEMENT CURRENT AND FUTURE TYPE ANALYSIS, 2025–2034, (USD MILLION)
FIGURE 83 AUSTRALIA FACILITY MANAGEMENT CURRENT AND FUTURE END USER ANALYSIS, 2025–2034, (USD MILLION)
FIGURE 84 CAMBODIA FACILITY MANAGEMENT CURRENT AND FUTURE TYPE ANALYSIS, 2025–2034, (USD MILLION)
FIGURE 85 CAMBODIA FACILITY MANAGEMENT CURRENT AND FUTURE END USER ANALYSIS, 2025–2034, (USD MILLION)
FIGURE 86 FIJI FACILITY MANAGEMENT CURRENT AND FUTURE TYPE ANALYSIS, 2025–2034, (USD MILLION)
FIGURE 87 FIJI FACILITY MANAGEMENT CURRENT AND FUTURE END USER ANALYSIS, 2025–2034, (USD MILLION)
FIGURE 88 INDONESIA FACILITY MANAGEMENT CURRENT AND FUTURE TYPE ANALYSIS, 2025–2034, (USD MILLION)
FIGURE 89 INDONESIA FACILITY MANAGEMENT CURRENT AND FUTURE END USER ANALYSIS, 2025–2034, (USD MILLION)
FIGURE 90 SOUTH KOREA FACILITY MANAGEMENT CURRENT AND FUTURE TYPE ANALYSIS, 2025–2034, (USD MILLION)
FIGURE 91 SOUTH KOREA FACILITY MANAGEMENT CURRENT AND FUTURE END USER ANALYSIS, 2025–2034, (USD MILLION)
FIGURE 92 REST OF EAST ASIA AND PACIFIC FACILITY MANAGEMENT CURRENT AND FUTURE TYPE ANALYSIS, 2025–2034, (USD MILLION)
FIGURE 93 REST OF EAST ASIA AND PACIFIC FACILITY MANAGEMENT CURRENT AND FUTURE END USER ANALYSIS, 2025–2034, (USD MILLION)
FIGURE 94 SEA AND SOUTH ASIA FACILITY MANAGEMENT CURRENT AND FUTURE MARKET VOLUME SHARE REGIONAL ANALYSIS, 2025–2034, (USD MILLION)
FIGURE 95 BANGLADESH FACILITY MANAGEMENT CURRENT AND FUTURE TYPE ANALYSIS, 2025–2034, (USD MILLION)
FIGURE 96 BANGLADESH FACILITY MANAGEMENT CURRENT AND FUTURE END USER ANALYSIS, 2025–2034, (USD MILLION)
FIGURE 97 NEW ZEALAND FACILITY MANAGEMENT CURRENT AND FUTURE TYPE ANALYSIS, 2025–2034, (USD MILLION)
FIGURE 98 NEW ZEALAND FACILITY MANAGEMENT CURRENT AND FUTURE END USER ANALYSIS, 2025–2034, (USD MILLION)
FIGURE 99 INDIA FACILITY MANAGEMENT CURRENT AND FUTURE TYPE ANALYSIS, 2025–2034, (USD MILLION)
FIGURE 100 INDIA FACILITY MANAGEMENT CURRENT AND FUTURE END USER ANALYSIS, 2025–2034, (USD MILLION)
FIGURE 101 SINGAPORE FACILITY MANAGEMENT CURRENT AND FUTURE TYPE ANALYSIS, 2025–2034, (USD MILLION)
FIGURE 102 SINGAPORE FACILITY MANAGEMENT CURRENT AND FUTURE END USER ANALYSIS, 2025–2034, (USD MILLION)
FIGURE 103 THAILAND FACILITY MANAGEMENT CURRENT AND FUTURE TYPE ANALYSIS, 2025–2034, (USD MILLION)
FIGURE 104 THAILAND FACILITY MANAGEMENT CURRENT AND FUTURE END USER ANALYSIS, 2025–2034, (USD MILLION)
FIGURE 105 TAIWAN FACILITY MANAGEMENT CURRENT AND FUTURE TYPE ANALYSIS, 2025–2034, (USD MILLION)
FIGURE 106 TAIWAN FACILITY MANAGEMENT CURRENT AND FUTURE END USER ANALYSIS, 2025–2034, (USD MILLION)
FIGURE 107 MALAYSIA FACILITY MANAGEMENT CURRENT AND FUTURE TYPE ANALYSIS, 2025–2034, (USD MILLION)
FIGURE 108 MALAYSIA FACILITY MANAGEMENT CURRENT AND FUTURE END USER ANALYSIS, 2025–2034, (USD MILLION)
FIGURE 109 REST OF SEA AND SOUTH ASIA FACILITY MANAGEMENT CURRENT AND FUTURE TYPE ANALYSIS, 2025–2034, (USD MILLION)
FIGURE 110 REST OF SEA AND SOUTH ASIA FACILITY MANAGEMENT CURRENT AND FUTURE END USER ANALYSIS, 2025–2034, (USD MILLION)
FIGURE 111 MIDDLE EAST AND AFRICA FACILITY MANAGEMENT CURRENT AND FUTURE MARKET VOLUME SHARE REGIONAL ANALYSIS, 2025–2034, (USD MILLION)
FIGURE 112 GCC COUNTRIES FACILITY MANAGEMENT CURRENT AND FUTURE TYPE ANALYSIS, 2025–2034, (USD MILLION)
FIGURE 113 GCC COUNTRIES FACILITY MANAGEMENT CURRENT AND FUTURE END USER ANALYSIS, 2025–2034, (USD MILLION)
FIGURE 114 SAUDI ARABIA FACILITY MANAGEMENT CURRENT AND FUTURE TYPE ANALYSIS, 2025–2034, (USD MILLION)
FIGURE 115 SAUDI ARABIA FACILITY MANAGEMENT CURRENT AND FUTURE END USER ANALYSIS, 2025–2034, (USD MILLION)
FIGURE 116 UAE FACILITY MANAGEMENT CURRENT AND FUTURE TYPE ANALYSIS, 2025–2034, (USD MILLION)
FIGURE 117 UAE FACILITY MANAGEMENT CURRENT AND FUTURE END USER ANALYSIS, 2025–2034, (USD MILLION)
FIGURE 118 BAHRAIN FACILITY MANAGEMENT CURRENT AND FUTURE TYPE ANALYSIS, 2025–2034, (USD MILLION)
FIGURE 119 BAHRAIN FACILITY MANAGEMENT CURRENT AND FUTURE END USER ANALYSIS, 2025–2034, (USD MILLION)
FIGURE 120 KUWAIT FACILITY MANAGEMENT CURRENT AND FUTURE TYPE ANALYSIS, 2025–2034, (USD MILLION)
FIGURE 121 KUWAIT FACILITY MANAGEMENT CURRENT AND FUTURE END USER ANALYSIS, 2025–2034, (USD MILLION)
FIGURE 122 OMAN FACILITY MANAGEMENT CURRENT AND FUTURE TYPE ANALYSIS, 2025–2034, (USD MILLION)
FIGURE 123 OMAN FACILITY MANAGEMENT CURRENT AND FUTURE END USER ANALYSIS, 2025–2034, (USD MILLION)
FIGURE 124 QATAR FACILITY MANAGEMENT CURRENT AND FUTURE TYPE ANALYSIS, 2025–2034, (USD MILLION)
FIGURE 125 QATAR FACILITY MANAGEMENT CURRENT AND FUTURE END USER ANALYSIS, 2025–2034, (USD MILLION)
FIGURE 126 EGYPT FACILITY MANAGEMENT CURRENT AND FUTURE TYPE ANALYSIS, 2025–2034, (USD MILLION)
FIGURE 127 EGYPT FACILITY MANAGEMENT CURRENT AND FUTURE END USER ANALYSIS, 2025–2034, (USD MILLION)
FIGURE 128 NIGERIA FACILITY MANAGEMENT CURRENT AND FUTURE TYPE ANALYSIS, 2025–2034, (USD MILLION)
FIGURE 129 NIGERIA FACILITY MANAGEMENT CURRENT AND FUTURE END USER ANALYSIS, 2025–2034, (USD MILLION)
FIGURE 130 SOUTH AFRICA FACILITY MANAGEMENT CURRENT AND FUTURE TYPE ANALYSIS, 2025–2034, (USD MILLION)
FIGURE 131 SOUTH AFRICA FACILITY MANAGEMENT CURRENT AND FUTURE END USER ANALYSIS, 2025–2034, (USD MILLION)
FIGURE 132 ISRAEL FACILITY MANAGEMENT CURRENT AND FUTURE TYPE ANALYSIS, 2025–2034, (USD MILLION)
FIGURE 133 ISRAEL FACILITY MANAGEMENT CURRENT AND FUTURE END USER ANALYSIS, 2025–2034, (USD MILLION)
FIGURE 134 REST OF MEA FACILITY MANAGEMENT CURRENT AND FUTURE TYPE ANALYSIS, 2025–2034, (USD MILLION)
FIGURE 135 REST OF MEA FACILITY MANAGEMENT CURRENT AND FUTURE END USER ANALYSIS, 2025–2034, (USD MILLION)
FIGURE 136 U. S. MARKET SHARE ANALYSIS BY TYPE (2024)
FIGURE 137 U. S. MARKET SHARE ANALYSIS BY END USER (2024)
FIGURE 138 CANADA MARKET SHARE ANALYSIS BY TYPE (2024)
FIGURE 139 CANADA MARKET SHARE ANALYSIS BY END USER (2024)
FIGURE 140 MEXICO MARKET SHARE ANALYSIS BY TYPE (2024)
FIGURE 141 MEXICO MARKET SHARE ANALYSIS BY END USER (2024)
FIGURE 142 CHINA MARKET SHARE ANALYSIS BY TYPE (2024)
FIGURE 143 CHINA MARKET SHARE ANALYSIS BY END USER (2024)
FIGURE 144 JAPAN MARKET SHARE ANALYSIS BY TYPE (2024)
FIGURE 145 JAPAN MARKET SHARE ANALYSIS BY END USER (2024)
FIGURE 146 INDIA MARKET SHARE ANALYSIS BY TYPE (2024)
FIGURE 147 INDIA MARKET SHARE ANALYSIS BY END USER (2024)
FIGURE 148 SOUTH KOREA MARKET SHARE ANALYSIS BY TYPE (2024)
FIGURE 149 SOUTH KOREA MARKET SHARE ANALYSIS BY END USER (2024)
FIGURE 150 SAUDI ARABIA MARKET SHARE ANALYSIS BY TYPE (2024)
FIGURE 151 SAUDI ARABIA MARKET SHARE ANALYSIS BY END USER (2024)
FIGURE 152 UAE MARKET SHARE ANALYSIS BY TYPE (2024)
FIGURE 153 UAE MARKET SHARE ANALYSIS BY END USER (2024)
FIGURE 154 EGYPT MARKET SHARE ANALYSIS BY TYPE (2024)
FIGURE 155 EGYPT MARKET SHARE ANALYSIS BY END USER (2024)
FIGURE 156 NIGERIA MARKET SHARE ANALYSIS BY TYPE (2024)
FIGURE 157 NIGERIA MARKET SHARE ANALYSIS BY END USER (2024)
FIGURE 158 SOUTH AFRICA MARKET SHARE ANALYSIS BY TYPE (2024)
FIGURE 159 SOUTH AFRICA MARKET SHARE ANALYSIS BY END USER (2024)
FIGURE 160 GERMANY MARKET SHARE ANALYSIS BY TYPE (2024)
FIGURE 161 GERMANY MARKET SHARE ANALYSIS BY END USER (2024)
FIGURE 162 FRANCE MARKET SHARE ANALYSIS BY TYPE (2024)
FIGURE 163 FRANCE MARKET SHARE ANALYSIS BY END USER (2024)
FIGURE 164 UK MARKET SHARE ANALYSIS BY TYPE (2024)
FIGURE 165 UK MARKET SHARE ANALYSIS BY END USER (2024)
FIGURE 166 SPAIN MARKET SHARE ANALYSIS BY TYPE (2024)
FIGURE 167 SPAIN MARKET SHARE ANALYSIS BY END USER (2024)
FIGURE 168 ITALY MARKET SHARE ANALYSIS BY TYPE (2024)
FIGURE 169 ITALY MARKET SHARE ANALYSIS BY END USER (2024)
FIGURE 170 BRAZIL MARKET SHARE ANALYSIS BY TYPE (2024)
FIGURE 171 BRAZIL MARKET SHARE ANALYSIS BY END USER (2024)
FIGURE 172 ARGENTINA MARKET SHARE ANALYSIS BY TYPE (2024)
FIGURE 173 ARGENTINA MARKET SHARE ANALYSIS BY END USER (2024)
FIGURE 174 COLUMBIA MARKET SHARE ANALYSIS BY TYPE (2024)
FIGURE 175 COLUMBIA MARKET SHARE ANALYSIS BY END USER (2024)
FIGURE 176 GLOBAL FACILITY MANAGEMENT CURRENT AND FUTURE MARKET KEY COUNTRY LEVEL ANALYSIS, 2024–2034, (USD MILLION)
FIGURE 177 FINANCIAL OVERVIEW:
Key Player Analysis
CBRE Group Inc.: CBRE Group Inc. maintains its position as a market leader in the Facility Management Control System (FMCS) space, leveraging its expansive global footprint and strong client portfolio across commercial, industrial, and institutional sectors. As of 2025, CBRE continues to drive innovation through its proprietary platform, CBRE Host, which integrates workplace experience solutions with real-time facility analytics. The firm’s early investment in AI-powered automation and IoT-based building systems has enabled predictive maintenance and energy optimization, key areas of focus in the modern FMCS landscape.
Strategically, CBRE has expanded its technology ecosystem through selective acquisitions and partnerships with leading proptech firms. Its acquisition of a European smart building solutions provider in late 2024 has strengthened its foothold in the EMEA region. Additionally, CBRE’s commitment to sustainability-led services, aligned with ESG metrics, positions it as a preferred partner for Fortune 500 clients pursuing net-zero targets. With over 100,000 employees globally and services in more than 100 countries, the company’s scale, technology investment, and integrated service delivery continue to differentiate it in an increasingly competitive market.
Jones Lang LaSalle Incorporated (JLL): JLL is positioned as a global innovator in the FMCS market, consistently advancing its portfolio through digital transformation and sustainability-centric services. Through its technology platform Corrigo, JLL offers a comprehensive suite for asset management, work order automation, and performance analytics—serving both single-site and multi-site operations. In 2025, JLL has expanded the platform’s capabilities by integrating AI-driven fault detection and machine learning-based energy forecasting, significantly improving operational efficiency for its enterprise clients.
The firm’s strategic focus on green building management and energy compliance solutions aligns with growing regulatory pressures and corporate ESG goals. Its recent partnerships with clean tech firms and investments in building decarbonization tools have bolstered its reputation as a sustainability leader. JLL’s presence in over 80 countries, coupled with deep expertise across commercial real estate, makes it a go-to provider for end-to-end FMCS solutions across both developed and emerging markets.
Cushman & Wakefield PLC: Cushman & Wakefield positions itself as a strong challenger in the FMCS sector, with a focus on digital integration and client-centric customization. Its proprietary C&W Services platform emphasizes intelligent building operations, combining IoT integration, cloud-based command centers, and mobile-first maintenance solutions. In 2025, the company is investing heavily in real-time data platforms to enhance lifecycle management and compliance reporting, particularly for clients in healthcare, industrial, and education segments.
Cushman & Wakefield differentiates itself through a regional strength in North America and APAC, supported by strategic alliances with local technology firms and energy service providers. The company’s proactive move toward bundled FMCS offerings, coupled with flexible service-level agreements (SLAs), has allowed it to capture mid-market clients seeking scalable and efficient operations. With ongoing investments in AI-based space utilization analytics and smart energy dashboards, the firm is well-positioned to compete in a tech-forward market landscape.
Emeric Facility Services: Emeric Facility Services is emerging as a niche disruptor in the FMCS market, gaining recognition for its agile approach and strong focus on automation-first facility management. While smaller in scale compared to global players, Emeric has carved out a competitive edge through its modular FMCS solutions tailored for SMEs and mid-sized enterprises. Its cloud-native platform, launched in 2023 and updated in 2025, now features AI-based scheduling, predictive maintenance algorithms, and integrated sustainability reporting—delivering enterprise-grade functionality at a lower cost point.
Emeric’s competitive advantage lies in its rapid deployment model, high client retention, and strategic focus on underpenetrated markets in Southeast Asia and the Middle East. The company has reported annual revenue growth exceeding 18% over the past two years and has doubled its client base since 2022. Its lean operational model, coupled with ongoing investment in R&D and a strong partner network, positions it as a rising player to watch in the evolving FMCS space.
Market Key Players
Sodexo Inc.
Cushman & Wakefield PLC
Shine Management & Facility Services
CBRE Group Inc.
ISS Facility Services Inc.
Guardian Service Industries Inc.
SMI Facility Services
AHI Facility Services Inc.
Emeric Facility Services
Jones Lang LaSalle Incorporated
Other Key Players
Driver:
Smart Building Technologies Accelerate FMCS Adoption
As of 2025, the Facility Management Control System (FMCS) market is undergoing a critical shift driven by the widespread integration of smart building technologies. Advanced solutions powered by the Internet of Things (IoT), Artificial Intelligence (AI), and machine learning are reshaping how facilities are monitored and maintained. These systems enable real-time analytics, predictive maintenance, and automated control of lighting, HVAC, and security functions—reducing energy consumption by up to 20% and enhancing occupant comfort.
AI-Enabled Platforms Deliver Efficiency, Sustainability & ROI
For enterprises, the strategic impact lies in improved operational efficiency and measurable sustainability outcomes. With increasing regulatory pressure and ESG expectations, companies are investing in smart FMCS platforms not only to comply but to gain a competitive edge. Vendors offering AI-enabled, data-centric solutions are poised to dominate the market, as clients prioritize systems that deliver measurable ROI and long-term value.
Restraint:
Budget Constraints Limit Upgrading to Advanced FMCS Solutions
Despite growing demand, budgetary constraints remain a significant barrier to widespread FMCS adoption. In 2025, many mid-sized enterprises and public-sector institutions are delaying digital upgrades due to rising capital expenditures, inflationary pressures, and constrained operational budgets. This often results in deferred maintenance and limited investment in advanced systems—directly impacting efficiency and asset lifespan.
High Upfront Costs & Skill Gaps Slow Digital Transformation
Additionally, high upfront costs associated with implementing AI-driven platforms and IoT infrastructure, alongside the need for skilled personnel to manage them, make ROI justification difficult for cost-sensitive organizations. This restraint not only slows technology diffusion but also widens the gap between digitally mature and lagging facility operators.
Opportunity:
Sustainability & ESG Compliance Unlock New FMCS Demand
The accelerating focus on sustainability and ESG compliance presents a substantial opportunity for FMCS providers. Governments and institutional investors are placing increasing emphasis on environmental performance, prompting organizations to seek out energy-efficient, data-driven facility solutions. The global green building market is projected to exceed USD 610 billion by 2027, and FMCS platforms play a pivotal role in tracking energy use, reducing carbon footprints, and managing regulatory compliance.
Green Standards Create Competitive Differentiation for Vendors
Vendors that align their offerings with LEED, WELL, and ISO 50001 standards stand to benefit from this green momentum. In addition to regulatory compliance, companies deploying sustainable facility strategies can realize significant operational savings and enhance brand reputation—making sustainability not just a responsibility but a strategic differentiator.
In 2025, Integrated Facility Management (IFM) and predictive analytics are emerging as game-changers in the FMCS landscape. Organizations are increasingly adopting centralized platforms that unify disparate facility services—ranging from asset maintenance and energy management to workforce scheduling—under a single dashboard. This shift toward integration is expected to improve productivity by 15–20%, while reducing administrative overhead.
Predictive Analytics & IoT Reshape the Future of Smart Facilities
At the same time, predictive maintenance enabled by AI and IoT is reducing unplanned downtime and optimizing lifecycle costs. Forward-thinking companies like Johnson Controls and Honeywell are investing heavily in cloud-based FMCS platforms capable of real-time diagnostics and automation. As buildings become smarter and more connected, FMCS providers that offer scalable, interoperable solutions will be well-positioned to lead in a rapidly evolving, data-driven market.
Recent Developments
Dec 2024 – CBRE Group Inc.: CBRE announced the launch of its next-generation FM One platform, integrating AI-based energy optimization, fault detection, and predictive analytics across its global facility management portfolio. The platform is expected to reduce energy consumption by up to 18% per site. This move enhances CBRE’s position as a digital-first market leader and supports clients in meeting ESG benchmarks.
Feb 2025 – Cushman & Wakefield PLC: The company acquired EnerSys Solutions, a U.S.-based FMCS software provider specializing in real-time energy monitoring and compliance automation, in a deal valued at approximately USD 220 million. The acquisition significantly boosts Cushman’s in-house tech capabilities and strengthens its service offering in regulated verticals like healthcare and education.
Apr 2025 – Emeric Facility Services: Emeric expanded into the Gulf Cooperation Council (GCC) region, securing contracts with three government-led smart city initiatives in the UAE and Saudi Arabia. The contracts are estimated to generate over USD 35 million in recurring annual revenue. This marks a pivotal step in Emeric’s international growth and entry into high-potential emerging markets.
Jul 2025 – Johnson Controls: Johnson Controls unveiled an AI-powered upgrade to its OpenBlue Enterprise Manager, adding dynamic space utilization analytics and carbon footprint tracking tools. The solution is being rolled out across more than 5,000 facilities globally in partnership with multinational clients. This strengthens Johnson Controls’ competitive edge in sustainable, data-driven FMCS solutions.
Sep 2025 – JLL (Jones Lang LaSalle Incorporated): JLL announced a strategic partnership with Google Cloud to enhance its Corrigo platform with advanced generative AI features, including automated work order resolution and voice-command integration. Early pilots show a 23% improvement in technician response time and significant reduction in manual ticket handling. This partnership positions JLL as a front-runner in AI adoption within FMCS.