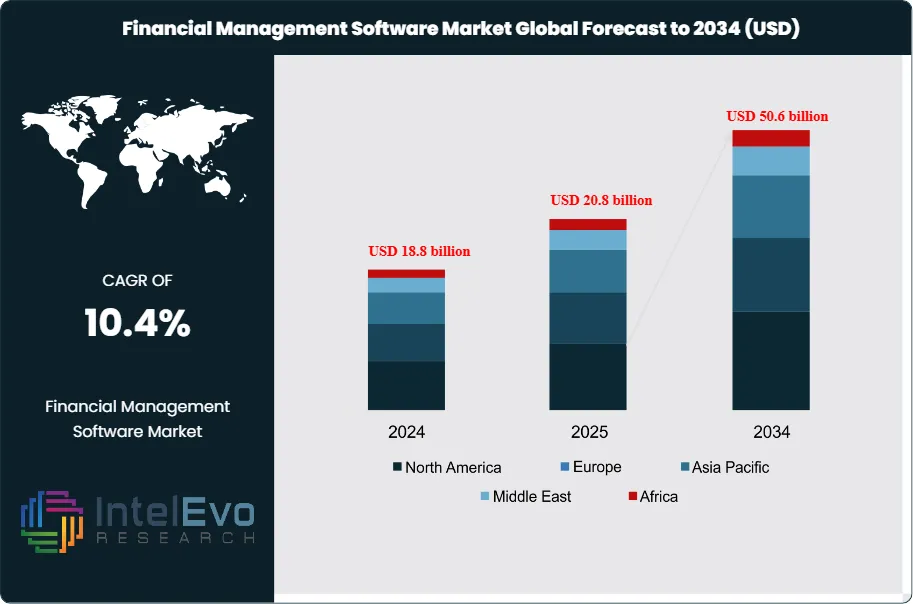
The Financial Management Software Market is estimated at USD 18.8 billion in 2024 and is on track to reach roughly USD 50.6 billion by 2034, implying a compound annual growth rate of 10.4% over 2025–2034. This strong growth is being driven by accelerating digital transformation across enterprises, rising adoption of cloud-based accounting and ERP solutions, and increasing demand for real-time financial visibility. Organizations are prioritizing automation, compliance management, and AI-powered analytics to improve decision-making and reduce operational risk. The expansion of SMEs and the shift toward subscription-based software models are further amplifying market traction, making financial management platforms a critical component of modern business infrastructure.
The market currently balances rapid demand growth with shifting supply dynamics. Adoption among small and medium enterprises drives volume; large enterprises buy enterprise-grade suites from established vendors. Cloud deployments account for roughly 68% of new purchases in 2024, supporting recurring-license models and faster feature rollouts. Market concentration remains notable in financial planning software, where leading platforms held near 60% combined market share in recent years; MoneyGuidePro posted about 32% and eMoney about 28.5% in 2023. Providers report mid-to-high single-digit annual revenue growth from financial modules tied to tax, payroll, and forecasting. Vendor competition focuses on integration capability, industry templates, and third-party ecosystem access.
Regulatory shifts and risk factors materially shape buying behavior. Stricter data protection rules in Europe and evolving reporting standards in North America increase compliance-related spending by an estimated 12% year-on-year. Cybersecurity incidents remain the largest operational risk; an average breach now costs financial software customers an incremental 1.8% of annual revenue when remediation and fines are included. Supply constraints center on skilled implementation resources and certified integrators; these bottlenecks extend deployment timelines by 8 to 14 weeks for complex ERP-integrated projects.
Technology adoption accelerates product differentiation. Providers embed AI and machine learning for anomaly detection, cash-flow forecasting, and automated reconciliations; global investment in AI across financial services reached an estimated USD 35 billion in 2023 and shows continued expansion into 2025. Automation of descriptive and diagnostic analytics moves toward full automation for many firms by the mid-decade; this reduces manual close cycles by up to 40% in early adopter organizations. Blockchain pilots support secure audit trails for high-value transactions; graph analytics improves data lineage for compliance reporting in about 70% of large institutions by 2025.
Regional patterns identify clear hotspots. North America remains the largest revenue source per vendor, driven by high SaaS adoption and banking sector uptake. Asia Pacific delivers the fastest regional CAGR, supported by digital transformation initiatives in China, India, and Southeast Asia. Europe shows steady growth tied to regulatory spend and enterprise consolidation. Investment priorities for 2025 center on scalable cloud architectures, embedded AI services, and modular integrations that reduce total cost of ownership and shorten time-to-value for capital allocators and executive decision-makers.
Key Takeaways
Market Growth: The market reaches USD 50.6 billion by 2034 and posts a CAGR of 10.4 percent. Demand rises as firms shift to automated financial workflows and cloud deployments replace legacy on-premise systems.
Deployment Model: Cloud-based platforms hold more than 70 percent share. Vendors benefit from lower setup costs, faster upgrades, and strong adoption among firms that want real-time reporting and remote access.
Organization Size: SMEs account for more than 65 percent of global demand. This group adopts subscription plans to manage cash flow, accelerate monthly close cycles, and handle compliance without expanding finance teams.
End-Use Sector: BFSI leads with 27.6 percent share. Banks and insurers use advanced modules for risk monitoring, automated reconciliations, and audit-ready reporting.
Application: Accounting and financial reporting accounts for more than 25 percent of total revenue. Firms use these modules to improve accuracy, strengthen internal controls, and shorten close cycles.
Driver: Strong investment in AI strengthens market momentum. Financial services spent about USD 35 billion on AI tools in 2024, and banks contributed more than USD 21 billion of that total. These tools support anomaly detection, automated forecasts, and predictive analytics.
Restraint: High integration and migration costs delay adoption for some firms. Complex ERP-linked deployments raise total project expense by 15 to 20 percent and extend implementation timelines.
Opportunity: Asia Pacific shows strong growth potential, supported by digitalization programs in China, India, and Southeast Asia. Regional demand expands at a projected double-digit CAGR as firms shift to cloud suites and automated reporting tools.
Trend: Automation accelerates across financial workflows. By 2025, about 70 percent of organizations plan to use technologies such as graph analytics, machine learning, AI, and blockchain for data lineage and controls. By 2028, half of large firms expect to replace bottom-up forecasting with AI-driven models.
Regional Analysis: North America leads with more than 38 percent share due to high cloud adoption and strong enterprise spending. Asia Pacific records the fastest rise in new deployments, while Europe expands through compliance-driven upgrades and demand for integrated reporting platforms.
Deployment Analysis
Cloud-based financial management platforms hold a clear lead in 2025. These systems account for more than 70 percent of global deployments due to their lower upfront cost, fast implementation, and ability to handle real-time financial tasks across distributed operations. You gain instant access to updated ledgers, consolidated reports, and automated workflows without maintaining on-premises servers. This shift aligns with the rise of hybrid work, where finance teams depend on tools that support secure access from any location.
The steady migration toward cloud systems also reflects expanding compliance needs and security expectations. Vendors strengthen encryption, monitoring tools, and authentication protocols to address rising cyber risks. These upgrades help firms manage financial records with greater certainty and reduce exposure to operational threats. As adoption widens across mid-market and enterprise segments, cloud platforms become the default choice for organizations seeking predictable cost structures and flexible capacity.
Looking ahead, growth remains tied to broader digital transformation efforts. Cloud ecosystems continue to attract users that want faster upgrades, better integration with ERP systems, and machine learning modules for forecasting, anomaly detection, and reconciliation. This positions cloud deployments as the dominant model for the decade.
Organization Size Analysis
SMEs represent more than 65 percent of total deployments and remain the most active adopters in 2025. These firms use financial management software to replace manual bookkeeping, strengthen controls, and reduce reliance on external accounting services. You benefit from subscription pricing and modular tools that scale with revenue growth. The ability to generate real-time statements and monitor cash flow supports quicker adjustments in competitive markets.
Regulatory pressure also shapes SME adoption. Firms face tighter reporting rules and higher expectations around data integrity. Financial platforms help you manage compliance tasks without large finance departments. Cloud options further support adoption by lowering capital requirements and minimizing IT commitments.
This segment continues to expand as SMEs integrate financial tools with payroll, eCommerce systems, and CRM platforms. Growth remains strong through 2030 as more businesses migrate to automated reporting and analytics.
End-User Industry Analysis
BFSI maintains the highest share, holding more than 27.6 percent of global demand. Banks, insurers, and investment firms depend on advanced reporting, risk scoring, and compliance tools to meet regulatory expectations. You use these systems to manage large transaction volumes, improve audit trails, and strengthen decision-making through real-time analytics.
Financial institutions also accelerate adoption due to rising cyber threats and the need for stronger internal controls. Integrated platforms reduce duplicate data entry and improve consistency across core banking, payment, and treasury systems. This creates measurable gains in accuracy and turnaround times.
Growth in other sectors remains steady. Retail, healthcare, manufacturing, IT, and public agencies expand adoption as they automate finance tasks and apply predictive analysis to budgeting and cost planning.
Functionality Analysis
Accounting and financial reporting lead the functionality landscape with more than 25 percent share. Organizations rely on these modules for ledger management, tax processing, payroll support, and automated close cycles. You gain better accuracy and faster turnaround on key statements, which improves planning and compliance.
Demand grows as regulators increase reporting complexity and stakeholders expect more frequent insights. Tools that integrate with procurement, HR, and sales systems help you reduce errors and maintain consistent financial data across business units.
Budgeting, forecasting, audit management, cash flow tracking, and risk tools also gain traction. Many firms expand into advanced analytical modules that support scenario modeling and automated alerts.
Regional Analysis
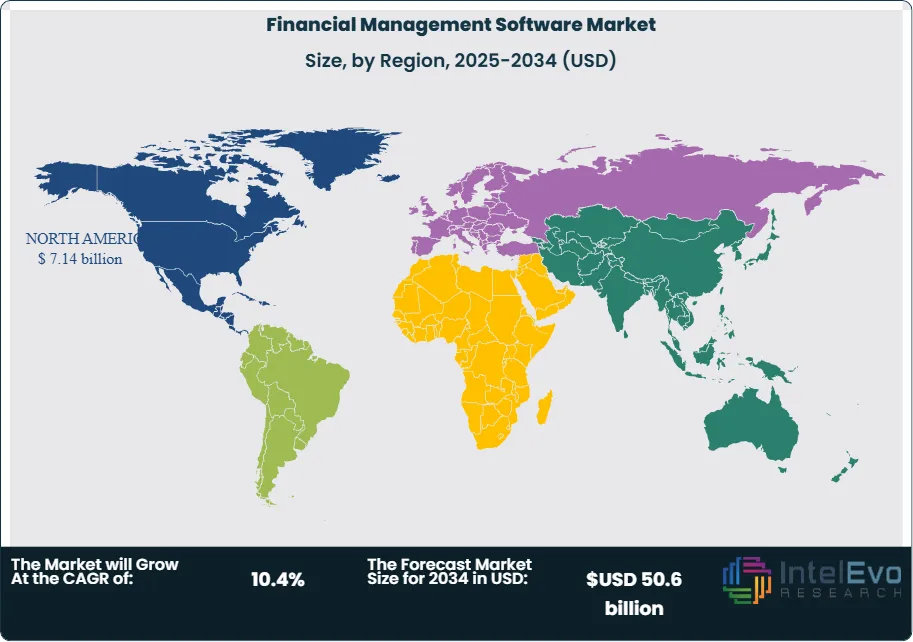
North America leads the global market with more than 38 percent share. Strong enterprise adoption, mature cloud infrastructure, and active investment in AI and machine learning drive continued growth. You also see increased demand from sectors with strict regulations, including banking, healthcare, and government. The region’s financial management software market exceeded USD 6.8 billion in 2023 and continues to expand through 2025.
Europe follows with consistent adoption across regulated industries. Firms upgrade platforms to meet strict transparency, data retention, and reporting mandates. Regional demand remains steady as organizations modernize legacy systems and strengthen security controls.
Asia Pacific records the fastest growth rate. Expanding digital economies in China, India, and Southeast Asia fuel rapid uptake of cloud-based solutions. You benefit from rising investments in IT infrastructure and strong government support for financial digitalization. Latin America and the Middle East & Africa continue to broaden adoption as businesses shift from manual processes to automated financial operations.
By Deployment, (On-Premises, Cloud-Based), By Organization Size, (Small and Medium-sized Enterprises (SMEs), Large Enterprises), By End-User Industry, (Banking, Financial Services, and Insurance (BFSI), Retail and eCommerce, Healthcare, Manufacturing, IT and Telecom, Government and Public Sector, Others), By Functionality, (Accounting and Financial Reporting, Budgeting and Forecasting, Financial Analysis, Audit and Compliance Management, Cash Flow Management, Risk Management, Others)
Research Methodology
Primary Research- 100 Interviews of Stakeholders
Secondary Research
Desk Research
Regional scope
North America (United States, Canada, Mexico)
Latin America (Brazil, Argentina, Columbia)
East Asia And Pacific (China, Japan, South Korea, Australia, Cambodia, Fiji, Indonesia)
Sea And South Asia (India, Singapore, Thailand, Taiwan, Malaysia)
Eastern Europe (Poland, Russia, Czech Republic, Romania)
Western Europe (Germany, U.K., France, Spain, Itlay)
Middle East & Africa (GCC Countries, Egypt, Nigeria, South Africa, Israel)
Competitive Landscape
Microsoft Corporation, Infor Inc., SAS, SAP SE, Intuit Inc., Workday Inc., Sage Group plc, Intacct, Xero Limited, IBM Corporation, Oracle Corporation, Other Key Players
Customization Scope
Customization for segments, region/country-level will be provided. Moreover, additional customization can be done based on the requirements.
Pricing and Purchase Options
Avail customized purchase options to meet your exact research needs. We have three licenses to opt for: Single User License, Multi-User License (Up to 5 Users), Corporate Use License (Unlimited User and Printable PDF).
TABLE OF CONTENTS
1. EXECUTIVE SUMMARY
1.1. MARKET SNAPSHOT
1.2. KEY FINDINGS & INSIGHTS
1.3. ANALYST RECOMMENDATIONS
1.4. FUTURE OUTLOOK
2. RESEARCH METHODOLOGY
2.1. MARKET DEFINITION & SCOPE
2.2. RESEARCH OBJECTIVES: PRIMARY & SECONDARY DATA SOURCES
2.3. DATA COLLECTION SOURCES
2.3.1. COVERAGE OF 100+ PRIMARY RESEARCH/CONSULTATION CALLS WITH INDUSTRY STAKEHOLDERS
FIGURE 17 NORTH AMERICA FINANCIAL MANAGEMENT SOFTWARE CURRENT AND FUTURE TYPE ANALYSIS, 2025–2034, (USD MILLION)
FIGURE 18 NORTH AMERICA FINANCIAL MANAGEMENT SOFTWARE CURRENT AND FUTURE END USER ANALYSIS, 2025–2034, (USD MILLION)
FIGURE 19 MARKET SHARE BY COUNTRY
FIGURE 20 LATIN AMERICA FINANCIAL MANAGEMENT SOFTWARE CURRENT AND FUTURE TYPE ANALYSIS, 2025–2034, (USD MILLION)
FIGURE 21 LATIN AMERICA FINANCIAL MANAGEMENT SOFTWARE CURRENT AND FUTURE END USER ANALYSIS, 2025–2034, (USD MILLION)
FIGURE 22 MARKET SHARE BY COUNTRY
FIGURE 23 EASTERN EUROPE FINANCIAL MANAGEMENT SOFTWARE CURRENT AND FUTURE TYPE ANALYSIS, 2025–2034, (USD MILLION)
FIGURE 24 EASTERN EUROPE FINANCIAL MANAGEMENT SOFTWARE CURRENT AND FUTURE END USER ANALYSIS, 2025–2034, (USD MILLION)
FIGURE 25 MARKET SHARE BY COUNTRY
FIGURE 26 WESTERN EUROPE FINANCIAL MANAGEMENT SOFTWARE CURRENT AND FUTURE TYPE ANALYSIS, 2025–2034, (USD MILLION)
FIGURE 27 WESTERN EUROPE FINANCIAL MANAGEMENT SOFTWARE CURRENT AND FUTURE END USER ANALYSIS, 2025–2034, (USD MILLION)
FIGURE 28 MARKET SHARE BY COUNTRY
FIGURE 29 EAST ASIA AND PACIFIC FINANCIAL MANAGEMENT SOFTWARE CURRENT AND FUTURE TYPE ANALYSIS, 2025–2034, (USD MILLION)
FIGURE 30 EAST ASIA AND PACIFIC FINANCIAL MANAGEMENT SOFTWARE CURRENT AND FUTURE END USER ANALYSIS, 2025–2034, (USD MILLION)
FIGURE 31 MARKET SHARE BY COUNTRY
FIGURE 32 SEA AND SOUTH ASIA FINANCIAL MANAGEMENT SOFTWARE CURRENT AND FUTURE TYPE ANALYSIS, 2025–2034, (USD MILLION)
FIGURE 33 SEA AND SOUTH ASIA FINANCIAL MANAGEMENT SOFTWARE CURRENT AND FUTURE END USER ANALYSIS, 2025–2034, (USD MILLION)
FIGURE 34 MARKET SHARE BY COUNTRY
FIGURE 35 MIDDLE EAST AND AFRICA FINANCIAL MANAGEMENT SOFTWARE CURRENT AND FUTURE TYPE ANALYSIS, 2025–2034, (USD MILLION)
FIGURE 36 MIDDLE EAST AND AFRICA FINANCIAL MANAGEMENT SOFTWARE CURRENT AND FUTURE END USER ANALYSIS, 2025–2034, (USD MILLION)
FIGURE 37 NORTH AMERICA FINANCIAL MANAGEMENT SOFTWARE CURRENT AND FUTURE MARKET VOLUME SHARE REGIONAL ANALYSIS, 2025–2034, (USD MILLION)
FIGURE 38 U.S. FINANCIAL MANAGEMENT SOFTWARE CURRENT AND FUTURE TYPE ANALYSIS, 2025–2034, (USD MILLION)
FIGURE 39 U.S. FINANCIAL MANAGEMENT SOFTWARE CURRENT AND FUTURE END USER ANALYSIS, 2025–2034, (USD MILLION)
FIGURE 40 CANADA FINANCIAL MANAGEMENT SOFTWARE CURRENT AND FUTURE TYPE ANALYSIS, 2025–2034, (USD MILLION)
FIGURE 41 CANADA FINANCIAL MANAGEMENT SOFTWARE CURRENT AND FUTURE END USER ANALYSIS, 2025–2034, (USD MILLION)
FIGURE 42 LATIN AMERICA FINANCIAL MANAGEMENT SOFTWARE CURRENT AND FUTURE MARKET VOLUME SHARE REGIONAL ANALYSIS, 2025–2034, (USD MILLION)
FIGURE 43 MEXICO FINANCIAL MANAGEMENT SOFTWARE CURRENT AND FUTURE TYPE ANALYSIS, 2025–2034, (USD MILLION)
FIGURE 44 MEXICO FINANCIAL MANAGEMENT SOFTWARE CURRENT AND FUTURE END USER ANALYSIS, 2025–2034, (USD MILLION)
FIGURE 45 BRAZIL FINANCIAL MANAGEMENT SOFTWARE CURRENT AND FUTURE TYPE ANALYSIS, 2025–2034, (USD MILLION)
FIGURE 46 BRAZIL FINANCIAL MANAGEMENT SOFTWARE CURRENT AND FUTURE END USER ANALYSIS, 2025–2034, (USD MILLION)
FIGURE 47 ARGENTINA FINANCIAL MANAGEMENT SOFTWARE CURRENT AND FUTURE TYPE ANALYSIS, 2025–2034, (USD MILLION)
FIGURE 48 ARGENTINA FINANCIAL MANAGEMENT SOFTWARE CURRENT AND FUTURE END USER ANALYSIS, 2025–2034, (USD MILLION)
FIGURE 49 COLUMBIA FINANCIAL MANAGEMENT SOFTWARE CURRENT AND FUTURE TYPE ANALYSIS, 2025–2034, (USD MILLION)
FIGURE 50 COLUMBIA FINANCIAL MANAGEMENT SOFTWARE CURRENT AND FUTURE END USER ANALYSIS, 2025–2034, (USD MILLION)
FIGURE 51 REST OF LATIN AMERICA FINANCIAL MANAGEMENT SOFTWARE CURRENT AND FUTURE TYPE ANALYSIS, 2025–2034, (USD MILLION)
FIGURE 52 REST OF LATIN AMERICA FINANCIAL MANAGEMENT SOFTWARE CURRENT AND FUTURE END USER ANALYSIS, 2025–2034, (USD MILLION)
FIGURE 53 EASTERN EUROPE FINANCIAL MANAGEMENT SOFTWARE CURRENT AND FUTURE MARKET VOLUME SHARE REGIONAL ANALYSIS, 2025–2034, (USD MILLION)
FIGURE 54 POLAND FINANCIAL MANAGEMENT SOFTWARE CURRENT AND FUTURE TYPE ANALYSIS, 2025–2034, (USD MILLION)
FIGURE 55 POLAND FINANCIAL MANAGEMENT SOFTWARE CURRENT AND FUTURE END USER ANALYSIS, 2025–2034, (USD MILLION)
FIGURE 56 RUSSIA FINANCIAL MANAGEMENT SOFTWARE CURRENT AND FUTURE TYPE ANALYSIS, 2025–2034, (USD MILLION)
FIGURE 57 RUSSIA FINANCIAL MANAGEMENT SOFTWARE CURRENT AND FUTURE END USER ANALYSIS, 2025–2034, (USD MILLION)
FIGURE 58 CZECH REPUBLIC FINANCIAL MANAGEMENT SOFTWARE CURRENT AND FUTURE TYPE ANALYSIS, 2025–2034, (USD MILLION)
FIGURE 59 CZECH REPUBLIC FINANCIAL MANAGEMENT SOFTWARE CURRENT AND FUTURE END USER ANALYSIS, 2025–2034, (USD MILLION)
FIGURE 60 ROMANIA FINANCIAL MANAGEMENT SOFTWARE CURRENT AND FUTURE TYPE ANALYSIS, 2025–2034, (USD MILLION)
FIGURE 61 ROMANIA FINANCIAL MANAGEMENT SOFTWARE CURRENT AND FUTURE END USER ANALYSIS, 2025–2034, (USD MILLION)
FIGURE 62 REST OF EASTERN EUROPE FINANCIAL MANAGEMENT SOFTWARE CURRENT AND FUTURE TYPE ANALYSIS, 2025–2034, (USD MILLION)
FIGURE 63 REST OF EASTERN EUROPE FINANCIAL MANAGEMENT SOFTWARE CURRENT AND FUTURE END USER ANALYSIS, 2025–2034, (USD MILLION)
FIGURE 64 WESTERN EUROPE FINANCIAL MANAGEMENT SOFTWARE CURRENT AND FUTURE MARKET VOLUME SHARE REGIONAL ANALYSIS, 2025–2034, (USD MILLION)
FIGURE 65 GERMANY FINANCIAL MANAGEMENT SOFTWARE CURRENT AND FUTURE TYPE ANALYSIS, 2025–2034, (USD MILLION)
FIGURE 66 GERMANY FINANCIAL MANAGEMENT SOFTWARE CURRENT AND FUTURE END USER ANALYSIS, 2025–2034, (USD MILLION)
FIGURE 67 FRANCE FINANCIAL MANAGEMENT SOFTWARE CURRENT AND FUTURE TYPE ANALYSIS, 2025–2034, (USD MILLION)
FIGURE 68 FRANCE FINANCIAL MANAGEMENT SOFTWARE CURRENT AND FUTURE END USER ANALYSIS, 2025–2034, (USD MILLION)
FIGURE 69 UK FINANCIAL MANAGEMENT SOFTWARE CURRENT AND FUTURE TYPE ANALYSIS, 2025–2034, (USD MILLION)
FIGURE 70 UK FINANCIAL MANAGEMENT SOFTWARE CURRENT AND FUTURE END USER ANALYSIS, 2025–2034, (USD MILLION)
FIGURE 71 SPAIN FINANCIAL MANAGEMENT SOFTWARE CURRENT AND FUTURE TYPE ANALYSIS, 2025–2034, (USD MILLION)
FIGURE 72 SPAIN FINANCIAL MANAGEMENT SOFTWARE CURRENT AND FUTURE END USER ANALYSIS, 2025–2034, (USD MILLION)
FIGURE 73 ITALY FINANCIAL MANAGEMENT SOFTWARE CURRENT AND FUTURE TYPE ANALYSIS, 2025–2034, (USD MILLION)
FIGURE 74 ITALY FINANCIAL MANAGEMENT SOFTWARE CURRENT AND FUTURE END USER ANALYSIS, 2025–2034, (USD MILLION)
FIGURE 75 REST OF WESTERN EUROPE FINANCIAL MANAGEMENT SOFTWARE CURRENT AND FUTURE TYPE ANALYSIS, 2025–2034, (USD MILLION)
FIGURE 76 REST OF WESTERN EUROPE FINANCIAL MANAGEMENT SOFTWARE CURRENT AND FUTURE END USER ANALYSIS, 2025–2034, (USD MILLION)
FIGURE 77 EAST ASIA AND PACIFIC FINANCIAL MANAGEMENT SOFTWARE CURRENT AND FUTURE MARKET VOLUME SHARE REGIONAL ANALYSIS, 2025–2034, (USD MILLION)
FIGURE 78 CHINA FINANCIAL MANAGEMENT SOFTWARE CURRENT AND FUTURE TYPE ANALYSIS, 2025–2034, (USD MILLION)
FIGURE 79 CHINA FINANCIAL MANAGEMENT SOFTWARE CURRENT AND FUTURE END USER ANALYSIS, 2025–2034, (USD MILLION)
FIGURE 80 JAPAN FINANCIAL MANAGEMENT SOFTWARE CURRENT AND FUTURE TYPE ANALYSIS, 2025–2034, (USD MILLION)
FIGURE 81 JAPAN FINANCIAL MANAGEMENT SOFTWARE CURRENT AND FUTURE END USER ANALYSIS, 2025–2034, (USD MILLION)
FIGURE 82 AUSTRALIA FINANCIAL MANAGEMENT SOFTWARE CURRENT AND FUTURE TYPE ANALYSIS, 2025–2034, (USD MILLION)
FIGURE 83 AUSTRALIA FINANCIAL MANAGEMENT SOFTWARE CURRENT AND FUTURE END USER ANALYSIS, 2025–2034, (USD MILLION)
FIGURE 84 CAMBODIA FINANCIAL MANAGEMENT SOFTWARE CURRENT AND FUTURE TYPE ANALYSIS, 2025–2034, (USD MILLION)
FIGURE 85 CAMBODIA FINANCIAL MANAGEMENT SOFTWARE CURRENT AND FUTURE END USER ANALYSIS, 2025–2034, (USD MILLION)
FIGURE 86 FIJI FINANCIAL MANAGEMENT SOFTWARE CURRENT AND FUTURE TYPE ANALYSIS, 2025–2034, (USD MILLION)
FIGURE 87 FIJI FINANCIAL MANAGEMENT SOFTWARE CURRENT AND FUTURE END USER ANALYSIS, 2025–2034, (USD MILLION)
FIGURE 88 INDONESIA FINANCIAL MANAGEMENT SOFTWARE CURRENT AND FUTURE TYPE ANALYSIS, 2025–2034, (USD MILLION)
FIGURE 89 INDONESIA FINANCIAL MANAGEMENT SOFTWARE CURRENT AND FUTURE END USER ANALYSIS, 2025–2034, (USD MILLION)
FIGURE 90 SOUTH KOREA FINANCIAL MANAGEMENT SOFTWARE CURRENT AND FUTURE TYPE ANALYSIS, 2025–2034, (USD MILLION)
FIGURE 91 SOUTH KOREA FINANCIAL MANAGEMENT SOFTWARE CURRENT AND FUTURE END USER ANALYSIS, 2025–2034, (USD MILLION)
FIGURE 92 REST OF EAST ASIA AND PACIFIC FINANCIAL MANAGEMENT SOFTWARE CURRENT AND FUTURE TYPE ANALYSIS, 2025–2034, (USD MILLION)
FIGURE 93 REST OF EAST ASIA AND PACIFIC FINANCIAL MANAGEMENT SOFTWARE CURRENT AND FUTURE END USER ANALYSIS, 2025–2034, (USD MILLION)
FIGURE 94 SEA AND SOUTH ASIA FINANCIAL MANAGEMENT SOFTWARE CURRENT AND FUTURE MARKET VOLUME SHARE REGIONAL ANALYSIS, 2025–2034, (USD MILLION)
FIGURE 95 BANGLADESH FINANCIAL MANAGEMENT SOFTWARE CURRENT AND FUTURE TYPE ANALYSIS, 2025–2034, (USD MILLION)
FIGURE 96 BANGLADESH FINANCIAL MANAGEMENT SOFTWARE CURRENT AND FUTURE END USER ANALYSIS, 2025–2034, (USD MILLION)
FIGURE 97 NEW ZEALAND FINANCIAL MANAGEMENT SOFTWARE CURRENT AND FUTURE TYPE ANALYSIS, 2025–2034, (USD MILLION)
FIGURE 98 NEW ZEALAND FINANCIAL MANAGEMENT SOFTWARE CURRENT AND FUTURE END USER ANALYSIS, 2025–2034, (USD MILLION)
FIGURE 99 INDIA FINANCIAL MANAGEMENT SOFTWARE CURRENT AND FUTURE TYPE ANALYSIS, 2025–2034, (USD MILLION)
FIGURE 100 INDIA FINANCIAL MANAGEMENT SOFTWARE CURRENT AND FUTURE END USER ANALYSIS, 2025–2034, (USD MILLION)
FIGURE 101 SINGAPORE FINANCIAL MANAGEMENT SOFTWARE CURRENT AND FUTURE TYPE ANALYSIS, 2025–2034, (USD MILLION)
FIGURE 102 SINGAPORE FINANCIAL MANAGEMENT SOFTWARE CURRENT AND FUTURE END USER ANALYSIS, 2025–2034, (USD MILLION)
FIGURE 103 THAILAND FINANCIAL MANAGEMENT SOFTWARE CURRENT AND FUTURE TYPE ANALYSIS, 2025–2034, (USD MILLION)
FIGURE 104 THAILAND FINANCIAL MANAGEMENT SOFTWARE CURRENT AND FUTURE END USER ANALYSIS, 2025–2034, (USD MILLION)
FIGURE 105 TAIWAN FINANCIAL MANAGEMENT SOFTWARE CURRENT AND FUTURE TYPE ANALYSIS, 2025–2034, (USD MILLION)
FIGURE 106 TAIWAN FINANCIAL MANAGEMENT SOFTWARE CURRENT AND FUTURE END USER ANALYSIS, 2025–2034, (USD MILLION)
FIGURE 107 MALAYSIA FINANCIAL MANAGEMENT SOFTWARE CURRENT AND FUTURE TYPE ANALYSIS, 2025–2034, (USD MILLION)
FIGURE 108 MALAYSIA FINANCIAL MANAGEMENT SOFTWARE CURRENT AND FUTURE END USER ANALYSIS, 2025–2034, (USD MILLION)
FIGURE 109 REST OF SEA AND SOUTH ASIA FINANCIAL MANAGEMENT SOFTWARE CURRENT AND FUTURE TYPE ANALYSIS, 2025–2034, (USD MILLION)
FIGURE 110 REST OF SEA AND SOUTH ASIA FINANCIAL MANAGEMENT SOFTWARE CURRENT AND FUTURE END USER ANALYSIS, 2025–2034, (USD MILLION)
FIGURE 111 MIDDLE EAST AND AFRICA FINANCIAL MANAGEMENT SOFTWARE CURRENT AND FUTURE MARKET VOLUME SHARE REGIONAL ANALYSIS, 2025–2034, (USD MILLION)
FIGURE 112 GCC COUNTRIES FINANCIAL MANAGEMENT SOFTWARE CURRENT AND FUTURE TYPE ANALYSIS, 2025–2034, (USD MILLION)
FIGURE 113 GCC COUNTRIES FINANCIAL MANAGEMENT SOFTWARE CURRENT AND FUTURE END USER ANALYSIS, 2025–2034, (USD MILLION)
FIGURE 114 SAUDI ARABIA FINANCIAL MANAGEMENT SOFTWARE CURRENT AND FUTURE TYPE ANALYSIS, 2025–2034, (USD MILLION)
FIGURE 115 SAUDI ARABIA FINANCIAL MANAGEMENT SOFTWARE CURRENT AND FUTURE END USER ANALYSIS, 2025–2034, (USD MILLION)
FIGURE 116 UAE FINANCIAL MANAGEMENT SOFTWARE CURRENT AND FUTURE TYPE ANALYSIS, 2025–2034, (USD MILLION)
FIGURE 117 UAE FINANCIAL MANAGEMENT SOFTWARE CURRENT AND FUTURE END USER ANALYSIS, 2025–2034, (USD MILLION)
FIGURE 118 BAHRAIN FINANCIAL MANAGEMENT SOFTWARE CURRENT AND FUTURE TYPE ANALYSIS, 2025–2034, (USD MILLION)
FIGURE 119 BAHRAIN FINANCIAL MANAGEMENT SOFTWARE CURRENT AND FUTURE END USER ANALYSIS, 2025–2034, (USD MILLION)
FIGURE 120 KUWAIT FINANCIAL MANAGEMENT SOFTWARE CURRENT AND FUTURE TYPE ANALYSIS, 2025–2034, (USD MILLION)
FIGURE 121 KUWAIT FINANCIAL MANAGEMENT SOFTWARE CURRENT AND FUTURE END USER ANALYSIS, 2025–2034, (USD MILLION)
FIGURE 122 OMAN FINANCIAL MANAGEMENT SOFTWARE CURRENT AND FUTURE TYPE ANALYSIS, 2025–2034, (USD MILLION)
FIGURE 123 OMAN FINANCIAL MANAGEMENT SOFTWARE CURRENT AND FUTURE END USER ANALYSIS, 2025–2034, (USD MILLION)
FIGURE 124 QATAR FINANCIAL MANAGEMENT SOFTWARE CURRENT AND FUTURE TYPE ANALYSIS, 2025–2034, (USD MILLION)
FIGURE 125 QATAR FINANCIAL MANAGEMENT SOFTWARE CURRENT AND FUTURE END USER ANALYSIS, 2025–2034, (USD MILLION)
FIGURE 126 EGYPT FINANCIAL MANAGEMENT SOFTWARE CURRENT AND FUTURE TYPE ANALYSIS, 2025–2034, (USD MILLION)
FIGURE 127 EGYPT FINANCIAL MANAGEMENT SOFTWARE CURRENT AND FUTURE END USER ANALYSIS, 2025–2034, (USD MILLION)
FIGURE 128 NIGERIA FINANCIAL MANAGEMENT SOFTWARE CURRENT AND FUTURE TYPE ANALYSIS, 2025–2034, (USD MILLION)
FIGURE 129 NIGERIA FINANCIAL MANAGEMENT SOFTWARE CURRENT AND FUTURE END USER ANALYSIS, 2025–2034, (USD MILLION)
FIGURE 130 SOUTH AFRICA FINANCIAL MANAGEMENT SOFTWARE CURRENT AND FUTURE TYPE ANALYSIS, 2025–2034, (USD MILLION)
FIGURE 131 SOUTH AFRICA FINANCIAL MANAGEMENT SOFTWARE CURRENT AND FUTURE END USER ANALYSIS, 2025–2034, (USD MILLION)
FIGURE 132 ISRAEL FINANCIAL MANAGEMENT SOFTWARE CURRENT AND FUTURE TYPE ANALYSIS, 2025–2034, (USD MILLION)
FIGURE 133 ISRAEL FINANCIAL MANAGEMENT SOFTWARE CURRENT AND FUTURE END USER ANALYSIS, 2025–2034, (USD MILLION)
FIGURE 134 REST OF MEA FINANCIAL MANAGEMENT SOFTWARE CURRENT AND FUTURE TYPE ANALYSIS, 2025–2034, (USD MILLION)
FIGURE 135 REST OF MEA FINANCIAL MANAGEMENT SOFTWARE CURRENT AND FUTURE END USER ANALYSIS, 2025–2034, (USD MILLION)
FIGURE 136 U. S. MARKET SHARE ANALYSIS BY TYPE (2024)
FIGURE 137 U. S. MARKET SHARE ANALYSIS BY END USER (2024)
FIGURE 138 CANADA MARKET SHARE ANALYSIS BY TYPE (2024)
FIGURE 139 CANADA MARKET SHARE ANALYSIS BY END USER (2024)
FIGURE 140 MEXICO MARKET SHARE ANALYSIS BY TYPE (2024)
FIGURE 141 MEXICO MARKET SHARE ANALYSIS BY END USER (2024)
FIGURE 142 CHINA MARKET SHARE ANALYSIS BY TYPE (2024)
FIGURE 143 CHINA MARKET SHARE ANALYSIS BY END USER (2024)
FIGURE 144 JAPAN MARKET SHARE ANALYSIS BY TYPE (2024)
FIGURE 145 JAPAN MARKET SHARE ANALYSIS BY END USER (2024)
FIGURE 146 INDIA MARKET SHARE ANALYSIS BY TYPE (2024)
FIGURE 147 INDIA MARKET SHARE ANALYSIS BY END USER (2024)
FIGURE 148 SOUTH KOREA MARKET SHARE ANALYSIS BY TYPE (2024)
FIGURE 149 SOUTH KOREA MARKET SHARE ANALYSIS BY END USER (2024)
FIGURE 150 SAUDI ARABIA MARKET SHARE ANALYSIS BY TYPE (2024)
FIGURE 151 SAUDI ARABIA MARKET SHARE ANALYSIS BY END USER (2024)
FIGURE 152 UAE MARKET SHARE ANALYSIS BY TYPE (2024)
FIGURE 153 UAE MARKET SHARE ANALYSIS BY END USER (2024)
FIGURE 154 EGYPT MARKET SHARE ANALYSIS BY TYPE (2024)
FIGURE 155 EGYPT MARKET SHARE ANALYSIS BY END USER (2024)
FIGURE 156 NIGERIA MARKET SHARE ANALYSIS BY TYPE (2024)
FIGURE 157 NIGERIA MARKET SHARE ANALYSIS BY END USER (2024)
FIGURE 158 SOUTH AFRICA MARKET SHARE ANALYSIS BY TYPE (2024)
FIGURE 159 SOUTH AFRICA MARKET SHARE ANALYSIS BY END USER (2024)
FIGURE 160 GERMANY MARKET SHARE ANALYSIS BY TYPE (2024)
FIGURE 161 GERMANY MARKET SHARE ANALYSIS BY END USER (2024)
FIGURE 162 FRANCE MARKET SHARE ANALYSIS BY TYPE (2024)
FIGURE 163 FRANCE MARKET SHARE ANALYSIS BY END USER (2024)
FIGURE 164 UK MARKET SHARE ANALYSIS BY TYPE (2024)
FIGURE 165 UK MARKET SHARE ANALYSIS BY END USER (2024)
FIGURE 166 SPAIN MARKET SHARE ANALYSIS BY TYPE (2024)
FIGURE 167 SPAIN MARKET SHARE ANALYSIS BY END USER (2024)
FIGURE 168 ITALY MARKET SHARE ANALYSIS BY TYPE (2024)
FIGURE 169 ITALY MARKET SHARE ANALYSIS BY END USER (2024)
FIGURE 170 BRAZIL MARKET SHARE ANALYSIS BY TYPE (2024)
FIGURE 171 BRAZIL MARKET SHARE ANALYSIS BY END USER (2024)
FIGURE 172 ARGENTINA MARKET SHARE ANALYSIS BY TYPE (2024)
FIGURE 173 ARGENTINA MARKET SHARE ANALYSIS BY END USER (2024)
FIGURE 174 COLUMBIA MARKET SHARE ANALYSIS BY TYPE (2024)
FIGURE 175 COLUMBIA MARKET SHARE ANALYSIS BY END USER (2024)
FIGURE 176 GLOBAL FINANCIAL MANAGEMENT SOFTWARE CURRENT AND FUTURE MARKET KEY COUNTRY LEVEL ANALYSIS, 2024–2034, (USD MILLION)
FIGURE 177 FINANCIAL OVERVIEW:
Key Player Analysis
Toray Industries Inc: Toray acts as a niche participant in the financial management software market through its digital solutions unit, which supports enterprise data systems across manufacturing and supply chain finance. The company extends its reach in 2025 by partnering with regional ERP providers in Japan and Southeast Asia to integrate financial planning modules into its broader industrial software stack. Toray focuses on clients that want financial tools tied directly to production, inventory, and procurement workflows. This approach helps the firm secure adoption across manufacturing groups that prefer a single vendor for operational and financial data. Toray’s strength lies in domain expertise from its core industrial base and its ability to link financial modules with real-time factory data.
Cytec Industries: Cytec positions itself as a challenger with targeted solutions for cost accounting and financial controls embedded in its enterprise platforms for chemical and materials businesses. In 2025, the firm expands its analytics capability to support margin modeling and risk scoring across multi-site operations. Cytec invests in partnerships with cloud service providers to bring these tools to mid-market firms that want integrated financial dashboards without large internal IT teams. The company differentiates through its sector-specific templates and compliance support for highly regulated industries. This helps Cytec maintain stable adoption among firms that require granular cost tracking tied to production inputs and logistics.
SGL Group: SGL Group operates as a niche player that uses financial management tools to strengthen its digital services portfolio for advanced materials clients. In 2025, SGL introduces financial modules that model project cost structures, asset lifecycles, and capital planning for long-lead industrial programs. These additions support customers in aerospace, energy, and marine sectors that need predictable cost visibility across multi-year contracts. SGL enhances integration with leading ERP suites and invests in AI-supported forecasting for contract manufacturing environments. Its differentiation centers on deep industry alignment and financial tools designed for complex, engineering-driven supply chains, giving the company a stable position among technical enterprises seeking tailored financial systems.
Key Market Players
Microsoft Corporation
Infor Inc.
SAS
SAP SE
Intuit Inc.
Workday Inc.
Sage Group plc
Intacct
Xero Limited
IBM Corporation
Oracle Corporation
Other Key Players
Driver
Automation-Driven Transformation of Financial Operations
By 2025, automation is changing financial operations. Organizations are replacing manual workflows with integrated financial management platforms. Solutions that bring together accounting, reporting, forecasting, and compliance are becoming essential to enterprise finance strategies. Artificial intelligence and machine learning are speeding up this change. They enable real-time transaction processing, automated reconciliations, and ongoing monitoring of financial performance. These features cut down on human error, shorten financial closing cycles, and improve decision-making accuracy. This trend drives ongoing demand for better financial management software.
AI-Led Efficiency and Risk Reduction
Global investment in AI for financial services now exceeds USD 35 billion. This investment keeps pushing innovation across software platforms. Predictive cash-flow modeling, anomaly detection, and automated controls are enhancing risk management and regulatory compliance. As transaction volumes rise and financial environments get more complex, businesses are increasingly depending on software that can centralize data and provide actionable insights at scale. Vendors with strong automation and AI features enjoy higher customer retention and more enterprise adoption.
Restraint
High Deployment and Customization Costs
High implementation costs remain a major barrier, especially for small and mid-sized organizations. Although cloud-based models lower initial licensing costs, total deployment costs often rise because of system customization, data migration, and integration with current ERP and CRM platforms. These issues can increase project budgets by 15 to 25%, creating financial obstacles for firms with limited capital options and delaying their purchasing decisions.
Organizational Change and Training Challenges
Beyond financial costs, adoption is slowed by the need to train the workforce and redesign processes. Advanced financial management systems require new workflows, stricter internal controls, and greater financial literacy among teams. Organizations without dedicated IT or finance transformation staff face longer implementation times and lower usage rates. Consequently, cost sensitivity shapes buying habits and increases demand for modular deployments and flexible subscription pricing.
Opportunity
Rapid Digitalization in Emerging Economies
Emerging markets offer a significant growth opportunity as businesses in Asia Pacific, the Middle East, and Latin America speed up digital transformation. Expanding cross-border trade, startup ecosystems, and regulatory oversight are driving firms toward organized financial systems. Cloud-based financial management software lowers entry barriers by providing flexible pricing and quick deployment, making advanced tools accessible to a wider audience.
Localization and Regulatory Alignment as Growth Catalysts
Market growth in these regions is expected to surpass global averages through 2030. Government initiatives are promoting transparency, tax compliance, and digital accounting. Vendors that customize solutions to fit country-specific regulations, reporting standards, and language needs are in a strong position to meet this demand. Partnerships with regional integrators will further improve market access and long-term customer growth.
Trend
Advanced Analytics as a Competitive Differentiator
By 2025, advanced analytics has become a key differentiator among financial management platforms. Organizations are increasingly investing in tools for scenario modeling, automated variance analysis, and complete data visibility. These features allow for quicker strategic planning and enhance confidence in financial reporting, especially for large enterprises operating in multiple locations.
AI-Driven Forecasting and Platform Consolidation
Forecasting practices are changing as AI-assisted models take the place of manual, bottom-up budgeting. Technologies like graph analytics and blockchain are being adopted to improve audit trails and data integrity. By the middle of the decade, close to 70% of large institutions plan to use these technologies in their financial systems. This change is prompting vendor consolidation, as buyers prefer platforms that combine strong analytical features with secure, scalable integration capabilities.
Recent Developments
Dec 2024 – Intuit: Announced QuickBooks integration with Amazon Seller Central to make QuickBooks the preferred financial management partner for Amazon sellers; the move links seller transactions directly into accounting workflows. This expands Intuit’s addressable SMB base and strengthens distribution for QuickBooks across the eCommerce channel.
Feb 2025 – Workday: Announced a workforce reduction of about 1,750 roles, or roughly 8.5 percent of headcount, to reallocate resources toward AI and product engineering; the restructuring carries charges estimated between USD 230 million and USD 270 million. This concentrates investment in AI capabilities while trimming operating expense, positioning Workday to accelerate machine-learning features in its finance suite.
Apr 2025 – Oracle: Rolled out its April 2025 Cloud Financials update, including enhancements to financial consolidation and close processes and scheduled deployment windows for test and production environments in April. These incremental updates reduce manual close steps and improve automation for enterprise clients that run Oracle Fusion EPM and ERP.
Jul 2025 – Intuit: Launched agentic AI capabilities and new financial management functions for its enterprise portfolio, adding automated workflows and AI-driven forecasting aimed at mid-market customers. This accelerates product differentiation and raises retention potential among growing businesses that require autonomous decision support within accounting workflows.
Sep 2025 – Workday: Received a USD 2 billion equity stake endorsement from activist investor Elliott Management, which publicly supported existing leadership and strategic direction; the development followed earlier cost-focused restructuring and increased AI investment. This vote of confidence strengthens Workday’s capital position and supports larger strategic moves such as acquisitions and accelerated R&D in finance automation.