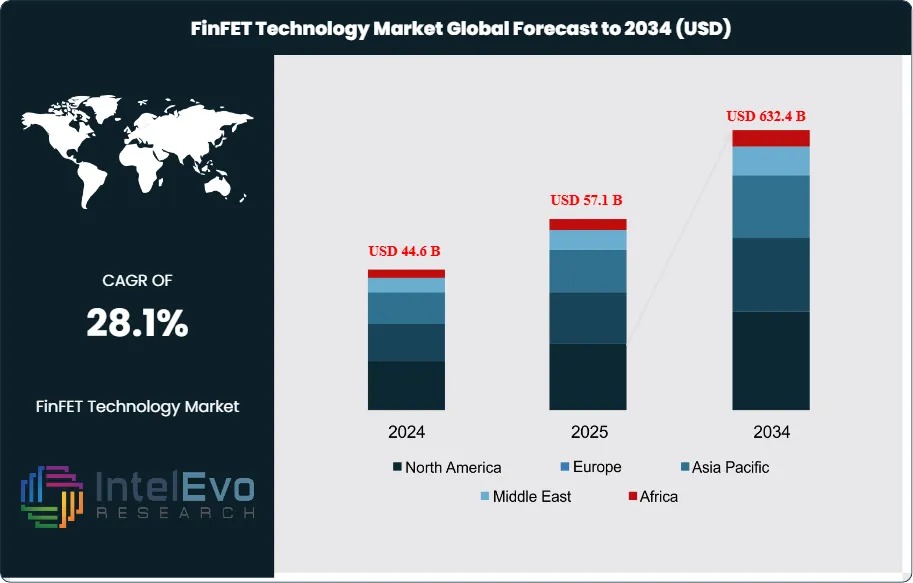
The FinFET Technology market is valued at USD 44.6 billion in 2024 and is projected to reach approximately USD 632.4 billion by 2034, reflecting a powerful CAGR of about 28.1% during 2025–2034. Demand is accelerating as FinFET architectures become the backbone of high-performance computing, 5G infrastructure, AI processors, and advanced automotive electronics. As semiconductor nodes scale toward 3nm and beyond, FinFET continues to dominate due to its superior power efficiency, switching speed, and leakage control. With chipmakers investing aggressively in next-generation foundry expansions and design innovation, FinFET remains central to the global semiconductor roadmap.
FinFET, or Fin Field Effect Transistor, has reshaped semiconductor architecture with its three-dimensional design, enabling higher current density, faster switching speeds, and significantly reduced leakage compared to traditional planar transistors. This structural advantage has made FinFET a critical technology in advanced chip manufacturing, particularly at nodes below 7 nm, where power efficiency and thermal performance are increasingly decisive.
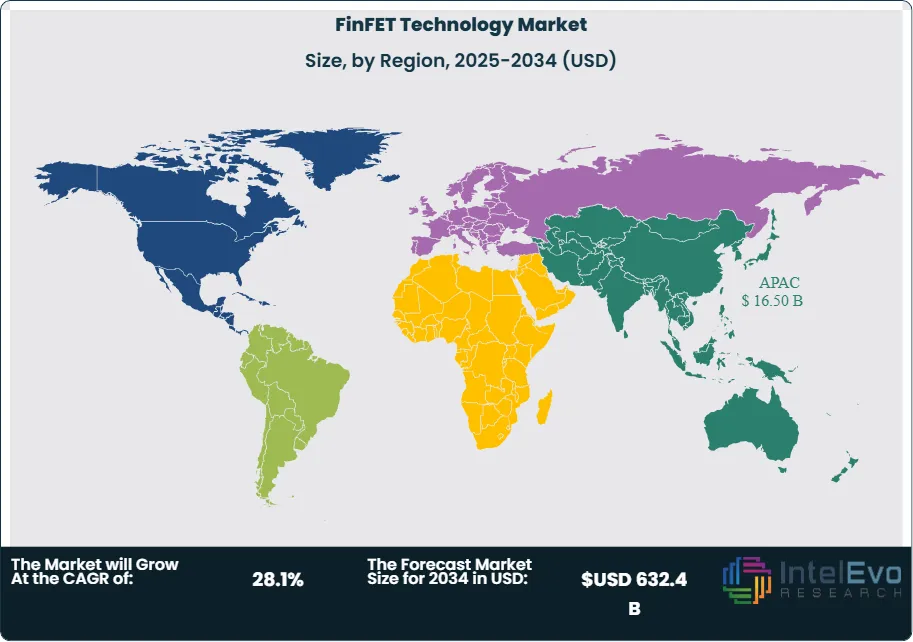
In 2023, the Asia-Pacific region led global FinFET market revenue, generating approximately USD 13.4 billion and accounting for over 37% of total market share. Growth in the region is anchored by strong demand from foundries and integrated device manufacturers (IDMs) in China, Taiwan, and South Korea, supported by dense manufacturing ecosystems and robust capital investment.
On the demand side, smartphone manufacturers and hyperscale data center operators remain key adopters of FinFET technology. Rising requirements for AI workloads, advanced gaming, and high-frequency trading have driven increased investment in FinFET-based processors. As a result, FinFET-enabled chips now power more than 80% of flagship mobile devices, reflecting rapid design wins among top-tier original equipment manufacturers (OEMs).
From a supply perspective, leading fabrication facilities are expanding FinFET production using extreme ultraviolet (EUV) lithography and advanced packaging techniques to meet accelerating demand. However, the capital-intensive nature of FinFET manufacturing continues to pose challenges. Equipment costs increased by 14% year-over-year in 2024, while delivery delays have introduced additional risks to fab expansion timelines.
The transition to smaller process nodes has also increased design complexity and extended time-to-market. To address these constraints, semiconductor firms are increasingly deploying AI-assisted electronic design automation (EDA) tools and digital twins to enhance yield predictability and accelerate validation cycles, improving overall operational efficiency.
Regulatory pressures remain a persistent concern, particularly in cross-border technology trade between the United States and China, which continues to affect supply chain resilience and export strategies. Despite these headwinds, research and development investment remains robust. In 2025, aggregate R&D spending by the top five FinFET IP providers exceeded USD 6.3 billion, with a strong focus on process optimization, thermal efficiency, and defect reduction.
Europe and North America are expanding their involvement through national semiconductor strategies and incentives, aiming to strengthen domestic capabilities. Nevertheless, the Asia-Pacific region continues to dominate as the primary manufacturing hub, benefiting from integrated production capacity, established supply chains, and a deep talent pool.
Looking ahead, sustained demand from high-performance computing, automotive AI, and 5G infrastructure is expected to reinforce the importance of FinFET technology. As a result, FinFET is set to remain a foundational element of the global semiconductor roadmap well into the next decade.
Key Takeaways
Market Growth: The global FinFET Technology market was valued at USD 44.6 billion in 2024 and is projected to reach USD 632.4 billion by 2034, registering a strong CAGR of 28.1% from 2025 to 2034. Growth is driven by demand for energy-efficient, high-performance processors in consumer electronics, data centers, and AI workloads.
Technology Node:10nm technology led the FinFET market in 2023, accounting for over 25% of global revenue. Its balance between power efficiency and manufacturing scalability makes it a preferred node for premium smartphones and advanced SoCs.
Application:Consumer electronics held a dominant 52% share in 2023, fueled by widespread adoption of FinFET chips in flagship smartphones, gaming consoles, and personal computing devices. Major OEMs rely on FinFET-based processors to support intensive workloads and extended battery life.
Driver: Rising demand for AI-capable processors and edge computing devices is accelerating FinFET adoption. Over 80% of premium smartphones released in 2025 now use FinFET-based chipsets, reflecting the technology’s relevance in high-performance mobile computing.
Restraint: High capital expenditure and process complexity remain key constraints. In 2025, average equipment costs for FinFET-capable fabs increased by 14%, adding pressure to profit margins and limiting entry for smaller foundries.
Opportunity: The medical device and automotive AI sectors present untapped opportunities for FinFET growth. Automotive-grade FinFET chips are expected to grow at a CAGR above 30% through 2030, driven by ADAS and real-time data processing needs.
Trend: Foundries are integrating EUV lithography and AI-assisted design tools to streamline FinFET production. In 2025, leading chipmakers reported a 22% reduction in design-to-tapeout cycle time using AI-enhanced EDA workflows.
Regional Analysis:Asia-Pacific led the global market in 2023 with a 37% revenue share, supported by foundry capacity in China, Taiwan, and South Korea. While North America and Europe are scaling production via national semiconductor strategies, APAC remains the hub for advanced node manufacturing.
Technology Analysis
As of 2025, 10nm FinFET technology holds a central role in global semiconductor production, accounting for over 25% of total FinFET market revenue. Its position reflects both technical maturity and commercial scalability. The 10nm process node offers a balance between energy efficiency, performance, and manufacturing cost, making it well-suited for mainstream adoption in high-performance computing, smartphones, and edge AI devices. While more advanced nodes such as 7nm and 5nm are gaining traction, they remain cost-intensive and technically complex for mass deployment outside tier-one fabs.
The 10nm node continues to serve as a stable workhorse across multiple product categories, particularly where OEMs require reliable yields and volume production. Its transistor density supports dense logic integration without significantly compromising power consumption, which is critical for mobile applications and portable consumer electronics. Additionally, for chipmakers managing cost-performance trade-offs, 10nm remains a strategic midpoint. As design complexity increases at smaller geometries, 10nm FinFET maintains relevance by offering predictable manufacturing outcomes and faster time-to-market, especially for mid-to-high-end processors and system-on-chip platforms.
End-User Industry Analysis
In 2025, consumer electronics continues to lead FinFET technology adoption, contributing more than 52% of total end-user demand. This dominance stems from the integration of FinFET-based processors in smartphones, tablets, wearables, and portable computing devices. The need for high-speed processing, improved thermal control, and extended battery life makes FinFET the preferred architecture among OEMs aiming to deliver feature-rich, energy-efficient products. Flagship smartphones launched this year from leading brands rely almost exclusively on FinFET nodes below 10nm for application processors and AI accelerators.
Beyond mobile, the expansion of connected devices and IoT ecosystems is amplifying the role of FinFET in smart wearables, home automation systems, and embedded electronics. These devices require compact, power-efficient chips capable of continuous operation without thermal throttling or excessive drain on limited power sources. In parallel, consumer demand for AI-supported features such as voice recognition, facial authentication, and intelligent image processing is increasing the computational workload on edge devices, further reinforcing FinFET’s utility. As OEMs compete on performance-per-watt metrics, FinFET’s ability to combine speed with power efficiency secures its position in the segment. Looking ahead, as 5G-enabled devices and AI-native form factors become standard, FinFET technology will remain integral to product innovation in the consumer space.
By Technology (10nm, 22nm, 20nm, 16nm, 14nm, 7nm, 5nm and Below), By End-User Industry (Consumer Electronics, Automotive, Healthcare, Industrial, Other End-Users)
Research Methodology
Primary Research- 100 Interviews of Stakeholders
Secondary Research
Desk Research
Regional scope
North America (United States, Canada, Mexico)
Latin America (Brazil, Argentina, Columbia)
East Asia And Pacific (China, Japan, South Korea, Australia, Cambodia, Fiji, Indonesia)
Sea And South Asia (India, Singapore, Thailand, Taiwan, Malaysia)
Eastern Europe (Poland, Russia, Czech Republic, Romania)
Western Europe (Germany, U.K., France, Spain, Itlay)
Middle East & Africa (GCC Countries, Egypt, Nigeria, South Africa, Israel)
Competitive Landscape
TOSHIBA CORPORATION, Intel Corporation, Renesas Electronics Corporation, Samsung Electronics, Xilinx Inc., United Microelectronics Corporation, Infineon Technologies AG, Qualcomm Technologies, Inc., Texas Instruments Incorporated, Robert Bosch GmbH, Semiconductor Manufacturing International Corp, GlobalFoundries Inc., Taiwan Semiconductor Manufacturing Company Limited, Others
Customization Scope
Customization for segments, region/country-level will be provided. Moreover, additional customization can be done based on the requirements.
Pricing and Purchase Options
Avail customized purchase options to meet your exact research needs. We have three licenses to opt for: Single User License, Multi-User License (Up to 5 Users), Corporate Use License (Unlimited User and Printable PDF).
TABLE OF CONTENTS
1. EXECUTIVE SUMMARY
1.1. MARKET SNAPSHOT
1.2. KEY FINDINGS & INSIGHTS
1.3. ANALYST RECOMMENDATIONS
1.4. FUTURE OUTLOOK
2. RESEARCH METHODOLOGY
2.1. MARKET DEFINITION & SCOPE
2.2. RESEARCH OBJECTIVES: PRIMARY & SECONDARY DATA SOURCES
2.3. DATA COLLECTION SOURCES
2.3.1. COVERAGE OF 100+ PRIMARY RESEARCH/CONSULTATION CALLS WITH INDUSTRY STAKEHOLDERS
FIGURE 17 NORTH AMERICA FINFET TECHNOLOGY CURRENT AND FUTURE TYPE ANALYSIS, 2025–2034, (USD MILLION)
FIGURE 18 NORTH AMERICA FINFET TECHNOLOGY CURRENT AND FUTURE END USER ANALYSIS, 2025–2034, (USD MILLION)
FIGURE 19 MARKET SHARE BY COUNTRY
FIGURE 20 LATIN AMERICA FINFET TECHNOLOGY CURRENT AND FUTURE TYPE ANALYSIS, 2025–2034, (USD MILLION)
FIGURE 21 LATIN AMERICA FINFET TECHNOLOGY CURRENT AND FUTURE END USER ANALYSIS, 2025–2034, (USD MILLION)
FIGURE 22 MARKET SHARE BY COUNTRY
FIGURE 23 EASTERN EUROPE FINFET TECHNOLOGY CURRENT AND FUTURE TYPE ANALYSIS, 2025–2034, (USD MILLION)
FIGURE 24 EASTERN EUROPE FINFET TECHNOLOGY CURRENT AND FUTURE END USER ANALYSIS, 2025–2034, (USD MILLION)
FIGURE 25 MARKET SHARE BY COUNTRY
FIGURE 26 WESTERN EUROPE FINFET TECHNOLOGY CURRENT AND FUTURE TYPE ANALYSIS, 2025–2034, (USD MILLION)
FIGURE 27 WESTERN EUROPE FINFET TECHNOLOGY CURRENT AND FUTURE END USER ANALYSIS, 2025–2034, (USD MILLION)
FIGURE 28 MARKET SHARE BY COUNTRY
FIGURE 29 EAST ASIA AND PACIFIC FINFET TECHNOLOGY CURRENT AND FUTURE TYPE ANALYSIS, 2025–2034, (USD MILLION)
FIGURE 30 EAST ASIA AND PACIFIC FINFET TECHNOLOGY CURRENT AND FUTURE END USER ANALYSIS, 2025–2034, (USD MILLION)
FIGURE 31 MARKET SHARE BY COUNTRY
FIGURE 32 SEA AND SOUTH ASIA FINFET TECHNOLOGY CURRENT AND FUTURE TYPE ANALYSIS, 2025–2034, (USD MILLION)
FIGURE 33 SEA AND SOUTH ASIA FINFET TECHNOLOGY CURRENT AND FUTURE END USER ANALYSIS, 2025–2034, (USD MILLION)
FIGURE 34 MARKET SHARE BY COUNTRY
FIGURE 35 MIDDLE EAST AND AFRICA FINFET TECHNOLOGY CURRENT AND FUTURE TYPE ANALYSIS, 2025–2034, (USD MILLION)
FIGURE 36 MIDDLE EAST AND AFRICA FINFET TECHNOLOGY CURRENT AND FUTURE END USER ANALYSIS, 2025–2034, (USD MILLION)
FIGURE 37 NORTH AMERICA FINFET TECHNOLOGY CURRENT AND FUTURE MARKET VOLUME SHARE REGIONAL ANALYSIS, 2025–2034, (USD MILLION)
FIGURE 38 U.S. FINFET TECHNOLOGY CURRENT AND FUTURE TYPE ANALYSIS, 2025–2034, (USD MILLION)
FIGURE 39 U.S. FINFET TECHNOLOGY CURRENT AND FUTURE END USER ANALYSIS, 2025–2034, (USD MILLION)
FIGURE 40 CANADA FINFET TECHNOLOGY CURRENT AND FUTURE TYPE ANALYSIS, 2025–2034, (USD MILLION)
FIGURE 41 CANADA FINFET TECHNOLOGY CURRENT AND FUTURE END USER ANALYSIS, 2025–2034, (USD MILLION)
FIGURE 42 LATIN AMERICA FINFET TECHNOLOGY CURRENT AND FUTURE MARKET VOLUME SHARE REGIONAL ANALYSIS, 2025–2034, (USD MILLION)
FIGURE 43 MEXICO FINFET TECHNOLOGY CURRENT AND FUTURE TYPE ANALYSIS, 2025–2034, (USD MILLION)
FIGURE 44 MEXICO FINFET TECHNOLOGY CURRENT AND FUTURE END USER ANALYSIS, 2025–2034, (USD MILLION)
FIGURE 45 BRAZIL FINFET TECHNOLOGY CURRENT AND FUTURE TYPE ANALYSIS, 2025–2034, (USD MILLION)
FIGURE 46 BRAZIL FINFET TECHNOLOGY CURRENT AND FUTURE END USER ANALYSIS, 2025–2034, (USD MILLION)
FIGURE 47 ARGENTINA FINFET TECHNOLOGY CURRENT AND FUTURE TYPE ANALYSIS, 2025–2034, (USD MILLION)
FIGURE 48 ARGENTINA FINFET TECHNOLOGY CURRENT AND FUTURE END USER ANALYSIS, 2025–2034, (USD MILLION)
FIGURE 49 COLUMBIA FINFET TECHNOLOGY CURRENT AND FUTURE TYPE ANALYSIS, 2025–2034, (USD MILLION)
FIGURE 50 COLUMBIA FINFET TECHNOLOGY CURRENT AND FUTURE END USER ANALYSIS, 2025–2034, (USD MILLION)
FIGURE 51 REST OF LATIN AMERICA FINFET TECHNOLOGY CURRENT AND FUTURE TYPE ANALYSIS, 2025–2034, (USD MILLION)
FIGURE 52 REST OF LATIN AMERICA FINFET TECHNOLOGY CURRENT AND FUTURE END USER ANALYSIS, 2025–2034, (USD MILLION)
FIGURE 53 EASTERN EUROPE FINFET TECHNOLOGY CURRENT AND FUTURE MARKET VOLUME SHARE REGIONAL ANALYSIS, 2025–2034, (USD MILLION)
FIGURE 54 POLAND FINFET TECHNOLOGY CURRENT AND FUTURE TYPE ANALYSIS, 2025–2034, (USD MILLION)
FIGURE 55 POLAND FINFET TECHNOLOGY CURRENT AND FUTURE END USER ANALYSIS, 2025–2034, (USD MILLION)
FIGURE 56 RUSSIA FINFET TECHNOLOGY CURRENT AND FUTURE TYPE ANALYSIS, 2025–2034, (USD MILLION)
FIGURE 57 RUSSIA FINFET TECHNOLOGY CURRENT AND FUTURE END USER ANALYSIS, 2025–2034, (USD MILLION)
FIGURE 58 CZECH REPUBLIC FINFET TECHNOLOGY CURRENT AND FUTURE TYPE ANALYSIS, 2025–2034, (USD MILLION)
FIGURE 59 CZECH REPUBLIC FINFET TECHNOLOGY CURRENT AND FUTURE END USER ANALYSIS, 2025–2034, (USD MILLION)
FIGURE 60 ROMANIA FINFET TECHNOLOGY CURRENT AND FUTURE TYPE ANALYSIS, 2025–2034, (USD MILLION)
FIGURE 61 ROMANIA FINFET TECHNOLOGY CURRENT AND FUTURE END USER ANALYSIS, 2025–2034, (USD MILLION)
FIGURE 62 REST OF EASTERN EUROPE FINFET TECHNOLOGY CURRENT AND FUTURE TYPE ANALYSIS, 2025–2034, (USD MILLION)
FIGURE 63 REST OF EASTERN EUROPE FINFET TECHNOLOGY CURRENT AND FUTURE END USER ANALYSIS, 2025–2034, (USD MILLION)
FIGURE 64 WESTERN EUROPE FINFET TECHNOLOGY CURRENT AND FUTURE MARKET VOLUME SHARE REGIONAL ANALYSIS, 2025–2034, (USD MILLION)
FIGURE 65 GERMANY FINFET TECHNOLOGY CURRENT AND FUTURE TYPE ANALYSIS, 2025–2034, (USD MILLION)
FIGURE 66 GERMANY FINFET TECHNOLOGY CURRENT AND FUTURE END USER ANALYSIS, 2025–2034, (USD MILLION)
FIGURE 67 FRANCE FINFET TECHNOLOGY CURRENT AND FUTURE TYPE ANALYSIS, 2025–2034, (USD MILLION)
FIGURE 68 FRANCE FINFET TECHNOLOGY CURRENT AND FUTURE END USER ANALYSIS, 2025–2034, (USD MILLION)
FIGURE 69 UK FINFET TECHNOLOGY CURRENT AND FUTURE TYPE ANALYSIS, 2025–2034, (USD MILLION)
FIGURE 70 UK FINFET TECHNOLOGY CURRENT AND FUTURE END USER ANALYSIS, 2025–2034, (USD MILLION)
FIGURE 71 SPAIN FINFET TECHNOLOGY CURRENT AND FUTURE TYPE ANALYSIS, 2025–2034, (USD MILLION)
FIGURE 72 SPAIN FINFET TECHNOLOGY CURRENT AND FUTURE END USER ANALYSIS, 2025–2034, (USD MILLION)
FIGURE 73 ITALY FINFET TECHNOLOGY CURRENT AND FUTURE TYPE ANALYSIS, 2025–2034, (USD MILLION)
FIGURE 74 ITALY FINFET TECHNOLOGY CURRENT AND FUTURE END USER ANALYSIS, 2025–2034, (USD MILLION)
FIGURE 75 REST OF WESTERN EUROPE FINFET TECHNOLOGY CURRENT AND FUTURE TYPE ANALYSIS, 2025–2034, (USD MILLION)
FIGURE 76 REST OF WESTERN EUROPE FINFET TECHNOLOGY CURRENT AND FUTURE END USER ANALYSIS, 2025–2034, (USD MILLION)
FIGURE 77 EAST ASIA AND PACIFIC FINFET TECHNOLOGY CURRENT AND FUTURE MARKET VOLUME SHARE REGIONAL ANALYSIS, 2025–2034, (USD MILLION)
FIGURE 78 CHINA FINFET TECHNOLOGY CURRENT AND FUTURE TYPE ANALYSIS, 2025–2034, (USD MILLION)
FIGURE 79 CHINA FINFET TECHNOLOGY CURRENT AND FUTURE END USER ANALYSIS, 2025–2034, (USD MILLION)
FIGURE 80 JAPAN FINFET TECHNOLOGY CURRENT AND FUTURE TYPE ANALYSIS, 2025–2034, (USD MILLION)
FIGURE 81 JAPAN FINFET TECHNOLOGY CURRENT AND FUTURE END USER ANALYSIS, 2025–2034, (USD MILLION)
FIGURE 82 AUSTRALIA FINFET TECHNOLOGY CURRENT AND FUTURE TYPE ANALYSIS, 2025–2034, (USD MILLION)
FIGURE 83 AUSTRALIA FINFET TECHNOLOGY CURRENT AND FUTURE END USER ANALYSIS, 2025–2034, (USD MILLION)
FIGURE 84 CAMBODIA FINFET TECHNOLOGY CURRENT AND FUTURE TYPE ANALYSIS, 2025–2034, (USD MILLION)
FIGURE 85 CAMBODIA FINFET TECHNOLOGY CURRENT AND FUTURE END USER ANALYSIS, 2025–2034, (USD MILLION)
FIGURE 86 FIJI FINFET TECHNOLOGY CURRENT AND FUTURE TYPE ANALYSIS, 2025–2034, (USD MILLION)
FIGURE 87 FIJI FINFET TECHNOLOGY CURRENT AND FUTURE END USER ANALYSIS, 2025–2034, (USD MILLION)
FIGURE 88 INDONESIA FINFET TECHNOLOGY CURRENT AND FUTURE TYPE ANALYSIS, 2025–2034, (USD MILLION)
FIGURE 89 INDONESIA FINFET TECHNOLOGY CURRENT AND FUTURE END USER ANALYSIS, 2025–2034, (USD MILLION)
FIGURE 90 SOUTH KOREA FINFET TECHNOLOGY CURRENT AND FUTURE TYPE ANALYSIS, 2025–2034, (USD MILLION)
FIGURE 91 SOUTH KOREA FINFET TECHNOLOGY CURRENT AND FUTURE END USER ANALYSIS, 2025–2034, (USD MILLION)
FIGURE 92 REST OF EAST ASIA AND PACIFIC FINFET TECHNOLOGY CURRENT AND FUTURE TYPE ANALYSIS, 2025–2034, (USD MILLION)
FIGURE 93 REST OF EAST ASIA AND PACIFIC FINFET TECHNOLOGY CURRENT AND FUTURE END USER ANALYSIS, 2025–2034, (USD MILLION)
FIGURE 94 SEA AND SOUTH ASIA FINFET TECHNOLOGY CURRENT AND FUTURE MARKET VOLUME SHARE REGIONAL ANALYSIS, 2025–2034, (USD MILLION)
FIGURE 95 BANGLADESH FINFET TECHNOLOGY CURRENT AND FUTURE TYPE ANALYSIS, 2025–2034, (USD MILLION)
FIGURE 96 BANGLADESH FINFET TECHNOLOGY CURRENT AND FUTURE END USER ANALYSIS, 2025–2034, (USD MILLION)
FIGURE 97 NEW ZEALAND FINFET TECHNOLOGY CURRENT AND FUTURE TYPE ANALYSIS, 2025–2034, (USD MILLION)
FIGURE 98 NEW ZEALAND FINFET TECHNOLOGY CURRENT AND FUTURE END USER ANALYSIS, 2025–2034, (USD MILLION)
FIGURE 99 INDIA FINFET TECHNOLOGY CURRENT AND FUTURE TYPE ANALYSIS, 2025–2034, (USD MILLION)
FIGURE 100 INDIA FINFET TECHNOLOGY CURRENT AND FUTURE END USER ANALYSIS, 2025–2034, (USD MILLION)
FIGURE 101 SINGAPORE FINFET TECHNOLOGY CURRENT AND FUTURE TYPE ANALYSIS, 2025–2034, (USD MILLION)
FIGURE 102 SINGAPORE FINFET TECHNOLOGY CURRENT AND FUTURE END USER ANALYSIS, 2025–2034, (USD MILLION)
FIGURE 103 THAILAND FINFET TECHNOLOGY CURRENT AND FUTURE TYPE ANALYSIS, 2025–2034, (USD MILLION)
FIGURE 104 THAILAND FINFET TECHNOLOGY CURRENT AND FUTURE END USER ANALYSIS, 2025–2034, (USD MILLION)
FIGURE 105 TAIWAN FINFET TECHNOLOGY CURRENT AND FUTURE TYPE ANALYSIS, 2025–2034, (USD MILLION)
FIGURE 106 TAIWAN FINFET TECHNOLOGY CURRENT AND FUTURE END USER ANALYSIS, 2025–2034, (USD MILLION)
FIGURE 107 MALAYSIA FINFET TECHNOLOGY CURRENT AND FUTURE TYPE ANALYSIS, 2025–2034, (USD MILLION)
FIGURE 108 MALAYSIA FINFET TECHNOLOGY CURRENT AND FUTURE END USER ANALYSIS, 2025–2034, (USD MILLION)
FIGURE 109 REST OF SEA AND SOUTH ASIA FINFET TECHNOLOGY CURRENT AND FUTURE TYPE ANALYSIS, 2025–2034, (USD MILLION)
FIGURE 110 REST OF SEA AND SOUTH ASIA FINFET TECHNOLOGY CURRENT AND FUTURE END USER ANALYSIS, 2025–2034, (USD MILLION)
FIGURE 111 MIDDLE EAST AND AFRICA FINFET TECHNOLOGY CURRENT AND FUTURE MARKET VOLUME SHARE REGIONAL ANALYSIS, 2025–2034, (USD MILLION)
FIGURE 112 GCC COUNTRIES FINFET TECHNOLOGY CURRENT AND FUTURE TYPE ANALYSIS, 2025–2034, (USD MILLION)
FIGURE 113 GCC COUNTRIES FINFET TECHNOLOGY CURRENT AND FUTURE END USER ANALYSIS, 2025–2034, (USD MILLION)
FIGURE 114 SAUDI ARABIA FINFET TECHNOLOGY CURRENT AND FUTURE TYPE ANALYSIS, 2025–2034, (USD MILLION)
FIGURE 115 SAUDI ARABIA FINFET TECHNOLOGY CURRENT AND FUTURE END USER ANALYSIS, 2025–2034, (USD MILLION)
FIGURE 116 UAE FINFET TECHNOLOGY CURRENT AND FUTURE TYPE ANALYSIS, 2025–2034, (USD MILLION)
FIGURE 117 UAE FINFET TECHNOLOGY CURRENT AND FUTURE END USER ANALYSIS, 2025–2034, (USD MILLION)
FIGURE 118 BAHRAIN FINFET TECHNOLOGY CURRENT AND FUTURE TYPE ANALYSIS, 2025–2034, (USD MILLION)
FIGURE 119 BAHRAIN FINFET TECHNOLOGY CURRENT AND FUTURE END USER ANALYSIS, 2025–2034, (USD MILLION)
FIGURE 120 KUWAIT FINFET TECHNOLOGY CURRENT AND FUTURE TYPE ANALYSIS, 2025–2034, (USD MILLION)
FIGURE 121 KUWAIT FINFET TECHNOLOGY CURRENT AND FUTURE END USER ANALYSIS, 2025–2034, (USD MILLION)
FIGURE 122 OMAN FINFET TECHNOLOGY CURRENT AND FUTURE TYPE ANALYSIS, 2025–2034, (USD MILLION)
FIGURE 123 OMAN FINFET TECHNOLOGY CURRENT AND FUTURE END USER ANALYSIS, 2025–2034, (USD MILLION)
FIGURE 124 QATAR FINFET TECHNOLOGY CURRENT AND FUTURE TYPE ANALYSIS, 2025–2034, (USD MILLION)
FIGURE 125 QATAR FINFET TECHNOLOGY CURRENT AND FUTURE END USER ANALYSIS, 2025–2034, (USD MILLION)
FIGURE 126 EGYPT FINFET TECHNOLOGY CURRENT AND FUTURE TYPE ANALYSIS, 2025–2034, (USD MILLION)
FIGURE 127 EGYPT FINFET TECHNOLOGY CURRENT AND FUTURE END USER ANALYSIS, 2025–2034, (USD MILLION)
FIGURE 128 NIGERIA FINFET TECHNOLOGY CURRENT AND FUTURE TYPE ANALYSIS, 2025–2034, (USD MILLION)
FIGURE 129 NIGERIA FINFET TECHNOLOGY CURRENT AND FUTURE END USER ANALYSIS, 2025–2034, (USD MILLION)
FIGURE 130 SOUTH AFRICA FINFET TECHNOLOGY CURRENT AND FUTURE TYPE ANALYSIS, 2025–2034, (USD MILLION)
FIGURE 131 SOUTH AFRICA FINFET TECHNOLOGY CURRENT AND FUTURE END USER ANALYSIS, 2025–2034, (USD MILLION)
FIGURE 132 ISRAEL FINFET TECHNOLOGY CURRENT AND FUTURE TYPE ANALYSIS, 2025–2034, (USD MILLION)
FIGURE 133 ISRAEL FINFET TECHNOLOGY CURRENT AND FUTURE END USER ANALYSIS, 2025–2034, (USD MILLION)
FIGURE 134 REST OF MEA FINFET TECHNOLOGY CURRENT AND FUTURE TYPE ANALYSIS, 2025–2034, (USD MILLION)
FIGURE 135 REST OF MEA FINFET TECHNOLOGY CURRENT AND FUTURE END USER ANALYSIS, 2025–2034, (USD MILLION)
FIGURE 136 U. S. MARKET SHARE ANALYSIS BY TYPE (2024)
FIGURE 137 U. S. MARKET SHARE ANALYSIS BY END USER (2024)
FIGURE 138 CANADA MARKET SHARE ANALYSIS BY TYPE (2024)
FIGURE 139 CANADA MARKET SHARE ANALYSIS BY END USER (2024)
FIGURE 140 MEXICO MARKET SHARE ANALYSIS BY TYPE (2024)
FIGURE 141 MEXICO MARKET SHARE ANALYSIS BY END USER (2024)
FIGURE 142 CHINA MARKET SHARE ANALYSIS BY TYPE (2024)
FIGURE 143 CHINA MARKET SHARE ANALYSIS BY END USER (2024)
FIGURE 144 JAPAN MARKET SHARE ANALYSIS BY TYPE (2024)
FIGURE 145 JAPAN MARKET SHARE ANALYSIS BY END USER (2024)
FIGURE 146 INDIA MARKET SHARE ANALYSIS BY TYPE (2024)
FIGURE 147 INDIA MARKET SHARE ANALYSIS BY END USER (2024)
FIGURE 148 SOUTH KOREA MARKET SHARE ANALYSIS BY TYPE (2024)
FIGURE 149 SOUTH KOREA MARKET SHARE ANALYSIS BY END USER (2024)
FIGURE 150 SAUDI ARABIA MARKET SHARE ANALYSIS BY TYPE (2024)
FIGURE 151 SAUDI ARABIA MARKET SHARE ANALYSIS BY END USER (2024)
FIGURE 152 UAE MARKET SHARE ANALYSIS BY TYPE (2024)
FIGURE 153 UAE MARKET SHARE ANALYSIS BY END USER (2024)
FIGURE 154 EGYPT MARKET SHARE ANALYSIS BY TYPE (2024)
FIGURE 155 EGYPT MARKET SHARE ANALYSIS BY END USER (2024)
FIGURE 156 NIGERIA MARKET SHARE ANALYSIS BY TYPE (2024)
FIGURE 157 NIGERIA MARKET SHARE ANALYSIS BY END USER (2024)
FIGURE 158 SOUTH AFRICA MARKET SHARE ANALYSIS BY TYPE (2024)
FIGURE 159 SOUTH AFRICA MARKET SHARE ANALYSIS BY END USER (2024)
FIGURE 160 GERMANY MARKET SHARE ANALYSIS BY TYPE (2024)
FIGURE 161 GERMANY MARKET SHARE ANALYSIS BY END USER (2024)
FIGURE 162 FRANCE MARKET SHARE ANALYSIS BY TYPE (2024)
FIGURE 163 FRANCE MARKET SHARE ANALYSIS BY END USER (2024)
FIGURE 164 UK MARKET SHARE ANALYSIS BY TYPE (2024)
FIGURE 165 UK MARKET SHARE ANALYSIS BY END USER (2024)
FIGURE 166 SPAIN MARKET SHARE ANALYSIS BY TYPE (2024)
FIGURE 167 SPAIN MARKET SHARE ANALYSIS BY END USER (2024)
FIGURE 168 ITALY MARKET SHARE ANALYSIS BY TYPE (2024)
FIGURE 169 ITALY MARKET SHARE ANALYSIS BY END USER (2024)
FIGURE 170 BRAZIL MARKET SHARE ANALYSIS BY TYPE (2024)
FIGURE 171 BRAZIL MARKET SHARE ANALYSIS BY END USER (2024)
FIGURE 172 ARGENTINA MARKET SHARE ANALYSIS BY TYPE (2024)
FIGURE 173 ARGENTINA MARKET SHARE ANALYSIS BY END USER (2024)
FIGURE 174 COLUMBIA MARKET SHARE ANALYSIS BY TYPE (2024)
FIGURE 175 COLUMBIA MARKET SHARE ANALYSIS BY END USER (2024)
FIGURE 176 GLOBAL FINFET TECHNOLOGY CURRENT AND FUTURE MARKET KEY COUNTRY LEVEL ANALYSIS, 2024–2034, (USD MILLION)
FIGURE 177 FINANCIAL OVERVIEW:
Key Player Analysis
GlobalFoundries Inc.: GlobalFoundries positions itself as a key challenger in the FinFET technology market, focusing on mature and differentiated nodes rather than competing at the bleeding edge. Its 12nm FinFET platform is widely adopted across automotive, IoT, and industrial applications, offering a balance between performance and long-term supply reliability. In 2025, GlobalFoundries expanded its Malta, New York fab capacity by 14%, targeting secure supply for North American clients amid rising geopolitical tensions in Asia.
The company’s strength lies in offering long-term node availability and process stability, making it a preferred partner for OEMs with extended product life cycles. GlobalFoundries has also secured multi-year supply agreements with major U.S. defense and aerospace contractors, reflecting its positioning in secure and regulated markets. With a growing presence in Europe and sustained government-backed investments, the company is well-placed to capitalize on regional reshoring strategies in semiconductor manufacturing.
Taiwan Semiconductor Manufacturing Company Limited (TSMC): TSMC remains the undisputed market leader in FinFET technology, capturing the majority share of global production at advanced nodes including 7nm, 5nm, and now 3nm. As of 2025, over 70% of global smartphone processors using FinFET architecture are fabricated through TSMC. The company continues to attract top-tier clients such as Apple, AMD, and Nvidia, cementing its dominance in performance-driven applications including mobile SoCs, GPUs, and AI accelerators.
TSMC's differentiators include its production scale, advanced EUV capabilities, and high-yield process development. The firm invested over USD 32 billion in capex during 2024–2025, with key expansions in Taiwan, Japan, and the U.S. Through its N3 and N3E nodes, TSMC is also laying the groundwork for migration to GAAFET-based technologies, ensuring a smooth transition for clients. Its ability to deliver at volume while maintaining reliability and technology leadership continues to reinforce its competitive moat.
Semiconductor Manufacturing International Corp (SMIC): SMIC operates as a regional competitor with strategic relevance in China’s domestic semiconductor agenda. Despite export restrictions and limited access to leading-edge lithography, the company has made progress in commercializing FinFET nodes at 14nm and is reportedly scaling limited volumes at 7nm using multi-patterning techniques. In 2025, SMIC’s FinFET revenue grew by 9.3% year-over-year, driven by demand from local smartphone and industrial device makers.
SMIC benefits from strong state support and a captive domestic market, enabling it to sustain investment in R&D and fab expansion despite geopolitical headwinds. While it remains several nodes behind global leaders, SMIC plays a critical role in national supply chain resilience and self-sufficiency. Its progress in FinFET production highlights the strategic trade-offs between technology performance and regional independence in the global semiconductor industry.
Xilinx Inc. (a part of AMD): Xilinx, now fully integrated into AMD, operates as an innovator in FinFET-based programmable logic and adaptive computing. Its 7nm and 16nm FinFET product lines serve high-performance applications across data centers, aerospace, automotive, and telecom. In 2025, Xilinx-enabled platforms represented over 45% of FinFET-based FPGAs used in 5G infrastructure and AI edge deployments, reflecting strong traction in configurable processing.
The company differentiates through its platform-level solutions that combine FinFET efficiency with flexibility in workload acceleration. Under AMD, Xilinx continues to invest in software-hardware integration, reducing development time for customers and expanding use cases in low-latency, high-throughput environments. Its roadmap includes tighter integration with AMD’s CPU and GPU products, positioning it to benefit from convergence in high-performance heterogeneous computing systems.
Market Key Players
TOSHIBA CORPORATION
Intel Corporation
Renesas Electronics Corporation
Samsung Electronics
Xilinx Inc.
United Microelectronics Corporation
Infineon Technologies AG
Qualcomm Technologies, Inc.
Texas Instruments Incorporated
Robert Bosch GmbH
Semiconductor Manufacturing International Corp
GlobalFoundries Inc.
Taiwan Semiconductor Manufacturing Company Limited
Others
Driver:
Rising Demand for High-Performance Computing Accelerating FinFET Adoption
As of 2025, demand for high-performance computing (HPC) continues to accelerate, driven by sectors such as finance, pharmaceuticals, aerospace, and AI-led research. These industries rely on fast, energy-efficient processors to handle complex simulations, real-time analytics, and massive data workloads. FinFET technology, with its ability to reduce leakage and improve switching speed, supports the performance benchmarks required for compute-intensive applications.
FinFET Enabling Real-Time Analytics and AI-Driven Processing Workloads
Financial institutions, for example, are deploying FinFET-based chips to run latency-sensitive algorithms in high-frequency trading, enabling sub-millisecond decision-making. As AI workloads become more compute-heavy and real-time processing needs grow across edge and cloud infrastructures, FinFET remains a critical enabler. This sustained demand reinforces investment in FinFET-compatible fabs and long-term design pipelines.
Restraint:
High Capital Investment Limiting Entry into Advanced Node Manufacturing
Despite its performance advantages, FinFET adoption is hindered by high capital expenditure and operating costs. A single FinFET-capable fabrication facility requires an investment exceeding USD 15 billion, including EUV lithography equipment and process automation infrastructure. This creates a high barrier to entry, particularly for smaller foundries and regional players aiming to compete in advanced node manufacturing.
In addition, the design and validation cycle for FinFET-based chips is longer and more resource-intensive than planar technologies. Companies without scale or access to advanced EDA tools may struggle to remain cost-competitive. This concentration of capability among a few major players limits market diversity and slows broader adoption, especially in cost-sensitive or emerging markets.
Opportunity:
5G Expansion and IoT Proliferation Driving Demand for Efficient FinFET Chips
The expansion of 5G infrastructure and the surge in connected devices across smart cities, healthcare, and industrial IoT is creating long-term demand for FinFET-based semiconductors. These devices require compact chips with high efficiency and thermal control, particularly for edge processing and near-real-time responsiveness.
FinFET Positioned for Growth Across Edge, Smart City, and Connectivity Markets
Between 2025 and 2030, IoT device shipments are expected to exceed 35 billion units globally, with 5G-connected devices accounting for over 40% of that total. FinFET architecture supports the performance-per-watt requirements of this scale while maintaining manageable die sizes. This positions FinFET suppliers to benefit from infrastructure rollouts and next-generation connectivity investments, especially in Asia and North America.
Trend:
Emergence of GAAFET as the Next Evolution Beyond FinFET
The transition to Gate-All-Around FET (GAAFET) at nodes below 3nm is beginning to reshape the competitive landscape. Companies such as Samsung and Intel are integrating GAAFET into their most advanced process roadmaps, citing its benefits in scalability and electrostatic control over FinFET at ultra-small geometries.
Technology Transition Creating Strategic Shifts in Semiconductor Roadmaps
While FinFET remains dominant at 10nm, 7nm, and some 5nm processes, GAAFET’s emergence introduces a potential inflection point. By 2027, GAAFET is expected to capture a meaningful share of leading-edge node production. This trend challenges existing investments in FinFET infrastructure and may accelerate design migration among fabless firms, especially those targeting AI and hyperscale markets.
Recent Developments
Dec 2024 – Taiwan Semiconductor Manufacturing Company (TSMC): TSMC commenced volume production of its 3nm FinFET process (N3E) at its new fab in Kaohsiung, Taiwan. The facility is expected to deliver over 100,000 wafers per month by mid-2025, supporting demand from major clients including Apple and AMD. This expansion strengthens TSMC’s lead in advanced-node FinFET manufacturing and secures long-term capacity for high-performance applications.
Feb 2025 – GlobalFoundries: GlobalFoundries announced a USD 1.4 billion expansion of its Dresden, Germany facility to scale 12nm and 14nm FinFET production for automotive and industrial customers. The move is backed by EU funding under the European Chips Act. This investment enhances supply chain resilience in Europe and increases the company’s share in regulated end-markets.
Apr 2025 – Semiconductor Manufacturing International Corporation (SMIC): SMIC disclosed its successful ramp-up of a domestically developed 7nm FinFET process without EUV lithography, achieving commercial yields above 55%. The process is being deployed in mid-range 5G smartphones by local OEMs. This milestone boosts China’s self-sufficiency in advanced semiconductor manufacturing amid ongoing export controls.
Jul 2025 – AMD (Xilinx Division): AMD launched a new FinFET-based FPGA platform optimized for AI inference and edge computing, manufactured on TSMC’s 5nm process. Early adoption includes telecom and aerospace sectors, with performance gains of up to 38% over previous 7nm designs. This strengthens AMD’s portfolio in adaptive computing and expands its reach in high-growth verticals.
Sep 2025 – Samsung Electronics: Samsung began pilot production of its 2nm Gate-All-Around (GAAFET) technology, with initial integration into FinFET-compatible design platforms. The company is targeting volume ramp in 2026, positioning the 2nm process for AI accelerators and HPC applications. This signals a strategic transition beyond FinFET, potentially impacting future node competitiveness.