
- Home
- Industries
 Aerospace And Defence
 Agriculture
 Automotive And Transportation
 Banking And Finance
 Business
 Chemicals And Materials
 Consumer And Retail
 Electronics And Semiconductors
 Food And Beverages
 Machinery & Equipments
 Manufacturing And Construction
 Medical Devices
 Others
 Pharmaceuticals And Healthcare
 Power And Energy
 Sports
 Technology
- Services
- News Room
- About us
- Contact Us
-
FinTech Blockchain Market 2034 Size, Value & Outlook | 49.2% CAGR
Global FinTech Blockchain Market Size, Share & Analysis By Application (Payments, Clearing and Settlement, Exchanges and Remittance, Smart Contracts, Identity Management, Compliance Management/Know Your Customer (KYC), Others), By Provider (Application and Solution Providers, Middleware Providers, Infrastructure and Protocols Providers), By Enterprise Size (Large Enterprises, Small and Medium-Sized Enterprises (SMEs)), By Industry Vertical (Banking, Non-Banking Financial Services, Insurance), By Deployment Model Industry Trends, Investment Landscape, Regulatory Impact, Competitive Benchmarking & Forecast 2025–2034

Report Overview
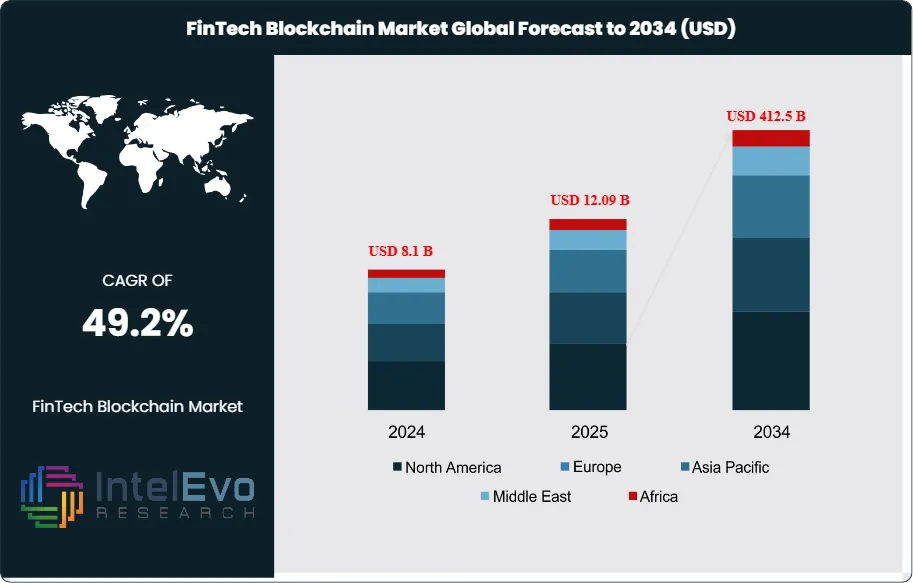
The FinTech Blockchain Market was valued at approximately USD 8.1 Billion in 2024 and is projected to reach nearly USD 412.5 Billion by 2034, expanding at an estimated CAGR of around 49.2% from 2025 to 2034. The surge in digital payments, real-time settlements, and tokenized financial assets is accelerating blockchain adoption across global financial systems. With programmable finance, on-chain identity, and cross-border payment rails maturing rapidly, FinTech blockchain is entering a hyper-growth decade. Institutions worldwide are moving from pilot projects to full-scale production networks, reshaping the future of financial infrastructure.
Get More Information about this report -
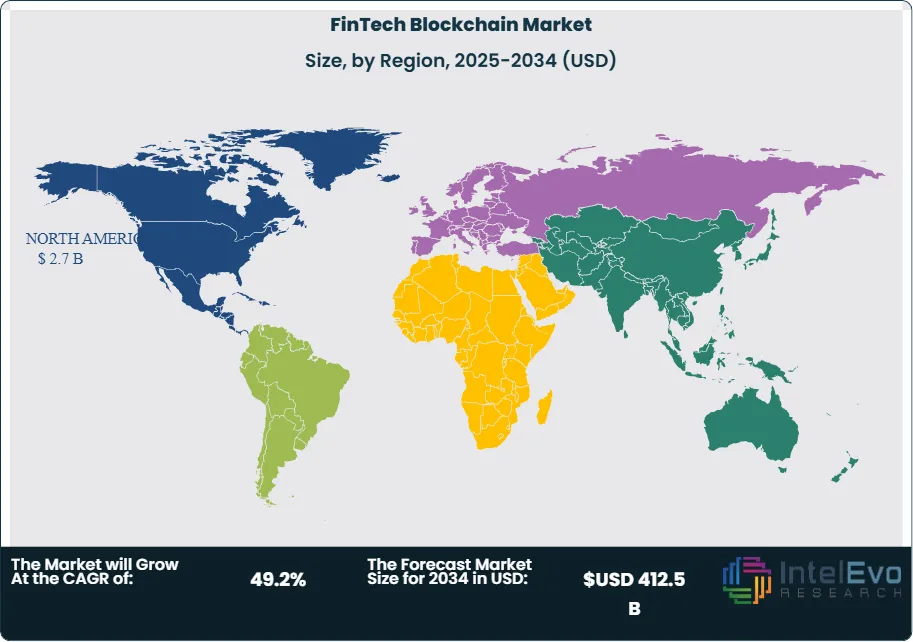
Request Free Sample ReportIt is gaining momentum from a low base as blockchain is moving from proofs of concept to production-ready rails in payment systems, digital banking, and capital markets. North America was the top player with a share of 38.5% (USD 2.7 billion) in 2024, reflecting robust enterprise adoption and venture funding, and Europe’s compliance-first strategy and Asia–Pacific’s digitization drive position both regions for disproportionate growth in the future. In structure, size growth is led by post-pandemic moves to online financial services, accelerating wallet penetration and. API-first banking designs that favor programmable, tamper-evident ledgers.
Demand-side catalysts include the need for instant, low-cost, cross-border transfers and the rising appeal of tokenization. Blockchain enables fractional ownership and 24/7 settlement, widening investor access to historically illiquid assets such as real estate and art and improving liquidity profiles. Supply-side, institutions are turning to blockchains to compress reconciliation cycles, automate back-office workflows via smart contracts, and reduce dependency on intermediaries. At the same time, risks and constraints persist: fragmented regulation, patchy interoperability, and KYC/AML gaps raise compliance costs and slow scale. The U.S. Infrastructure Investment and Jobs Act (2021) requiring reporting of crypto transactions over USD 10,000 underscores intensifying oversight, particularly around DeFi on-ramps.
Digital innovation is reimagining adoption patterns. Platforms with languages such as Solidity (Ethereum) and corporate platforms such as R3 Corda and Hyperledger are making verification, collateral management, and compliance logging easier. Network activity demonstrates maturation: Bitcoin processes an average of roughly 300,000 daily transactions (2024) and Ethereum an average of roughly 1 million daily, powering much of DeFi, whose value-locked reached ~USD 45 billion in 2024 from ~USD 10 billion in mid-2020. In payment systems, blockchain is closing settlement windows—Ripple-led corridors can execute in less than five seconds and are now taken up by over 300 financial institutions across over 40 countries, with efficiency gains in remittance and treasury.
At the regional level, investors must watch North America for mass rollouts, Europe for innovation led by digital-identity and compliance, and Asia–Pacific, specifically fintech corridors, for rapid wallet-based adoption and CBDC-related experiments. Capital deployment hotspots are cross-border B2B payment corridors, asset tokenization platforms, on-chain compliance/RegTech, and DeFi infrastructure with institution-grade security, KYC, and auditability.
, Others), By Provider (Application and Solution Providers, Middleware Providers, Infrastructure and Protocols Providers), By Enterprise Size (Large Enterprises, Small and Medium-Sized Enterprises (SMEs)), By Industry Vertical (Banking, Non-Banking Financial Services, Insurance), By Deployment Model Industry Trends, Investment Landscape, Regulatory Impact, Competitive Benchmarking & Forecast 2025–2034")
Key Takeaways
- Market Growth: The FinTech Blockchain market reached USD 8.1 Billion in 2024 and is projected to hit USD 412.5 Billion by 2034 (CAGR 49.2%), propelled by digitized finance, cross-border payment modernization, and compliance automation at scale.
- Segment Dominance – Application: Payments, Clearing & Settlement led in 2024 with 34.6% share, reflecting demand for instant, low-cost transfers and transparent reconciliation; Ripple-enabled corridors settle in <5 seconds across 300+ institutions in 40 countries, underscoring clear ROI in treasury and remittances.
- Segment Dominance – Provider Type: Infrastructure & Protocol Providers commanded 42.5% share in 2024 as enterprises standardized on robust stacks (e.g., Hyperledger, R3 Corda, Ethereum toolchains) to meet scalability, security, and auditability requirements across regulated workflows.
- Driver: DeFi and on-chain finance are expanding utility: Total value locked climbed from ~USD 10 billion (mid-2020) to ~USD 45 billion (2024), while Ethereum processes ~1 million transactions/day and Bitcoin ~300,000/day, signaling resilient developer and user activity that spills into institutional use cases.
- Restraint: Regulatory fragmentation and KYC/AML enforcement increase compliance overhead and time-to-production; in the U.S., the Infrastructure Investment and Jobs Act mandates reporting crypto transactions over USD 10,000, elevating monitoring costs for DeFi-facing services.
- Opportunity: Scaling Payments, Clearing & Settlement into new cross-border corridors and B2B use cases—if its 2024 share persists—implies ≈USD 113 billion addressable revenue by 2034 (34.6% of the projected market), with incremental gains from fee compression and real-time liquidity.
- Trend: Smart-contract automation is moving from pilots to production for collateral management, corporate actions, and compliance logging; tokenization enables fractional ownership of illiquid assets (e.g., real estate, art), broadening investor access and improving secondary-market liquidity.
- Regional Analysis: North America led with 38.5% revenue share in 2024 (USD 2.7 billion), driven by enterprise deployments and capital depth; Europe benefits from a compliance-first posture catalyzing institutional trials, while Asia–Pacific is poised for faster scale on the back of digital wallet proliferation and blockchain-native payment rails.
Application Analysis
In 2025, Payments, Clearing & Settlement remains the anchor use case, sustaining roughly 34–35% of total application revenue as banks and PSPs prioritize instant cross-border settlement, liquidity optimization, and reconciliation automation. Blockchain rails compress settlement cycles from T+2 to near real time, lowering operational costs and chargeback exposure while improving straight-through processing and auditability. At-scale implementations—spanning card network pilots, remittance corridors, and treasury payouts—are translating into measurable cost-per-transaction reductions and higher on-time settlement rates.
Adjacent applications are gaining momentum. Exchanges & Remittance benefit from 24/7 market access and unified on/off-ramp tooling, while Smart Contracts underpin loan servicing, collateral management, and automated corporate actions. Identity Management and Compliance/KYC are increasingly bundled with transaction workflows, reducing onboarding times by double digits and enabling risk-based monitoring with immutable proofs. Collectively, these segments are expected to outpace the headline market CAGR (~46% through 2034) as institutions fold compliance and identity directly into payment flows.
Provider Analysis
Infrastructure & Protocol Providers continue to command the largest share (about 42.5% in the latest base year) as institutions standardize on scalable, enterprise-grade stacks to meet throughput, privacy, and regulatory logging requirements. Investment concentrates on Layer-1/Layer-2 performance, interoperability bridges, and confidentiality features that support regulated finance, driving multi-year contracts and ecosystem lock-in.
Middleware Providers are the connective tissue—API gateways, data indexing, key management, and orchestration—that reduce integration frictions and shorten time-to-production for banks and fintechs. Application & Solution Providers are layering verticalized capabilities (e.g., on-chain treasury, programmable payouts, claims automation), shifting revenue mix toward transaction-linked and compliance-as-a-service models. As production workloads scale in 2025–2028, we expect infrastructure revenue to grow steadily while middleware and applications expand faster on usage-based pricing.
Enterprise Size Analysis
Large Enterprises account for an estimated ~65.5% of spending, reflecting their ability to fund multi-cloud deployments, specialized security controls, and audit trails aligned to stringent regulatory regimes. ROI is clearest where high transaction volumes meet complex reconciliation—global banks, card networks, multinational retailers, and payment processors—yielding material savings in back-office operations and dispute management.
SMEs are a rising demand cohort as turnkey SaaS modules simplify adoption. Packaged smart-contract libraries, embedded KYC, and managed wallets allow SMEs to launch cross-border payouts or asset-backed financing without heavy capex. From 2025 onward, SME adoption is projected to grow above the market average, aided by fintech partnerships and compliance-ready “plug-in” solutions that convert fixed costs into variable, per-transaction fees.
Industry Vertical Analysis
Banking leads with roughly ~46% share, driven by AML/KYC automation, tokenized deposits, and instant settlement across correspondent networks. Banks report faster onboarding cycles, lower exceptions handling, and enhanced transparency across trade finance and treasury. Non-Banking Financial Services—including brokerages, wealth platforms, and payment companies—are scaling tokenization for fractional assets and 24/7 transferability, improving liquidity and distribution economics.
In Insurance, adoption is shifting from pilots to production for parametric products and claims automation, where smart contracts cut cycle times and reduce leakage. Across all three verticals, integration with real-time risk engines and digital identity is becoming standard, positioning compliant, data-rich transaction records as a competitive differentiator through 2030+.
Regional Analysis
North America remains the revenue leader with ~38.5% share in the latest reported year (≈USD 2.7 billion in 2024) and continues to scale in 2025 on the back of deep enterprise IT budgets, developer ecosystems, and maturing regulatory clarity around reporting and tax treatment. Europe is accelerating via a compliance-first stance, digital-identity initiatives, and alignment with financial data standards, fostering institutional-grade deployments across banking and capital markets.
Asia Pacific is the fastest-growing region through 2030, propelled by super-app payments, cross-border commerce, and public-private pilots in tokenized assets and CBDC-linked experiments. Latin America leverages blockchain for remittances and inflation-hedging use cases, while Middle East & Africa focus on trade finance corridors and government-backed digital infrastructure. Investors should monitor APAC corridors, EU compliance/identity stacks, and North American infrastructure platforms as the primary hotspots for scale, exits, and ecosystem consolidation from 2025 onward.
Get More Information about this report -
Request Free Sample ReportMarket Key Segments
By Application
- Payments
- Clearing and Settlement
- Exchanges and Remittance
- Smart Contracts
- Identity Management
- Compliance Management/Know Your Customer (KYC)
- Others
By Provider
- Application and Solution Providers
- Middleware Providers
- Infrastructure and Protocols Providers
By Enterprise Size
- Large Enterprises
- Small and Medium-Sized Enterprises (SMEs)
By Industry Vertical
- Banking
- Non-Banking Financial Services
- Insurance
Regions
- North America
- Latin America
- East Asia And Pacific
- Sea And South Asia
- Eastern Europe
- Western Europe
- Middle East & Africa
| Report Attribute | Details |
| Market size (2024) | USD 8.1 B |
| Forecast Revenue (2034) | USD 412.5 B |
| CAGR (2024-2034) | 49.2% |
| Historical data | 2020-2023 |
| Base Year For Estimation | 2024 |
| Forecast Period | 2025-2034 |
| Report coverage | Revenue Forecast, Competitive Landscape, Market Dynamics, Growth Factors, Trends and Recent Developments |
| Segments covered | By Application (Payments, Clearing and Settlement, Exchanges and Remittance, Smart Contracts, Identity Management, Compliance Management/Know Your Customer (KYC), Others), By Provider (Application and Solution Providers, Middleware Providers, Infrastructure and Protocols Providers), By Enterprise Size (Large Enterprises, Small and Medium-Sized Enterprises (SMEs)), By Industry Vertical (Banking, Non-Banking Financial Services, Insurance) |
| Research Methodology |
|
| Regional scope |
|
| Competitive Landscape | Ripple, IBM Corporation, Digital Asset Holdings, BitPay, Microsoft, Auxesis Group, AWS, Coinbase, Oracle, Bitfury Group Limited, Other Key Players |
| Customization Scope | Customization for segments, region/country-level will be provided. Moreover, additional customization can be done based on the requirements. |
| Pricing and Purchase Options | Avail customized purchase options to meet your exact research needs. We have three licenses to opt for: Single User License, Multi-User License (Up to 5 Users), Corporate Use License (Unlimited User and Printable PDF). |
, Others), By Provider (Application and Solution Providers, Middleware Providers, Infrastructure and Protocols Providers), By Enterprise Size (Large Enterprises, Small and Medium-Sized Enterprises (SMEs)), By Industry Vertical (Banking, Non-Banking Financial Services, Insurance), By Deployment Model Industry Trends, Investment Landscape, Regulatory Impact, Competitive Benchmarking & Forecast 2025–2034")
, Others), By Provider (Application and Solution Providers, Middleware Providers, Infrastructure and Protocols Providers), By Enterprise Size (Large Enterprises, Small and Medium-Sized Enterprises (SMEs)), By Industry Vertical (Banking, Non-Banking Financial Services, Insurance), By Deployment Model Industry Trends, Investment Landscape, Regulatory Impact, Competitive Benchmarking & Forecast 2025–2034")
, Others), By Provider (Application and Solution Providers, Middleware Providers, Infrastructure and Protocols Providers), By Enterprise Size (Large Enterprises, Small and Medium-Sized Enterprises (SMEs)), By Industry Vertical (Banking, Non-Banking Financial Services, Insurance), By Deployment Model Industry Trends, Investment Landscape, Regulatory Impact, Competitive Benchmarking & Forecast 2025–2034")
Frequently Asked Questions
How big is the FinTech Blockchain Market?
The FinTech Blockchain Market will surge from USD 8.1B in 2024 to USD 412.5B by 2034, driven by real-time payments, tokenization, and next-gen financial infrastructure.
Who are the major players in the FinTech Blockchain Market?
Ripple, IBM Corporation, Digital Asset Holdings, BitPay, Microsoft, Auxesis Group, AWS, Coinbase, Oracle, Bitfury Group Limited, Other Key Players
Which segments covered the FinTech Blockchain Market?
By Application (Payments, Clearing and Settlement, Exchanges and Remittance, Smart Contracts, Identity Management, Compliance Management/Know Your Customer (KYC), Others), By Provider (Application and Solution Providers, Middleware Providers, Infrastructure and Protocols Providers), By Enterprise Size (Large Enterprises, Small and Medium-Sized Enterprises (SMEs)), By Industry Vertical (Banking, Non-Banking Financial Services, Insurance)
How can this market research report help my business make strategic decisions?
Our market research reports provide actionable intelligence, including verified market size data, CAGR projections, competitive benchmarking, and segment-level opportunity analysis. These insights support strategic planning, investment decisions, product development, and market entry strategies for enterprises and startups alike.
How frequently is the data updated?
We continuously monitor industry developments and update our reports to reflect regulatory changes, technological advancements, and macroeconomic shifts. Updated editions ensure you receive the latest market intelligence.

Select Licence Type
Connect with our sales team
Why IntelEvoResearch
100%
Customer
Satisfaction
24x7+
Availability - we are always
there when you need us
200+
Fortune 50 Companies trust
IntelEvoResearch
80%
of our reports are exclusive
and first in the industry
100%
more data
and analysis
1000+
reports published
till date
