
- Home
- Industries
 Aerospace And Defence
 Agriculture
 Automotive And Transportation
 Banking And Finance
 Business
 Chemicals And Materials
 Consumer And Retail
 Electronics And Semiconductors
 Food And Beverages
 Machinery & Equipments
 Manufacturing And Construction
 Medical Devices
 Others
 Pharmaceuticals And Healthcare
 Power And Energy
 Sports
 Technology
- Services
- News Room
- About us
- Contact Us
-
Floating LNG Terminal Market Size, Share & Forecast | CAGR 8.7%
Global Floating LNG Terminal Market Size, Share, Analysis By Terminal Type (FSRU Terminals, FLNG Export Terminals), By Configuration (Converted Floating LNG Terminals, Newbuilt Floating LNG Terminals), By Application (Power Generation & Grid Balancing, Industrial & City Gas Distribution, Trading & Export Monetization), By Ownership Model, Industry Trends, Competitive Landscape, Regional Insights & Forecast 2026–2034

Report Overview
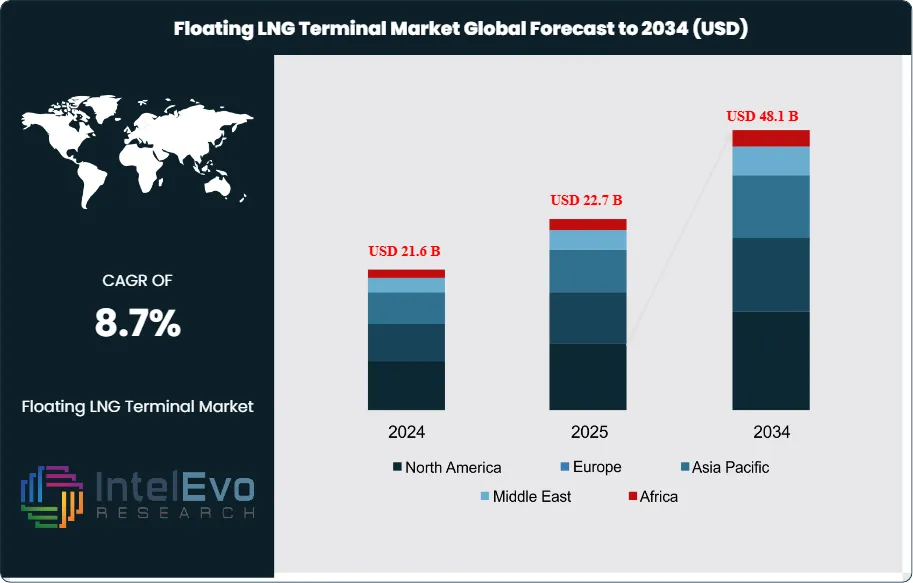
| Market Size (2025) | Forecast Value (2034) | CAGR (2026–2034) | Largest Region (2025) |
| USD 22.7 Billion | USD 48.1 Billion | 8.7% | Europe, 31.0% |
The Floating LNG Terminal Market was valued at approximately USD 21.6 Billion in 2024 and increased to USD 22.7 Billion in 2025. The market is projected to reach nearly USD 48.1 Billion by 2034, expanding at a compound annual growth rate (CAGR) of around 8.7% during the forecast period from 2026 to 2034. This growth path fits the 9-year CAGR formula exactly. The market sits on top of a wider LNG chain that remained active in 2024 and early 2025. Global LNG trade reached 411.24 MT in 2024. Global regasification capacity reached 1,188 MTPA. The industry added 12 new regasification terminals and 7 expansions in 2024. Operational floating liquefaction capacity also rose to 14.35 MTPA by early 2025. These figures support continued spending on floating LNG terminals across both import and export use cases.
Get More Information about this report -
Request Free Sample ReportThe Floating LNG Terminal Market now reflects two clear demand pools. The first is floating storage and regasification units used for rapid LNG imports. The second is floating liquefaction units used to monetize offshore or stranded gas. Import-side demand remains larger in 2025. FSRU-based terminals account for an estimated 72.0% of global Floating LNG Terminal Market revenue, or USD 16.3 Billion, because they move faster than onshore terminals, require lower upfront civil works, and answer short-to-medium term energy security needs. Export-side FLNG systems account for 28.0%, or USD 6.4 Billion, but they influence project value more strongly on a per-unit basis because contract periods often run 15 to 20 years. This structure matches current project flow, where Egypt, Italy, Germany, Singapore, Iraq, Brazil, India, and the Netherlands continue to back floating import solutions, while Argentina and offshore African projects support floating liquefaction growth.
Supply and demand forces remain shaped by energy security, seasonal gas volatility, and capital discipline. Europe still relies on LNG flexibility after the post-2022 reset in pipeline flows. Germany’s floating terminals handled 11% of national gas imports in late 2025, while utilization varied sharply by site, showing that speed of deployment often matters more than near-term utilization in state-backed infrastructure planning. Italy advanced Ravenna in 2025. Egypt extended floating import capacity. Singapore moved ahead with financing for its new FSRU. Iraq selected an integrated floating LNG import terminal. These signals show that floating LNG terminals now serve as strategic infrastructure, not just temporary stopgaps.
Technology is also changing project economics. Operators are applying digital monitoring, predictive maintenance, cargo optimization, reliquefaction retrofits, and higher automation in mooring, boil-off handling, and regas processes. Excelerate’s reliquefaction retrofit program and ABB’s power package for Singapore’s floating terminal point to stronger automation intensity and lower operating losses over the next build cycle. Risk remains real. Permit delays, local opposition, vessel conversion bottlenecks, charter inflation, and uneven utilization can slow returns. Even so, Asia Pacific and Europe remain the two largest investment hotspots in the Floating LNG Terminal Market in 2025, while Latin America and the Middle East are the fastest-rising project zones.
, By Configuration (Converted Floating LNG Terminals, Newbuilt Floating LNG Terminals), By Application (Power Generation & Grid Balancing, Industrial & City Gas Distribution, Trading & Export Monetization), By Ownership Model, Industry Trends, Competitive Landscape, Regional Insights & Forecast 2026–2034")
Key Takeaways
- Market Growth: The Floating LNG Terminal Market stood at USD 22.7 Billion in 2025 and is projected to reach USD 48.1 Billion by 2034 at a CAGR of 8.7% during 2025–2034. The forecast reflects continued additions in floating regasification capacity and selective growth in FLNG export platforms.
- Segment Dominance: FSRU terminals led the market by terminal type with a 72.0% share in 2025, equal to USD 16.3 Billion. The segment leads because deployment cycles are shorter and permit paths are often lighter than onshore LNG receiving terminals.
- Segment Dominance: Power generation and grid balancing led by application with a 38.0% share in 2025, equal to USD 8.6 Billion. Floating LNG terminals continue to anchor gas-fired power systems in Brazil, Egypt, South Asia, and island or coastal markets.
- Driver: The main growth driver is energy security. Global regasification capacity reached 1,188 MTPA and 12 new terminals were added in 2024, while floating solutions kept gaining share in fast-track import projects.
- Restraint: Utilization risk remains material. Germany’s Mukran LNG terminal ran at only 5% utilization in Q1 2025, showing that floating LNG terminal projects can face weak short-term throughput even after deployment.
- Opportunity: The largest near-term opportunity sits in new import markets. Iraq’s selected floating LNG terminal includes 500 MMscf/d guaranteed regas capacity and about USD 450 million of project investment, showing the scale of new-market entry potential.
- Trend: The leading trend is larger, digitally managed, multi-role floating terminals. Operational FLNG capacity reached 14.35 MTPA by early 2025, while automation and efficiency upgrades expanded in FSRU fleets.
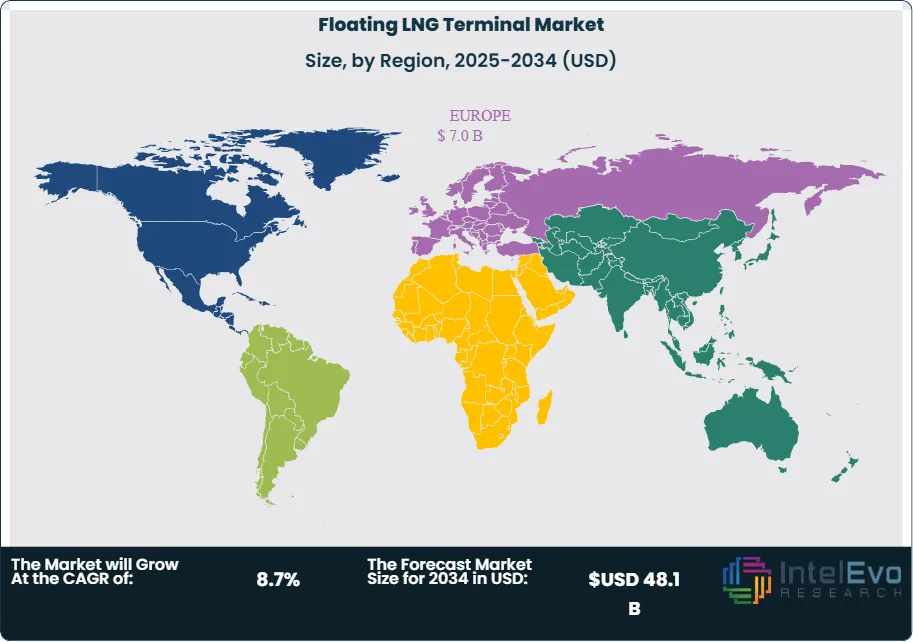
- Regional Analysis: Europe held the largest share at 31.0% in 2025, equal to USD 7.0 Billion. Italy, Germany, France, and the Netherlands remain the most visible floating LNG terminal demand centers in the region.
Competitive Landscape
The Floating LNG Terminal Market is moderately consolidated. The top four players held an estimated 43.0% of global revenue in 2025. Competition is primarily technology-driven and geographic, with vessel availability, conversion capability, chartering depth, and port integration shaping win rates. Competitive intensity rose in 2025 as Egypt, Iraq, Singapore, Argentina, and the Netherlands advanced floating projects, while operators pushed longer charter terms and integrated LNG supply-plus-terminal packages to secure margins.
| Company | HQ | Position | Key Offering | Geo Strength | Recent Move |
| Höegh Evi | Norway | Leader | Hoegh Gandria FSRU | Europe, Middle East | Signed EGAS charter in Egypt and began conversion program in May 2025 |
| Excelerate Energy | US | Leader | Hull 3407 FSRU platform | Americas, Middle East, South Asia | Won Iraq floating LNG import terminal award in Oct 2025 with 500 MMscf/d capacity |
| Golar LNG | Bermuda | Leader | MK II FLNG | Latin America, Africa | Reached FID for 20-year MK II FLNG charter in Argentina in Aug 2025 |
| BW LNG | Singapore | Challenger | BW Magna FSRU | Latin America, Europe | BW Magna began supply support for Brazil’s GNA II in Jul 2025 |
| Mitsui O.S.K. Lines | Japan | Challenger | Singapore FSRU project | Asia Pacific | Signed project finance agreement for Singapore FSRU in Dec 2025 |
| New Fortress Energy | US | Challenger | Fast LNG | Latin America | Continued scaling Altamira Fast LNG after first LNG and export authorization cycle |
| Snam | Italy | Challenger | FSRU Italia Ravenna | Europe | Started first commercial LNG discharge at Ravenna in Jun 2025 |
| TotalEnergies | France | Niche Player | Le Havre FSRU operations | Europe | Announced relocation of Le Havre floating terminal in Nov 2025 after court ruling |
| VTTI | Netherlands | Niche Player | Zeeland Energy Terminal platform | Europe | Launched permitting process with Höegh Evi in Apr 2025 |
| Deutsche ReGas | Germany | Niche Player | Mukran FSRU terminal | Europe | Marketed long-term regas slots as Germany prepared second-phase capacity |
By Terminal Type
FSRU terminals dominate the Floating LNG Terminal Market by terminal type. The segment holds 72.0% of global revenue in 2025, or about USD 16.3 Billion. FSRUs lead because buyers can lease or charter capacity, use existing marine logistics, and bypass much of the civil construction burden tied to land-based LNG import terminals. Europe remains the largest FSRU demand center. Germany, Italy, France, and the Netherlands pushed FSRU-linked projects or operational shifts during 2025. The Middle East and Asia Pacific also added momentum through Egypt, Iraq, and Singapore. Competition in this segment centers on fleet depth, conversion lead times, berth engineering, LNG sourcing support, and the ability to offer bundled terminal services. Höegh Evi, Excelerate Energy, BW LNG, MOL, and Snam sit near the front of this segment. FSRU revenue also benefits from long charter visibility. Several projects now run on 5-year to 20-year structures, which supports steadier earnings than many spot-linked marine energy assets. Digital asset monitoring and boil-off management are becoming standard, which improves uptime and cuts cargo losses. The main downside is throughput volatility. Low-utilization cases in Germany show that FSRUs can be commissioned faster than end-market demand fully materializes. Even so, the speed advantage keeps FSRUs at the center of the Floating LNG Terminal Market outlook.
FLNG export terminals account for the remaining 28.0% share in 2025, or roughly USD 6.4 Billion. This segment is smaller by installed unit count but carries high asset value and deep technical complexity. FLNG systems appeal where offshore gas can be commercialized without full onshore infrastructure, or where stranded reserves support modular export platforms. Golar LNG and New Fortress Energy shape the segment most clearly in the current cycle. Golar’s operating and under-construction positions span FLNG Hilli, FLNG Gimi, and the MK II expansion route. The company reported 5.1 MTPA already on the water across Hilli and Gimi, plus a further 3.5 MTPA under development. The Argentina charter package signed in 2025 points to longer-duration export economics and stronger regional interest in offshore liquefaction. New Fortress Energy’s Fast LNG model targets smaller, faster-deployed liquefaction capacity. FLNG competition depends on upstream gas access, liquefaction process design, marine integration, and long-term offtake support. Capital intensity is the main barrier. Permit complexity and offshore operating risk also remain high. Still, FLNG terminals should outgrow the broader Floating LNG Terminal Market from 2025 to 2034 because each new sanctioned unit adds large revenue in one step and opens export options for gas resources that remain undeveloped today.
By Configuration
Converted floating LNG terminals held the largest share at 58.0% in 2025, equal to USD 13.2 Billion. Converted units lead because they reduce time to market and lower capital outlay versus fully newbuilt systems. Most near-term floating LNG terminal demand since 2022 has favored speed. That bias pushed owners to repurpose LNG carriers into FSRUs or to reuse existing marine hulls in modular FLNG design. Höegh Evi’s Egypt-bound conversion, Seatrium’s FSRU conversion awards, and several European floating import projects reinforce this structure. Converted terminals also fit markets that need 5-year to 15-year solutions rather than 30-year fixed sites. Buyers gain faster commercial start-up and less exposure to heavy civil works. The trade-off is lifecycle efficiency. Converted units can face lower thermal efficiency, tighter deck constraints, and higher maintenance cost versus purpose-built assets. Even so, their economics remain attractive where demand is urgent or uncertain. Competitive positioning in converted units depends heavily on shipyard access, engineering packages, class approvals, and retrofit expertise. This creates a strong link between terminal operators and conversion contractors such as Seatrium. For the 2025–2034 period, converted units should remain the volume leader, especially in emerging import markets across South Asia, the Middle East, and parts of Africa and Latin America.
Newbuilt floating LNG terminals represented 42.0% of market revenue in 2025, or USD 9.5 Billion. This segment trails in volume but leads in design flexibility, operational efficiency, and long-life performance. Newbuilt units are better suited for large baseload import demand, more complex power packages, and stricter efficiency targets. Singapore’s FSRU project illustrates this trend, with project finance signed in 2025 and ABB selected for the power and propulsion package. Buyers choose newbuilt assets when throughput certainty is high and national infrastructure goals justify higher upfront spending. This segment also benefits from tighter integration of automation, predictive diagnostics, reliquefaction systems, and future fuel-readiness. Operators can design better tank layouts, regas modules, and electrical systems from the start rather than adapting old hull constraints. The challenge remains capital intensity and lead time. Newbuilt terminals require stronger long-term demand visibility and can face shipyard bottlenecks. Even so, newbuilt share should edge upward by 2034 as more buyers move from emergency procurement to planned infrastructure replacement. The segment is especially strong in developed Asian markets and large national energy-security programs where planners value long asset life and lower operating loss.
By Application
Power generation and grid balancing led the Floating LNG Terminal Market with a 38.0% share in 2025, or USD 8.6 Billion. This segment benefits from floating terminals’ ability to connect imported LNG with dispatchable gas-fired power systems in coastal markets. Brazil provides one of the clearest examples. BW Magna supports the GNA complex, which forms the largest thermoelectric power complex in Latin America and can serve roughly 14 million homes. Egypt also uses floating import capability to support supply security and balancing needs. In many developing markets, power demand volatility and weak domestic gas supply make FSRUs economically attractive. The competitive edge in this segment lies in integration. Operators that can align terminal services with power plant offtake, storage scheduling, and LNG procurement win more contracts. This is also the segment where floating LNG terminals can replace fuel oil or coal in coastal power systems, especially where grid reliability matters more than full baseload gasization. Risks include power tariff pressure and seasonal cargo economics. Still, this remains the largest end-use segment through 2034 because it ties directly to electricity adequacy and industrial power quality.
Industrial and city gas distribution captured 34.0% of revenue in 2025, or USD 7.7 Billion. This segment includes fertilizer, refining, petrochemicals, heavy manufacturing, and urban gas networks that need coastal import flexibility. India’s Haldia floating LNG terminal project shows the logic clearly. The planned first phase includes 1.5 MMTPA regas capacity, expandable to 3.0 MMTPA, and is linked to east India gas distribution demand. Iraq’s selected floating LNG terminal also reflects industrial and power-sector supply needs, with minimum contracted offtake of 250 MMscf/d and guaranteed 500 MMscf/d regasification capacity. Buyers in this segment prefer floating LNG terminals when pipeline access is still developing or when industrial clusters need earlier gas access than onshore terminals can provide. Commercially, the segment rewards integrated LNG supply-plus-terminal packages because customers value feedgas certainty as much as infrastructure access. Margin quality can be strong in these contracts, but exposure to commodity-linked industrial demand remains a risk. From 2025 onward, this segment should expand steadily in South Asia, the Middle East, and selected Latin American ports.
Trading, peak shaving, and export monetization accounted for 28.0% of 2025 revenue, or USD 6.4 Billion. This segment includes floating terminals used for seasonal balancing, merchant optimization, emergency imports, and offshore export of stranded gas. It is more fragmented than the power or industrial segments because contract structures vary widely. Some projects support national energy security. Others monetize specific upstream gas resources. Golar’s Argentina FLNG package is a clear export monetization case. TotalEnergies’ Le Havre relocation shows the other side of the market, where emergency floating import assets can be repositioned as supply conditions change. This segment depends heavily on portfolio management, not just terminal operations. Operators with shipping access, LNG marketing capability, and flexible charter structures hold an advantage. Revenue visibility can swing more than in power-linked contracts, but upside is also higher when arbitrage, seasonal spreads, or upstream gas access align. Through 2034, this segment should remain smaller than power and industrial uses, yet it will stay strategically important because it absorbs the market’s most flexible and highest-value use cases.
By Ownership Model
Owned-and-operated terminals led with a 54.0% share in 2025, equal to USD 12.3 Billion. National infrastructure owners, established marine LNG operators, and utilities increasingly prefer direct ownership where long-term demand is visible. This model provides stronger control over terminal scheduling, maintenance, and integration with national gas systems. Snam’s Ravenna operations and MOL’s Singapore financing support this pattern. Owned-and-operated structures also align better with state-backed energy security mandates in Europe and Asia. Revenue profiles are steadier, and operators can align terminal economics with broader gas network returns rather than vessel-only margins. However, this model requires higher upfront capital and clearer utilization assumptions. It is strongest in markets where LNG infrastructure forms part of a long-term gas or transition strategy rather than a temporary supply bridge. As floating LNG terminals shift from crisis response to planned infrastructure, the ownership share should remain firm through the forecast period.
Chartered and leased terminals represented 46.0% of market revenue in 2025, or USD 10.4 Billion. This model remains critical in fast-entry markets and in countries that want supply diversity without full balance-sheet exposure. Excelerate, Höegh Evi, BW LNG, and Golar all use charter structures extensively. Charter models reduce time to commissioning and lower political friction because governments can start with shorter contractual commitments. They also fit demand profiles where volumes are still ramping or where floating LNG terminals may later be replaced by fixed onshore capacity. The segment’s main risk is charter-rate inflation and lower residual economics when a project ends early or utilization falls. Yet commercial flexibility keeps leased terminals highly relevant. This is particularly true in frontier import markets, temporary reinforcement projects, and FLNG projects tied to long-term upstream agreements rather than sovereign infrastructure ownership. The chartered segment should continue to win first-entry projects, even as owned models gain ground in mature programs.
By Regional Analysis
North America Floating LNG Terminal Market
North America held 18.0% of the Floating LNG Terminal Market in 2025, equal to USD 4.1 Billion. The region has a mixed profile. The United States remains more important as an LNG exporter and project sponsor than as a floating LNG import market, but US-based companies drive a large share of fleet ownership, engineering, and project development. Excelerate Energy and New Fortress Energy are the two most visible North American names in the floating LNG terminal ecosystem. Their commercial footprint extends across the Americas, the Middle East, and emerging offshore export projects. Mexico is the region’s most relevant operating market for FLNG-linked export growth because New Fortress Energy’s Altamira Fast LNG entered production in 2024 and retained strategic importance into 2025 and 2026. Canada remains smaller in floating terminal deployment but relevant in project financing, ship management, and LNG trade participation. The regional market therefore reflects corporate control and offshore export activity more than domestic import demand.
The United States accounted for roughly 64.0% of North America’s Floating LNG Terminal Market revenue in 2025, or USD 2.6 Billion, driven mostly by corporate ownership and project management revenues. Mexico represented 24.0%, or USD 1.0 Billion, reflecting offshore liquefaction activity and marine terminal services. Canada held 8.0%, or USD 0.3 Billion, while the rest of North America made up the balance. Regulation in the region tends to be more project-specific than centrally planned. Export approvals, maritime standards, port permits, and gas supply agreements shape timelines. The strongest regional opportunity lies in export-side floating LNG terminals tied to offshore or nearshore gas monetization. The main risk sits in permitting and commodity exposure. North America should retain strategic importance in corporate leadership and modular FLNG design, even if Europe and Asia Pacific remain larger end markets by installed floating import demand.
Europe Floating LNG Terminal Market
Europe held the largest share of the Floating LNG Terminal Market at 31.0% in 2025, equal to USD 7.0 Billion. Europe became the center of floating LNG terminal deployment after 2022 and remains the largest installed demand base in 2025, even though utilization has become more uneven. Italy, Germany, France, and the Netherlands are the key countries. Italy advanced Ravenna in 2025, adding momentum to a market already supported by offshore regasification assets. Germany continued to rely on multiple FSRUs, with floating terminals handling 11% of national gas imports by late 2025. France faced a different phase, with TotalEnergies deciding to relocate the Le Havre FSRU after a court ruling. The Netherlands moved the Zeeland Energy Terminal permitting process forward with VTTI and Höegh Evi. These developments show that Europe’s floating LNG terminal base is moving from rapid emergency buildout to portfolio rebalancing.
Germany represented around 29.0% of Europe’s market revenue in 2025, or USD 2.0 Billion. Italy held 22.0%, or USD 1.5 Billion. France accounted for 12.0%, or USD 0.8 Billion, and the Netherlands held 10.0%, or USD 0.7 Billion. The rest of Europe contributed 27.0%. Regulation remains the key variable. Europe has strong infrastructure funding capacity and clear energy security logic, but environmental scrutiny is intensifying. Germany’s Mukran terminal showed only 5% utilization in Q1 2025, while Wilhelmshaven and Brunsbüttel performed better. That split highlights the central European issue for the next cycle. The market no longer depends only on commissioning speed. It now depends on throughput discipline, contracting depth, and how floating LNG terminals fit future hydrogen and low-carbon plans. Europe should still lead revenue through 2034, but growth rates will likely trail Asia Pacific from the late forecast years.
Asia Pacific Floating LNG Terminal Market
Asia Pacific accounted for 27.0% of the Floating LNG Terminal Market in 2025, equal to USD 6.1 Billion. This region combines the broadest long-term demand pool with one of the most active terminal expansion pipelines. China drove 25.1 MTPA of new regasification capacity additions according to recent IGU commentary, which underlines the region’s structural appetite for LNG access. Not all of that capacity is floating, but it supports a favorable backdrop for floating LNG terminal deployment where speed, port flexibility, and coastal demand matter. Singapore emerged as a high-value floating LNG terminal project in 2025 after MOL signed project finance for the city-state’s FSRU and ABB won a major electrical systems role. India also advanced a floating LNG terminal at Haldia, aimed at strengthening east-coast gas supply. Japan remains less dependent on new FSRU imports than developing Asian markets, but Japanese shipping groups remain major owners and financiers of floating LNG terminal assets.
China held about 33.0% of Asia Pacific revenue in 2025, or USD 2.0 Billion. Japan accounted for 18.0%, or USD 1.1 Billion, driven mainly by ownership and financing exposure. India held 16.0%, or USD 1.0 Billion. Singapore represented 10.0%, or USD 0.6 Billion. The rest of Asia Pacific made up 23.0%. Policy support remains strong because governments view LNG as a reliability fuel alongside renewables and power demand growth. The region also offers better medium-term utilization prospects than parts of Europe because electricity demand and industrial gas use are still rising. Competition is intense among Japanese owners, Norwegian operators, and US-based integrated providers. Asia Pacific should post the fastest absolute revenue increase after Europe because it combines import growth, financing depth, and high-value marine engineering demand.
Latin America Floating LNG Terminal Market
Latin America held 14.0% of the Floating LNG Terminal Market in 2025, equal to USD 3.2 Billion. The region plays two roles. It is a major floating LNG terminal import market tied to gas-to-power demand, and it is increasingly relevant in floating liquefaction. Brazil leads the region by a wide margin. BW Magna began supporting the GNA II complex in 2025 under a 23-year charter, giving Brazil one of the clearest cases of long-duration LNG-to-power infrastructure in the world. Argentina moved into the FLNG spotlight after Golar secured 20-year agreements covering 5.95 MTPA of nameplate capacity for the Southern Energy project. Mexico remains important through the Altamira Fast LNG platform. This regional mix makes Latin America one of the few places where both FSRU and FLNG revenues scale meaningfully at the same time.
Brazil accounted for roughly 41.0% of Latin America’s market in 2025, or USD 1.3 Billion. Mexico represented 23.0%, or USD 0.7 Billion. Argentina held 19.0%, or USD 0.6 Billion. The rest of Latin America contributed 17.0%. Regulation across the region remains uneven. Project economics depend on power-market design, fuel switching, sovereign credit conditions, and upstream gas access. Still, the need for dispatchable coastal energy and the presence of offshore gas support a strong case for floating LNG terminals. Latin America should post one of the highest CAGRs in the market through 2034 because several projects sit at the point where contracts, upstream supply, and marine infrastructure finally align.
Middle East & Africa Floating LNG Terminal Market
Middle East & Africa accounted for 10.0% of the Floating LNG Terminal Market in 2025, equal to USD 2.3 Billion. The region is still smaller than Europe, Asia Pacific, or Latin America, but it is gaining speed. Egypt is the anchor import market. Höegh Evi signed a charter with EGAS in 2025 and confirmed that Hoegh Gandria would replace the interim unit, while Hoegh Galleon remained in Egypt for up to an additional year. Iraq then moved into focus after awarding Excelerate an integrated floating LNG import terminal, designed for 500 MMscf/d guaranteed regasification capacity. On the export side, Africa remains relevant because operational FLNG growth in recent years has included Congo, and older offshore West African gas themes still support long-term opportunity. The region’s demand case rests on energy shortages, seasonal power stress, and the ability to add LNG import capacity faster than fixed terminals.
Egypt represented about 30.0% of MEA revenue in 2025, or USD 0.7 Billion. Saudi Arabia held 18.0%, or USD 0.4 Billion, mostly through planning interest and marine energy participation. The UAE accounted for 16.0%, or USD 0.4 Billion. South Africa held 10.0%, or USD 0.2 Billion, with the balance spread across the rest of the region. The regulatory picture remains mixed. Some governments can move quickly on strategic energy infrastructure, while others face financing constraints and slower gas-market reform. The strongest opportunity sits in integrated projects where one provider supplies the terminal, LNG cargoes, and support infrastructure. This region should outpace the global average in growth because its installed base is still relatively small and supply deficits remain acute.
Get More Information about this report -
Request Free Sample ReportMarket Key Segments
By Terminal Type
- FSRU Terminals
- FLNG Export Terminals
By Configuration
- Converted Floating LNG Terminals
- Newbuilt Floating LNG Terminals
By Application
- Power Generation and Grid Balancing
- Industrial and City Gas Distribution
- Trading, Peak Shaving, and Export Monetization
By Ownership Model
- Owned-and-Operated Terminals
- Chartered and Leased Terminals
Regional Analysis and Coverage
- North America
- Latin America
- East Asia And Pacific
- Sea And South Asia
- Eastern Europe
- Western Europe
- Middle East & Africa
| Report Attribute | Details |
| Market size (2025) | USD 22.7 B |
| Forecast Revenue (2034) | USD 48.1 B |
| CAGR (2025-2034) | 8.7% |
| Historical data | 2021-2024 |
| Base Year For Estimation | 2025 |
| Forecast Period | 2026-2034 |
| Report coverage | Revenue Forecast, Competitive Landscape, Market Dynamics, Growth Factors, Trends and Recent Developments |
| Segments covered | By Terminal Type (FSRU Terminals, FLNG Export Terminals), By Configuration (Converted Floating LNG Terminals, Newbuilt Floating LNG Terminals), By Application (Power Generation and Grid Balancing, Industrial and City Gas Distribution, Trading, Peak Shaving, and Export Monetization), By Ownership Model (Owned-and-Operated Terminals, Chartered and Leased Terminals) |
| Research Methodology |
|
| Regional scope |
|
| Competitive Landscape | HÖEGH EVI, EXCELERATE ENERGY, GOLAR LNG, BW LNG, MITSUI O.S.K. LINES, NEW FORTRESS ENERGY, SNAM, TOTALENERGIES, VTTI, DEUTSCHE REGAS, SEATRIUM, ENI, UNIPER, DYNAGAS, GASLOG, JAPAN MARINE UNITED, Others |
| Customization Scope | Customization for segments, region/country-level will be provided. Moreover, additional customization can be done based on the requirements. |
| Pricing and Purchase Options | Avail customized purchase options to meet your exact research needs. We have three licenses to opt for: Single User License, Multi-User License (Up to 5 Users), Corporate Use License (Unlimited User and Printable PDF). |
, By Configuration (Converted Floating LNG Terminals, Newbuilt Floating LNG Terminals), By Application (Power Generation & Grid Balancing, Industrial & City Gas Distribution, Trading & Export Monetization), By Ownership Model, Industry Trends, Competitive Landscape, Regional Insights & Forecast 2026–2034")
, By Configuration (Converted Floating LNG Terminals, Newbuilt Floating LNG Terminals), By Application (Power Generation & Grid Balancing, Industrial & City Gas Distribution, Trading & Export Monetization), By Ownership Model, Industry Trends, Competitive Landscape, Regional Insights & Forecast 2026–2034")
, By Configuration (Converted Floating LNG Terminals, Newbuilt Floating LNG Terminals), By Application (Power Generation & Grid Balancing, Industrial & City Gas Distribution, Trading & Export Monetization), By Ownership Model, Industry Trends, Competitive Landscape, Regional Insights & Forecast 2026–2034")
Frequently Asked Questions
How big is the Floating LNG Terminal Market?
The Global Floating LNG Terminal Market was valued at USD 22.7 Billion in 2025, projected to reach USD 48.1 Billion by 2034, growing at a CAGR of 8.7% from 2026–2034, driven by rising LNG demand, FSRU adoption, and investments in flexible offshore gas infrastructure.
Who are the major players in the Floating LNG Terminal Market?
HÖEGH EVI, EXCELERATE ENERGY, GOLAR LNG, BW LNG, MITSUI O.S.K. LINES, NEW FORTRESS ENERGY, SNAM, TOTALENERGIES, VTTI, DEUTSCHE REGAS, SEATRIUM, ENI, UNIPER, DYNAGAS, GASLOG, JAPAN MARINE UNITED, Others
Which segments covered the Floating LNG Terminal Market?
By Terminal Type (FSRU Terminals, FLNG Export Terminals), By Configuration (Converted Floating LNG Terminals, Newbuilt Floating LNG Terminals), By Application (Power Generation and Grid Balancing, Industrial and City Gas Distribution, Trading, Peak Shaving, and Export Monetization), By Ownership Model (Owned-and-Operated Terminals, Chartered and Leased Terminals)
How can this market research report help my business make strategic decisions?
Our market research reports provide actionable intelligence, including verified market size data, CAGR projections, competitive benchmarking, and segment-level opportunity analysis. These insights support strategic planning, investment decisions, product development, and market entry strategies for enterprises and startups alike.
How frequently is the data updated?
We continuously monitor industry developments and update our reports to reflect regulatory changes, technological advancements, and macroeconomic shifts. Updated editions ensure you receive the latest market intelligence.

Select Licence Type
Connect with our sales team
Floating LNG Terminal Market
Published Date : 20 Mar 2026 | Formats :Why IntelEvoResearch
100%
Customer
Satisfaction
24x7+
Availability - we are always
there when you need us
200+
Fortune 50 Companies trust
IntelEvoResearch
80%
of our reports are exclusive
and first in the industry
100%
more data
and analysis
1000+
reports published
till date
