
- Home
- Industries
 Aerospace And Defence
 Agriculture
 Automotive And Transportation
 Banking And Finance
 Business
 Chemicals And Materials
 Consumer And Retail
 Electronics And Semiconductors
 Food And Beverages
 Machinery & Equipments
 Manufacturing And Construction
 Medical Devices
 Others
 Pharmaceuticals And Healthcare
 Power And Energy
 Sports
 Technology
- Services
- News Room
- About us
- Contact Us
-
Global Flow Cytometry Market Size, Share & Forecast 2034 | CAGR 11.0%
Global Flow Cytometry Market Size, Share, Growth Analysis By Product (Cell Analyzers, Cell Sorters, Reagents & Kits, Software & Data Analysis Tools, Accessories & Consumables), By Technology (Spectral Flow Cytometry, Imaging Flow Cytometry, Mass Cytometry, Acoustic Flow Cytometry), By Application (Immunophenotyping, Cell Sorting, Drug Discovery, Clinical Diagnostics), By End-User & Forecast 2026-2034

Report Overview
| Market Size (2025) | Forecast Value (2034) | CAGR (2026–2034) | Largest Region (2025) |
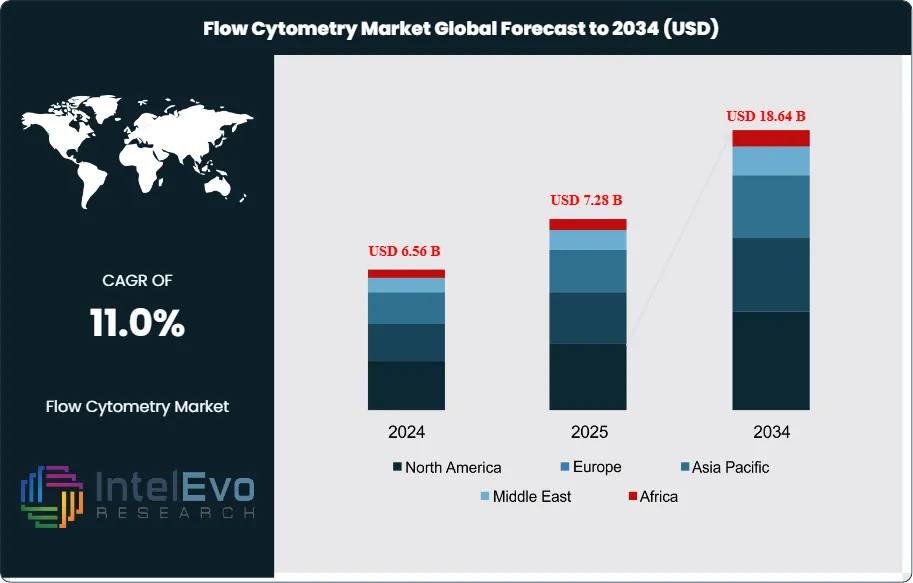
| USD 7.28 Billion | USD 18.64 Billion | 11.0% | North America, 40.8% |
The Flow Cytometry Market was valued at approximately USD 6.56 Billion in 2024 and reached USD 7.28 Billion in 2025. The market is projected to grow to USD 18.64 Billion by 2034, expanding at a CAGR of 11.0% during the forecast period from 2026 to 2034. This represents an absolute dollar opportunity of USD 11.36 Billion over the analysis period, driven by accelerating cell and gene therapy development programs, expanding clinical immunology applications, and the widespread adoption of high-parameter spectral flow cytometry platforms enabling 30 to 60-color simultaneous cell characterization.
Get More Information about this report -
Request Free Sample ReportFlow cytometry is a laser-based biophysical technology that enables rapid, multiparameter analysis of physical and chemical characteristics of cells or particles suspended in a fluid stream. As individual cells pass through one or multiple laser interrogation points, scattered light and emitted fluorescence signals are captured by photodetectors, generating quantitative data on cell size (forward scatter), granularity (side scatter), and up to 80+ fluorochrome-conjugated marker expressions simultaneously. The technology serves as a cornerstone analytical platform across immunology research, oncology diagnostics, hematology, cell therapy manufacturing quality control, and drug discovery — applications collectively representing a global installed base exceeding 48,000 flow cytometers in research and clinical settings as of 2025. The FDA's accelerated approval pathway for CAR-T cell therapies and the ICH Q5A cell therapy manufacturing guidelines both require flow cytometric immunophenotyping as a mandatory release testing criterion, directly anchoring clinical-grade cytometer demand to the cell and gene therapy manufacturing sector.
The flow cytometry market is undergoing a technology generation shift driven by spectral cytometry. Conventional filter-based flow cytometry separates fluorochrome emissions through bandpass optical filters into dedicated detectors, limiting the number of simultaneously detectable parameters by spectral overlap between adjacent fluorochromes. Spectral flow cytometry instead captures the full emission spectrum of each fluorochrome across an array of 32 to 64 detectors and uses computational spectral unmixing to deconvolve individual fluorochrome contributions — enabling panel sizes of 40 to 64+ colors on a single instrument that would be physically impossible with conventional filter configurations. Cytek Biosciences' Aurora platform pioneered commercial spectral cytometry at accessible price points below USD 200,000, triggering rapid adoption across academic research centers and biotech companies. Spectral cytometry platform revenue grew at 34.8% CAGR between 2021 and 2025, and now represents 28.4% of total flow cytometry instrument revenue in 2025 at USD 584 Million.
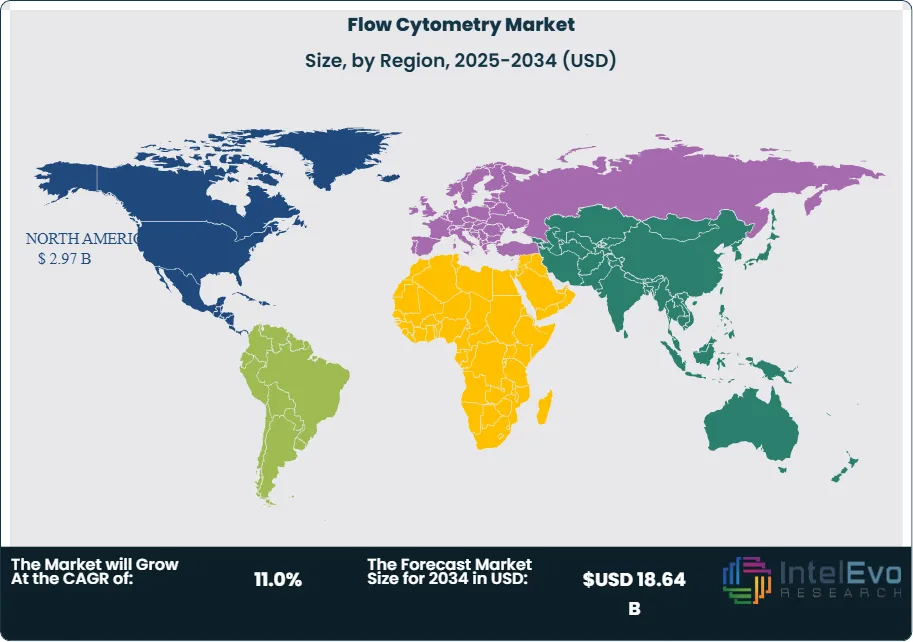
Reagents, kits, and consumables constitute the largest product segment by revenue at 48.6% of the market at USD 3.54 Billion in 2025, reflecting the high recurring revenue intensity of the flow cytometry business model. Each flow cytometry experiment requires fluorochrome-conjugated antibodies, viability dyes, calibration beads, and sheath fluid consumables — creating an annuity revenue stream per installed instrument of USD 18,000–85,000 annually depending on instrument utilization and panel complexity. This consumable pull-through dynamic makes reagent portfolio breadth and instrument-reagent ecosystem integration a primary competitive priority for instrument manufacturers, driving Thermo Fisher's USD 285 Million acquisition of Proteome Sciences' antibody portfolio in August 2025. North America leads the market at 40.8% of global revenue at USD 2.97 Billion in 2025, with the United States' NIH-funded research infrastructure, FDA-regulated cell therapy manufacturing sector, and hospital clinical immunology laboratory networks collectively anchoring the world's largest flow cytometry demand base.
Cell and gene therapy development is the most powerful growth catalyst in the flow cytometry market. A single CAR-T cell therapy manufacturing batch requires 8–14 flow cytometry quality control release tests covering T-cell phenotype, viability, potency, sterility markers, and identity confirmation — generating USD 12,000–28,000 in cytometry reagent consumption per patient batch. With global approved CAR-T annual treatment volumes reaching 48,000 patients in 2025 and projected to exceed 180,000 by 2030 as manufacturing scale-up and reimbursement access expand, cell therapy-driven cytometry reagent consumption represents an addressable market growing at 24.6% CAGR. The European Medicines Agency's ATMP manufacturing framework and the FDA's RMAT designation pathway for cell therapies each incorporate flow cytometric characterization requirements that create non-discretionary instrument and reagent procurement at cell therapy CDMOs including Lonza, Samsung Biologics, and Catalent Cell and Gene.
, By Technology (Spectral Flow Cytometry, Imaging Flow Cytometry, Mass Cytometry, Acoustic Flow Cytometry), By Application (Immunophenotyping, Cell Sorting, Drug Discovery, Clinical Diagnostics), By End-User & Forecast 2026-2034")
Key Takeaways
- Market Growth: The global flow cytometry market was valued at USD 7.28 Billion in 2025 and is projected to reach USD 18.64 Billion by 2034, growing at a CAGR of 11.0% over the 2026–2034 forecast period.
- Segment Dominance: By product, reagents, kits, and consumables lead the flow cytometry market at 48.6% of global revenue in 2025, driven by high per-instrument annual consumable consumption rates of USD 18,000–85,000 and the proliferation of multi-color antibody panel kits across immunophenotyping and cell therapy quality control applications.
- Segment Dominance: By application, immunophenotyping is the largest application segment at 32.4% of global flow cytometry revenue in 2025, anchored by HIV/AIDS CD4 count monitoring, hematological malignancy diagnosis by WHO classification criteria, CAR-T cell therapy characterization, and transplant immune monitoring protocols across hospital clinical laboratories globally.
- Driver: The global cell and gene therapy pipeline expanded to 3,800+ active clinical programs in 2025, each requiring flow cytometric characterization for manufacturing release, safety assessment, and pharmacodynamic monitoring — generating direct instrument and reagent demand at CDMOs, hospital cell therapy centers, and biopharmaceutical quality control laboratories that is growing at 24.6% CAGR.
- Restraint: High instrument acquisition costs averaging USD 80,000–650,000 for research-grade cytometers and USD 180,000–1.2 Million for clinical-grade cell sorters, combined with 6–18 month capital equipment procurement cycles at academic and hospital institutions, limit adoption velocity particularly in Asia Pacific and Latin America where budget allocation processes extend decision timelines by 40–65% versus North American benchmarks.
- Opportunity: Integration of flow cytometry with single-cell multi-omics platforms — enabling simultaneous protein and transcriptomic profiling of identical cell populations through CITE-seq, REAP-seq, and spectral cytometry index sorting — represents an addressable premium instrument and reagent market of USD 2.1 Billion by 2034, growing at 18.4% CAGR as spatial and single-cell biology becomes the dominant research paradigm in immunology and oncology.
- Trend: Artificial intelligence and machine learning integration into flow cytometry data analysis platforms is reducing manual gating time by 68–84% and improving rare-event detection sensitivity by 2–4 fold, with AI-assisted gating tools reaching 44.2% adoption among research flow cytometry users in 2025 — redefining throughput economics and enabling population detection below 0.001% frequency that manual analysis cannot reliably achieve.
- Regional Analysis: North America leads the global flow cytometry market with a 40.8% share at USD 2.97 Billion in 2025, underpinned by NIH research funding exceeding USD 47.2 Billion annually, the highest CAR-T therapy manufacturing capacity globally, and the FDA's mandatory flow cytometry release testing requirements for approved cell therapy products.
Competitive Landscape Overview
The flow cytometry market is highly consolidated, with the top four vendors — Becton Dickinson, Beckman Coulter (Danaher), Thermo Fisher Scientific, and Bio-Rad Laboratories — collectively accounting for approximately 62.4% of global market revenue in 2025. Competition is technology-driven at the high-parameter instrument tier, centered on laser configuration, detector count, spectral unmixing algorithm performance, and software-driven user experience. In the reagent and consumable segment, competition is determined by antibody catalog breadth, fluorochrome-conjugate portfolio depth, and panel optimization support quality. The market has experienced meaningful technology disruption from Cytek Biosciences, whose Aurora spectral cytometer platform has captured significant share in the research instrument segment through an accessible price-point strategy that democratized high-parameter cytometry below the USD 200,000 threshold. BD's acquisition strategy and Thermo Fisher's reagent portfolio expansion reflect incumbent responses to this competitive pressure and the structural demand pull from cell therapy manufacturing applications.
Competitive Landscape Matrix
| Company | HQ | Position | Key Product | Geo Strength | Recent Move (2024–2026) |
| Becton, Dickinson (BD) | USA | Leader | BD FACSymphony A5 SE | North America / Europe | Launched BD FACSDiscover S8 spectral cell sorter with AI-guided compensation, Feb 2025 |
| Beckman Coulter (Danaher) | USA | Leader | CytoFLEX SRT Benchtop Sorter | North America / Europe | Released CytoFLEX LX with 6-laser 80-parameter configuration, May 2025 |
| Thermo Fisher Scientific | USA | Leader | Attune CytPix Acoustic Cytometer | Global | Acquired Proteome Sciences flow cytometry reagent portfolio for USD 285M, Aug 2025 |
| Bio-Rad Laboratories | USA | Challenger | ZE5 Cell Analyzer | North America / Europe | Launched ZE5 YETI 5-laser spectral analyzer targeting mid-size research labs, Jan 2025 |
| Sony Biotechnology | Japan | Challenger | SH800S Cell Sorter | Asia Pacific / Europe | Released MA900 Multi-Application Cell Sorter with 4-laser configuration, Apr 2025 |
| Luminex (DiaSorin) | USA | Challenger | FLEXMAP 3D Multiplexing System | North America | Integrated AI-driven bead-based multiplexing for 500-analyte panels, Jul 2025 |
| Miltenyi Biotec | Germany | Niche Player | MACSQuant Tyto Sorter | Europe / North America | Launched MACSQuant 16 analyzer for high-throughput immunophenotyping, Oct 2025 |
| Cytek Biosciences | USA | Niche Player | Aurora Spectral Cytometer | North America / Europe | Expanded Aurora CS spectral cell sorter to 64-color configuration, Dec 2025 |
By Product
The flow cytometry market by product is led by reagents, kits, and consumables, which account for 48.6% of global revenue at USD 3.54 Billion in 2025. This segment encompasses fluorochrome-conjugated antibodies, viability dyes (propidium iodide, 7-AAD, DAPI, and amine-reactive dyes), intracellular staining kits, calibration and compensation beads, sheath fluid, and pre-optimized multi-color immunophenotyping panel kits. The recurring revenue intensity of this segment reflects the high consumable consumption per instrument: a single BD FACSLyric running 20 patient samples daily consumes approximately USD 38,000–54,000 in reagents annually. Reagent revenue grows proportionally with installed base expansion and panel parameter count increases — high-parameter spectral cytometry panels require 30–60 antibody-fluorochrome conjugates per assay versus 8–12 for conventional 4-color clinical panels, multiplying per-run reagent costs by 3–5 fold.
Cell analyzers (flow cytometers) represent 28.4% of market revenue at USD 2.07 Billion in 2025, spanning entry-level 4-color benchtop analyzers priced at USD 35,000–80,000 through 80-parameter research analyzers exceeding USD 650,000. Instrument replacement cycles of 6–10 years and the capital-intensive nature of high-parameter platform upgrades create concentrated demand peaks around generational technology transitions — the current shift from conventional to spectral cytometry is driving an upgrade wave across the North American and European research installed base. Cell sorters represent 12.8% of revenue at USD 932 Million, commanding the highest per-instrument price points at USD 180,000–1.2 Million for multi-laser cell sorters with 4-way sorting capability. Software and data analysis tools account for 6.4% at USD 466 Million, a segment growing at 18.3% CAGR as cloud-based cytometry data management and AI-assisted gating platforms generate subscription revenue independent of instrument upgrade cycles. Accessories and consumables represent the remaining 3.8% at USD 277 Million.
By Technology
Conventional multi-color flow cytometry retains the largest technology share at 54.6% of global revenue at USD 3.98 Billion in 2025, reflecting the decades-deep installed base of conventional filter-based instruments in clinical laboratories, hospital hematology departments, and established academic research cores. Clinical-grade conventional cytometers including the BD FACSLyric, Beckman Coulter DxFLEX, and Sysmex CyFlow Cube are entrenched in hospital immunology and hematopathology workflows governed by CLIA regulations, CAP accreditation requirements, and ISO 15189 medical laboratory standards — regulatory environments that favor validated incumbent platforms over rapid technology transitions. Clinical laboratory procurement cycles of 5–8 years and the cost of re-validating assays on new instrument platforms sustain conventional cytometry revenue even as research applications shift toward spectral systems.
Spectral flow cytometry holds 28.4% of instrument revenue at USD 584 Million in 2025 and is growing at 22.6% CAGR — the fastest instrument technology growth rate. Platforms from Cytek (Aurora), BD (FACSymphony with spectral upgrade), Beckman Coulter (CytoFLEX SRT spectral), and Sony Biotechnology (ID7000 spectral) are replacing conventional high-parameter research cytometers by enabling panel sizes of 40–64 colors on instruments priced USD 150,000–400,000. Imaging flow cytometry accounts for 8.4% of instrument revenue at USD 173 Million, combining flow cytometry throughput (1,000–10,000 cells per second) with fluorescence microscopy image capture to provide morphological data alongside population phenotype statistics. Mass cytometry (CyTOF) represents 4.8% at USD 99 Million, using metal-isotope labeled antibodies to achieve 40–60 parameter detection without spectral overlap — but requiring cell fixation that eliminates viability and precludes cell recovery. Acoustic flow cytometry accounts for the remaining 3.8% at USD 78 Million in 2025.
By Application
Immunophenotyping is the dominant application in the flow cytometry market, representing 32.4% of global revenue at USD 2.36 Billion in 2025. Clinical immunophenotyping encompasses CD4/CD8 T-cell subset enumeration for HIV management (approximately 38 million HIV patients requiring monitoring globally), hematological malignancy classification per the WHO Classification of Tumors of Haematopoietic and Lymphoid Tissues (5th edition, 2022), minimal residual disease (MRD) detection in acute leukemia, and transplant immune monitoring. Research immunophenotyping encompasses high-dimensional immune cell subset characterization in oncology, autoimmunity, and infectious disease studies using panels of 20–60 markers. Clinical immunophenotyping alone generates approximately USD 1.12 Billion in annual reagent consumption across global hospital laboratory networks.
Cell viability and apoptosis assays account for 16.8% of revenue at USD 1.22 Billion in 2025, serving drug discovery screening, cell therapy viability release testing, and cytotoxicity assay workflows. Cell sorting and isolation represents 14.6% at USD 1.06 Billion — the application segment with the highest instrument ASP intensity, as preparative cell sorting requires high-speed cell sorters priced USD 200,000–1.2 Million. Drug discovery and screening accounts for 12.2% at USD 889 Million, with high-throughput flow cytometry systems processing 96 and 384-well plates at 10,000–50,000 cells per well driving pharmaceutical compound library screening. Cytokine and intracellular protein detection represents 10.4% at USD 757 Million; cell proliferation and cycle analysis 8.6% at USD 626 Million; rare event detection 3.2% at USD 233 Million; and clinical diagnostics the remaining 1.8% at USD 131 Million in 2025.
By End-User
Academic and research institutes constitute the largest end-user segment in the flow cytometry market at 38.4% of global revenue at USD 2.80 Billion in 2025. Universities, government research institutes (NIH intramural, INSERM, RIKEN, CSIR), and independent research centers operate shared flow cytometry core facilities that centralize instrument access across multiple principal investigator groups. NIH-funded flow cytometry research in the United States generated USD 2.84 Billion in grant-supported cytometry consumable expenditure in FY2024, with the National Cancer Institute and National Institute of Allergy and Infectious Diseases collectively representing the largest funding channels. Academic shared resource core facilities are the primary early adoption sites for new platform technologies including spectral cytometry and imaging flow cytometry, creating technology demonstration reference sites that accelerate commercial adoption.
Biopharmaceutical and biotechnology companies represent 29.6% of market revenue at USD 2.16 Billion in 2025, the fastest-growing end-user segment at 14.8% CAGR, driven by cell therapy manufacturing QC demand, biologics drug discovery screening, and immune monitoring in clinical trials. Hospitals and diagnostic laboratories account for 22.4% at USD 1.63 Billion, primarily consuming conventional clinical cytometers and validated clinical diagnostic reagent kits. Contract research organizations represent 6.2% at USD 452 Million, providing flow cytometry services to pharmaceutical companies on a fee-for-service basis. Blood banks and cell therapy centers account for the remaining 3.4% at USD 248 Million, with cell therapy manufacturing QC representing the fastest-growing sub-segment within this category at 28.4% CAGR.
Regional Analysis
North America
North America leads the global flow cytometry market with a 40.8% share at USD 2.97 Billion in 2025. The United States accounts for 88.4% of North American revenue at USD 2.63 Billion, supported by the world's largest biomedical research funding infrastructure — NIH allocating USD 47.2 Billion in research funding in FY2025 — and the highest concentration of cell and gene therapy manufacturing facilities globally. The FDA's RMAT designation pathway and accelerated approval processes have enabled 12 CAR-T and TCR-T cell therapy products to reach US market approval through 2025, each requiring mandatory flow cytometric characterization throughout manufacturing, clinical trial immune monitoring, and commercial lot release testing. Academic medical centers including MD Anderson Cancer Center, Memorial Sloan Kettering, and Dana-Farber Cancer Institute operate flow cytometry core facilities with 8–24 instrument configurations serving both research and clinical programs. Canada contributes 8.2% of North American revenue, with the Canadian Cancer Society and CIHR funding base supporting cytometry research. The US remains the primary technology adoption market for novel platforms, with Cytek Aurora, BD FACSDiscover, and Beckman CytoFLEX LX all achieving initial commercial traction through North American research institution placements before European and Asian expansion.
Europe
Europe holds 28.6% of global flow cytometry revenue at USD 2.08 Billion in 2025. Germany is the largest European market at 22.4% of European revenue at USD 466 Million, driven by the country's concentration of world-class research institutes (Max Planck Society, Helmholtz Association, Deutsche Krebsforschungszentrum), pharmaceutical company R&D centers (Bayer, Boehringer Ingelheim, Merck KGaA), and the European Leukemia Net (ELN) standardized flow cytometry protocols mandating specific instrument and reagent configurations across member institutions. The UK contributes 19.8% of European revenue at USD 412 Million, with the Wellcome Sanger Institute, Francis Crick Institute, and CRUK research programs representing major cytometry consumers, and NHS hospital pathology networks operating 280+ clinical cytometers for hematopathology diagnostics. France represents 16.2% of European revenue at USD 337 Million, with INSERM-funded research and the Institut Curie network driving academic cytometry demand. The Netherlands accounts for 11.4%, anchored by Erasmus MC and the Princess Maxima Center for pediatric oncology. The EMA's ATMP framework and the European Medicines Agency's GMP guidelines for advanced therapy medicinal products impose flow cytometric characterization requirements on European cell therapy manufacturing, sustaining clinical-grade cytometer demand at CDMOs and hospital cell therapy units.
Asia Pacific
Asia Pacific accounts for 20.4% of global flow cytometry revenue at USD 1.49 Billion in 2025, growing at 13.8% CAGR — the fastest regional rate — driven by expanding biomedical research investment, rapidly growing cell therapy manufacturing sectors, and government-led healthcare infrastructure modernization across China, Japan, India, and South Korea. China is the largest APAC market at 42.6% of regional revenue at USD 635 Million in 2025, with the National Natural Science Foundation of China (NSFC) and the Ministry of Science and Technology funding cytometry-intensive immunology and oncology research programs at a scale second only to the United States. China's domestic cell and gene therapy pipeline has grown to 460+ IND applications for CAR-T and gene editing therapies, each generating flow cytometry QC demand. Japan contributes 22.4% of APAC revenue at USD 334 Million, with RIKEN, the National Cancer Center, and AMED-funded research programs representing primary instrument consumers. India represents 14.8% at USD 221 Million, with growing clinical diagnostic cytometry demand at AIIMS, CMC Vellore, and Tata Memorial Hospital networks, supported by increasing NIH-funded international collaboration grants. South Korea accounts for 11.6% at USD 173 Million, with Samsung Medical Center and Asan Medical Center operating advanced clinical flow cytometry programs.
Latin America
Latin America holds 6.4% of global flow cytometry revenue at USD 466 Million in 2025. Brazil dominates the regional market at 52.4% of LATAM revenue at USD 244 Million, supported by FAPESP and CNPq research funding that has established flow cytometry core facilities at USP, UNICAMP, and FIOCRUZ among the most sophisticated in Latin America. FIOCRUZ's immunology research programs, HIV surveillance networks, and dengue fever immunological monitoring represent major cytometry reagent consumers. ANVISA regulatory requirements for cell therapy products — aligned with ICH Q5A guidelines — are driving flow cytometry adoption at Brazilian academic medical centers beginning cell therapy clinical programs. Mexico represents 28.6% of LATAM revenue at USD 133 Million, with UNAM and Instituto Nacional de Cancerología driving academic demand. Argentina contributes 8.4% at USD 39 Million, primarily through CONICET-funded research institutes. Regional adoption is constrained by currency volatility affecting USD-denominated instrument and reagent import costs and by limited flow cytometry operator training capacity outside major metropolitan research centers.
Middle East & Africa
The Middle East and Africa region accounts for 3.8% of global flow cytometry revenue at USD 277 Million in 2025. The UAE leads regional flow cytometry adoption at 32.4% of MEA revenue at USD 90 Million, with Cleveland Clinic Abu Dhabi, Sidra Medicine in Qatar, and King's College Hospital Dubai operating advanced clinical flow cytometry programs comparable in sophistication to European academic medical center configurations. Saudi Arabia contributes 28.6% of MEA revenue at USD 79 Million, with King Faisal Specialist Hospital and Research Centre in Riyadh operating the region's most comprehensive flow cytometry clinical and research programs, and Vision 2030 healthcare investment driving cytometer installation at new regional hospitals. South Africa represents 22.4% of MEA revenue at USD 62 Million, anchored by the National Health Laboratory Service's national CD4 testing network for HIV monitoring, which operates the largest clinical flow cytometry network on the African continent — processing approximately 6.8 million CD4 tests annually. Regional market growth is supported by WHO and PEPFAR HIV program funding for CD4 cytometry infrastructure in Sub-Saharan Africa, though overall regional market development remains constrained by healthcare infrastructure and trained operator availability outside major urban centers.
Get More Information about this report -
Request Free Sample ReportMarket Key Segments
By Product
- Cell Analyzers (Flow Cytometers)
- Cell Sorters
- Reagents & Kits
- Software & Data Analysis Tools
- Accessories & Consumables
By Technology
- Conventional / Multi-Color Flow Cytometry
- Spectral Flow Cytometry
- Imaging Flow Cytometry
- Mass Cytometry (CyTOF)
- Acoustic Flow Cytometry
By Application
- Immunophenotyping
- Cell Viability & Apoptosis
- Cell Proliferation & Cycle Analysis
- Rare Event Detection
- Cytokine & Intracellular Protein Detection
- Cell Sorting & Isolation
- Drug Discovery & Screening
- Clinical Diagnostics
By End-User
- Academic & Research Institutes
- Biopharmaceutical & Biotechnology Companies
- Hospitals & Diagnostic Laboratories
- Contract Research Organizations (CROs)
- Blood Banks & Cell Therapy Centers
By Regional Coverage
- North America
- Latin America
- East Asia And Pacific
- Sea And South Asia
- Eastern Europe
- Western Europe
- Middle East & Africa
| Report Attribute | Details |
| Market size (2025) | USD 7.28 B |
| Forecast Revenue (2034) | USD 18.64 B |
| CAGR (2025-2034) | 11.0% |
| Historical data | 2021-2024 |
| Base Year For Estimation | 2025 |
| Forecast Period | 2026-2034 |
| Report coverage | Revenue Forecast, Competitive Landscape, Market Dynamics, Growth Factors, Trends and Recent Developments |
| Segments covered | By Product (Cell Analyzers (Flow Cytometers), Cell Sorters, Reagents & Kits, Software & Data Analysis Tools, Accessories & Consumables), By Technology (Conventional / Multi-Color Flow Cytometry, Spectral Flow Cytometry, Imaging Flow Cytometry, Mass Cytometry (CyTOF), Acoustic Flow Cytometry), By Application (Immunophenotyping, Cell Viability & Apoptosis, Cell Proliferation & Cycle Analysis, Rare Event Detection, Cytokine & Intracellular Protein Detection, Cell Sorting & Isolation, Drug Discovery & Screening, Clinical Diagnostics), By End-User (Academic & Research Institutes, Biopharmaceutical & Biotechnology Companies, Hospitals & Diagnostic Laboratories, Contract Research Organizations (CROs), Blood Banks & Cell Therapy Centers) |
| Research Methodology |
|
| Regional scope |
|
| Competitive Landscape | BECTON, DICKINSON AND COMPANY (BD BIOSCIENCES), BECKMAN COULTER LIFE SCIENCES (DANAHER CORPORATION), THERMO FISHER SCIENTIFIC, CYTEK BIOSCIENCES, BIO-RAD LABORATORIES, SONY BIOTECHNOLOGY, LUMINEX CORPORATION (DIASORIN), MILTENYI BIOTEC, SYSMEX CORPORATION, BIOLEGEND (REVVITY), AGILENT TECHNOLOGIES (NOVOCYTE), STRATEDIGM, ESSEN BIOSCIENCE (SARTORIUS), PROPEL LABS, CELESTA (FORMERLY BD ACCURI), UNION BIOMETRICA, APOGEE FLOW SYSTEMS, OTHERS |
| Customization Scope | Customization for segments, region/country-level will be provided. Moreover, additional customization can be done based on the requirements. |
| Pricing and Purchase Options | Avail customized purchase options to meet your exact research needs. We have three licenses to opt for: Single User License, Multi-User License (Up to 5 Users), Corporate Use License (Unlimited User and Printable PDF). |
, By Technology (Spectral Flow Cytometry, Imaging Flow Cytometry, Mass Cytometry, Acoustic Flow Cytometry), By Application (Immunophenotyping, Cell Sorting, Drug Discovery, Clinical Diagnostics), By End-User & Forecast 2026-2034")
, By Technology (Spectral Flow Cytometry, Imaging Flow Cytometry, Mass Cytometry, Acoustic Flow Cytometry), By Application (Immunophenotyping, Cell Sorting, Drug Discovery, Clinical Diagnostics), By End-User & Forecast 2026-2034")
, By Technology (Spectral Flow Cytometry, Imaging Flow Cytometry, Mass Cytometry, Acoustic Flow Cytometry), By Application (Immunophenotyping, Cell Sorting, Drug Discovery, Clinical Diagnostics), By End-User & Forecast 2026-2034")
Frequently Asked Questions
How big is the Flow Cytometry Market?
The Global Flow Cytometry Market was valued at USD 6.56 Billion in 2024 and is projected to reach USD 18.64 Billion by 2034, growing at a CAGR of 11.0% from 2026 to 2034, driven by rising adoption in immunology, oncology, cell therapy research, and increasing demand for high-throughput cell analysis technologies in clinical diagnostics and biotechnology applications.
Who are the major players in the Flow Cytometry Market?
BECTON, DICKINSON AND COMPANY (BD BIOSCIENCES), BECKMAN COULTER LIFE SCIENCES (DANAHER CORPORATION), THERMO FISHER SCIENTIFIC, CYTEK BIOSCIENCES, BIO-RAD LABORATORIES, SONY BIOTECHNOLOGY, LUMINEX CORPORATION (DIASORIN), MILTENYI BIOTEC, SYSMEX CORPORATION, BIOLEGEND (REVVITY), AGILENT TECHNOLOGIES (NOVOCYTE), STRATEDIGM, ESSEN BIOSCIENCE (SARTORIUS), PROPEL LABS, CELESTA (FORMERLY BD ACCURI), UNION BIOMETRICA, APOGEE FLOW SYSTEMS, OTHERS
Which segments covered the Flow Cytometry Market?
By Product (Cell Analyzers (Flow Cytometers), Cell Sorters, Reagents & Kits, Software & Data Analysis Tools, Accessories & Consumables), By Technology (Conventional / Multi-Color Flow Cytometry, Spectral Flow Cytometry, Imaging Flow Cytometry, Mass Cytometry (CyTOF), Acoustic Flow Cytometry), By Application (Immunophenotyping, Cell Viability & Apoptosis, Cell Proliferation & Cycle Analysis, Rare Event Detection, Cytokine & Intracellular Protein Detection, Cell Sorting & Isolation, Drug Discovery & Screening, Clinical Diagnostics), By End-User (Academic & Research Institutes, Biopharmaceutical & Biotechnology Companies, Hospitals & Diagnostic Laboratories, Contract Research Organizations (CROs), Blood Banks & Cell Therapy Centers)
How can this market research report help my business make strategic decisions?
Our market research reports provide actionable intelligence, including verified market size data, CAGR projections, competitive benchmarking, and segment-level opportunity analysis. These insights support strategic planning, investment decisions, product development, and market entry strategies for enterprises and startups alike.
How frequently is the data updated?
We continuously monitor industry developments and update our reports to reflect regulatory changes, technological advancements, and macroeconomic shifts. Updated editions ensure you receive the latest market intelligence.

Select Licence Type
Connect with our sales team
Why IntelEvoResearch
100%
Customer
Satisfaction
24x7+
Availability - we are always
there when you need us
200+
Fortune 50 Companies trust
IntelEvoResearch
80%
of our reports are exclusive
and first in the industry
100%
more data
and analysis
1000+
reports published
till date