Fraud Detection and Prevention Market Size, Growth & Forecast 2034
Global Fraud Detection and Prevention Market Size, Share, and Growth Analysis by Component (Solutions, Services), by Technology (AI & Machine Learning, Big Data Analytics, Biometrics, Behavioral Analytics), by Deployment Mode (Cloud-Based, On-Premise), by Application (Payment Fraud, Identity Theft, Cyber Fraud, Insurance Fraud), by End User (Banking & Financial Services, Retail & E-commerce, Healthcare, Government), Regional Outlook, Competitive Landscape, Market Dynamics, Trends, and Forecast 2025–2034
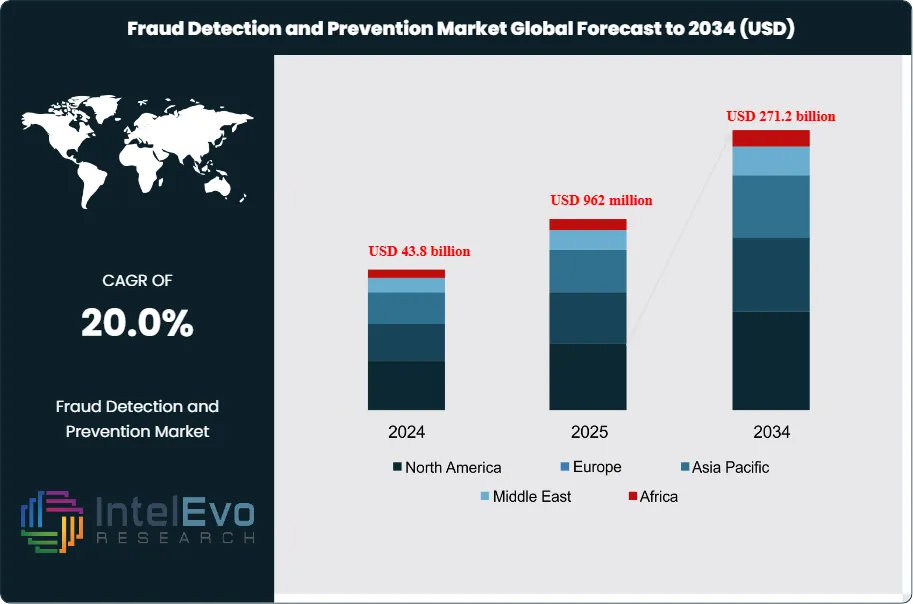
The Fraud Detection and Prevention Market is estimated at USD 43.8 billion in 2024 and is on track to reach roughly USD 271.2 billion by 2034, implying a compound annual growth rate of 20.0% over 2025–2034. This rapid expansion is driven by the surge in digital transactions, real-time payments, and e-commerce activities, which have significantly increased exposure to cyber fraud and financial crimes. Growing adoption of AI, machine learning, and behavioral analytics across banking, retail, healthcare, and government sectors is further accelerating demand. As regulatory scrutiny tightens and fraud techniques become more sophisticated, organizations are prioritizing advanced, scalable fraud prevention platforms as a core component of their digital risk management strategies.
Rising digital transaction volumes, real-time payment rails, and cross-border e-commerce expand the attack surface for financial crime and drive demand for advanced fraud controls. Banks, insurers, payment processors, and fintechs account for an estimated 35% of global FDP spending, while e-commerce and retail represent about 20%, underscoring the role of high-velocity, card-not-present transactions.
On the supply side, the market is consolidating around analytics-led platforms that integrate risk scoring, identity verification, and case management. Vendors embed artificial intelligence and machine learning to screen data streams in milliseconds, lifting model hit rates by 20–30% and cutting false positives by up to 25%. Cloud deployments represent roughly 55% of new projects, supported by subscription pricing that improves affordability and speeds implementation for mid-market enterprises.
Regulation is a central growth driver. Data protection regimes, anti-money laundering directives, and real-time payment rules in North America, Europe, and Asia-Pacific mandate stronger transaction monitoring and customer due diligence. Non-compliance can trigger penalties that reach 3–4% of annual revenue in some jurisdictions, strengthening the case for modern FDP investment. At the same time, stricter privacy rules and data-localization requirements increase integration complexity and push vendors to offer regional data residency, privacy-by-design analytics, and explainable AI.
Risk dynamics remain fluid as fraudsters use automation, deepfakes, and synthetic identities. Account takeover, first-party fraud, and application fraud in digital lending and BNPL channels grow at double-digit rates, forcing institutions to refresh detection models often and link identity proofing with transaction monitoring. Implementation challenges persist, including model governance, integration with legacy cores, and shortages of analytics talent, which can delay enterprise-wide rollouts.
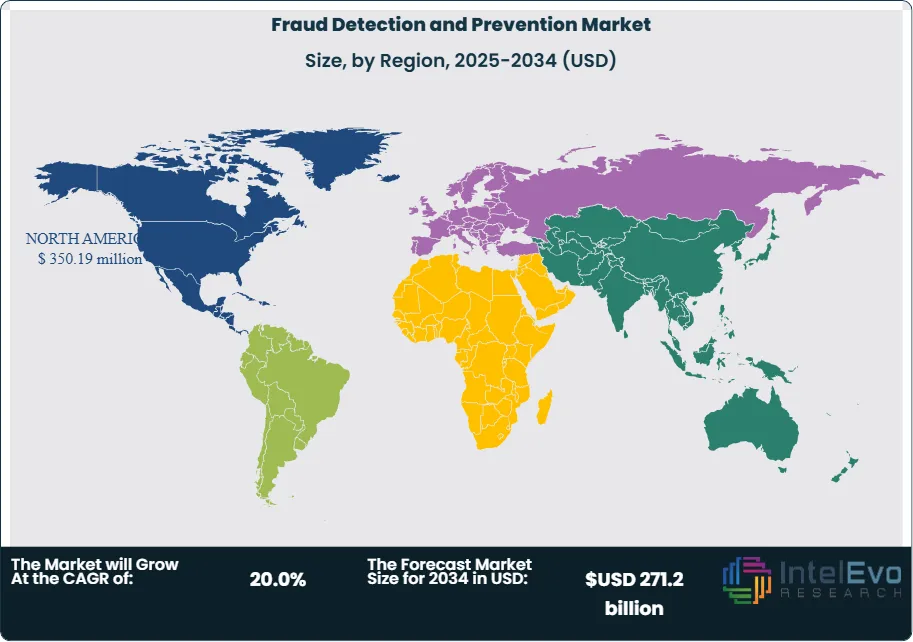
Regionally, North America contributes 35% of FDP revenue, supported by mature card markets and strong enforcement, while Europe holds 27% with a focus on authentication and AML compliance. Asia-Pacific is the fastest-growing region, with an expected CAGR above 23% as mobile payments and super-app ecosystems drive investment in scalable, cloud-native FDP platforms. Emerging hotspots in Latin America, the Middle East, and Africa adopt fraud-as-a-service and shared-utility models to spread costs and gain access to advanced analytics capabilities.
Key Takeaways
Market Growth: The Fraud Detection and Prevention (FDP) market grows from USD 43.8 billion in 2024 to USD 271.2 billion by 2034, reflecting a 20.0% CAGR, 2024-2034.
Segment Dominance : Solutions such as fraud analytics, governance, risk and compliance, and authentication systems command 66.1% market share, 2023. Vendors in this segment deepen functionality and integration to defend this 66.1% share, 2023.
Segment Dominance: Payment fraud leads FDP use cases with 47.5% share, 2023 as online banking, e-commerce, and digital wallets accelerate exposure.
Driver: Rising transaction volumes in BFSI and digital commerce drive a 20.0% CAGR, 2024-2034 in FDP spending as institutions seek to protect high-value flows.
Restraint: High upfront and integration costs limit adoption among small and mid-sized enterprises, leading to estimated: 0.8 billion USD, 2024 in postponed FDP investments.
Opportunity: Cloud-native and modular FDP platforms unlock estimated: 5.0 billion USD, 2024 in incremental opportunity, particularly for subscription-based offerings to mid-market firms.
Trend: Large enterprises account for 72.8% of FDP adoption, 2023, while the BFSI sector holds 27.6% share, 2023, showing a trend toward complex, enterprise-wide risk architectures.
Regional Analysis: North America leads with 43.1% market share, 2023, supported by mature digital infrastructure and strong regulatory oversight. Asia-Pacific and other emerging regions track an estimated: 22.0% CAGR, 2024-2034 as digital payment volumes grow.
By Component
The market in 2025 continues to show a strong shift toward solution-based platforms as enterprises respond to rising fraud risk across digital channels. Solutions account for more than 66 percent of global spending in 2024 and maintain the largest share in 2025 as organizations prioritize fraud analytics, governance, risk and compliance systems, and identity authentication tools. These platforms support real-time analysis, automated case management, and identity assurance, which are now baseline requirements for financial institutions and large enterprises facing high transaction volumes.
Demand for solutions accelerates as fraud patterns grow more complex. Companies deploy machine learning engines and behavioral analytics to reduce false positives and identify hidden anomalies in data streams. Adoption increases across banking, telecom, healthcare, and retail as firms transition from manual review processes to automated models that improve detection accuracy. Authentication systems also gain importance, especially as biometric verification and multi-factor authentication become standard in regulated industries.
Service providers expand their roles as enterprises seek support for implementation, threat monitoring, and compliance management. Managed services report double-digit growth in 2025 as companies pursue continuous monitoring without expanding in-house teams. Professional services remain essential for architecture design, regulatory alignment, and model calibration. Together, services complement core solutions and enable organizations to operate fraud programs with higher efficiency.
By Application
Payment fraud continues to hold the largest application share, maintaining more than 47 percent of deployments in 2024 and 2025. Growth aligns with rapid expansion in e-commerce, instant payments, and digital wallets across Asia Pacific, North America, and Europe. The rise of unauthorized transactions and card-not-present fraud pressures banks and merchants to adopt real-time screening tools. AI-enabled scoring models and transaction risk engines help institutions detect suspicious activity within milliseconds.
Money laundering monitoring advances quickly as financial regulators strengthen enforcement activity. Banks invest in compliance analytics to meet tighter AML obligations and reduce audit penalties. Identity theft also expands as attackers exploit stolen credentials and synthetic identities. This increases demand for identity analytics, biometric verification, and device intelligence across telecom, insurance, and digital finance platforms.
Other applications such as account takeover detection and insider risk monitoring gain traction as enterprises digitize workflows. Organizations use event correlation, access monitoring, and user-behavior analytics to reduce internal vulnerabilities. Broadening application areas indicate a strategic shift from isolated fraud prevention to enterprise-wide risk programs.
By Enterprise Size
Large enterprises remain the primary adopters, representing more than 72 percent of global spending in 2024 and retaining dominance through 2025. Their scale, regulatory exposure, and distributed operations create a critical need for advanced fraud systems. These organizations process high-volume transactions and require machine learning engines, cloud-based analytics, and automated compliance platforms to support real-time decisioning. They also manage complex IT environments, which makes integrated fraud architectures essential.
Small and medium enterprises show rising adoption in 2025 as cloud platforms reduce deployment costs. SMEs increasingly adopt subscription-based FDP tools tailored for e-commerce, fintech, and digital service providers. Growth is strongest in Southeast Asia, Latin America, and the Middle East, where online retail expansion increases exposure to fraud. Even with this momentum, SMEs continue to face budget constraints and limited in-house expertise, which slows adoption in highly regulated segments.
Overall, enterprise size dictates technology maturity. Large enterprises lead deployments of predictive analytics and behavioral biometrics, while SMEs focus on practical, cloud-native options that offer faster onboarding and lower complexity.
By End-Use Industry
The BFSI sector remains the largest end-use segment, with more than 27 percent market share in 2024 and stable growth in 2025. Banks and insurers continue to invest heavily in crime monitoring, identity validation, and transaction analytics as fraud threats increase with digital banking adoption. Telecom operators strengthen authentication and account security to reduce SIM-based fraud and protect subscriber data.
Healthcare providers grow adoption in response to rising medical identity theft, insurance fraud, and patient data breaches. Retail and e-commerce firms invest in AI-driven fraud scoring to manage increasing online transaction volumes. Governments expand use of FDP systems to secure public benefits programs and protect citizen data from identity misuse.
Manufacturing and industrial firms show steady adoption as connected devices and remote operations expand. As operational technology environments become targets for fraudulent access and data manipulation, cybersecurity and fraud teams coordinate their monitoring strategies more closely.
By Region
North America maintains its leadership with more than 43 percent of global revenue in 2024, supported by mature digital payments infrastructure, strong regulatory supervision, and high adoption among banks and large enterprises. U.S. institutions continue to implement advanced analytics and authentication technologies to reduce financial and reputational risks. Canada expands investment in compliance-focused platforms that align with PIPEDA and AML regulations.
Europe shows stable demand as financial institutions adapt to PSD2 requirements and strengthen strong customer authentication. The region’s focus on data protection and cross-border financial security drives broader use of identity analytics and AML platforms. Asia Pacific delivers the fastest growth in 2025, propelled by rapid expansion of digital wallets, super apps, and real-time payment systems in India, China, and Southeast Asia.
Latin America and the Middle East and Africa report rising adoption as fintech ecosystems scale. Markets such as Brazil, Mexico, the United Arab Emirates, and South Africa introduce fraud controls to support online banking, government payments, and expanding e-commerce activities. Growing digital participation across these regions accelerates investment in cloud-based fraud platforms that provide rapid detection and regulatory alignment.
Component, Solutions, Fraud Analytics, Governance, Risk, and Compliance, Authentication, Services, Managed Services, Professional Services, Application, Payment Fraud, Money Laundering, Identity Theft, Other Applications, Enterprise Size, Large Enterprises, Small & Medium Enterprises (SMEs), End-Use Industry, IT & Telecommunications, BFSI, Healthcare, Retail & E-commerce, Manufacturing, Government, Other End-Use Industries
Research Methodology
Primary Research- 100 Interviews of Stakeholders
Secondary Research
Desk Research
Regional scope
North America (United States, Canada, Mexico)
Latin America (Brazil, Argentina, Columbia)
East Asia And Pacific (China, Japan, South Korea, Australia, Cambodia, Fiji, Indonesia)
Sea And South Asia (India, Singapore, Thailand, Taiwan, Malaysia)
Eastern Europe (Poland, Russia, Czech Republic, Romania)
Western Europe (Germany, U.K., France, Spain, Itlay)
Middle East & Africa (GCC Countries, Egypt, Nigeria, South Africa, Israel)
Competitive Landscape
NICE Systems Ltd., Experian plc, RSA Security LLC, FICO, IBM Corporation, ACI Worldwide Inc., LexisNexis, SAP SE, Software AG, Fiserv, Inc., SAS Institute Inc., Oracle Corporation, Other Key Players,
Customization Scope
Customization for segments, region/country-level will be provided. Moreover, additional customization can be done based on the requirements.
Pricing and Purchase Options
Avail customized purchase options to meet your exact research needs. We have three licenses to opt for: Single User License, Multi-User License (Up to 5 Users), Corporate Use License (Unlimited User and Printable PDF).
TABLE OF CONTENTS
1. EXECUTIVE SUMMARY
1.1. MARKET SNAPSHOT
1.2. KEY FINDINGS & INSIGHTS
1.3. ANALYST RECOMMENDATIONS
1.4. FUTURE OUTLOOK
2. RESEARCH METHODOLOGY
2.1. MARKET DEFINITION & SCOPE
2.2. RESEARCH OBJECTIVES: PRIMARY & SECONDARY DATA SOURCES
2.3. DATA COLLECTION SOURCES
2.3.1. COVERAGE OF 100+ PRIMARY RESEARCH/CONSULTATION CALLS WITH INDUSTRY STAKEHOLDERS
FIGURE 17 NORTH AMERICA FRAUD DETECTION AND PREVENTION CURRENT AND FUTURE TYPE ANALYSIS, 2025–2034, (USD MILLION)
FIGURE 18 NORTH AMERICA FRAUD DETECTION AND PREVENTION CURRENT AND FUTURE END USER ANALYSIS, 2025–2034, (USD MILLION)
FIGURE 19 MARKET SHARE BY COUNTRY
FIGURE 20 LATIN AMERICA FRAUD DETECTION AND PREVENTION CURRENT AND FUTURE TYPE ANALYSIS, 2025–2034, (USD MILLION)
FIGURE 21 LATIN AMERICA FRAUD DETECTION AND PREVENTION CURRENT AND FUTURE END USER ANALYSIS, 2025–2034, (USD MILLION)
FIGURE 22 MARKET SHARE BY COUNTRY
FIGURE 23 EASTERN EUROPE FRAUD DETECTION AND PREVENTION CURRENT AND FUTURE TYPE ANALYSIS, 2025–2034, (USD MILLION)
FIGURE 24 EASTERN EUROPE FRAUD DETECTION AND PREVENTION CURRENT AND FUTURE END USER ANALYSIS, 2025–2034, (USD MILLION)
FIGURE 25 MARKET SHARE BY COUNTRY
FIGURE 26 WESTERN EUROPE FRAUD DETECTION AND PREVENTION CURRENT AND FUTURE TYPE ANALYSIS, 2025–2034, (USD MILLION)
FIGURE 27 WESTERN EUROPE FRAUD DETECTION AND PREVENTION CURRENT AND FUTURE END USER ANALYSIS, 2025–2034, (USD MILLION)
FIGURE 28 MARKET SHARE BY COUNTRY
FIGURE 29 EAST ASIA AND PACIFIC FRAUD DETECTION AND PREVENTION CURRENT AND FUTURE TYPE ANALYSIS, 2025–2034, (USD MILLION)
FIGURE 30 EAST ASIA AND PACIFIC FRAUD DETECTION AND PREVENTION CURRENT AND FUTURE END USER ANALYSIS, 2025–2034, (USD MILLION)
FIGURE 31 MARKET SHARE BY COUNTRY
FIGURE 32 SEA AND SOUTH ASIA FRAUD DETECTION AND PREVENTION CURRENT AND FUTURE TYPE ANALYSIS, 2025–2034, (USD MILLION)
FIGURE 33 SEA AND SOUTH ASIA FRAUD DETECTION AND PREVENTION CURRENT AND FUTURE END USER ANALYSIS, 2025–2034, (USD MILLION)
FIGURE 34 MARKET SHARE BY COUNTRY
FIGURE 35 MIDDLE EAST AND AFRICA FRAUD DETECTION AND PREVENTION CURRENT AND FUTURE TYPE ANALYSIS, 2025–2034, (USD MILLION)
FIGURE 36 MIDDLE EAST AND AFRICA FRAUD DETECTION AND PREVENTION CURRENT AND FUTURE END USER ANALYSIS, 2025–2034, (USD MILLION)
FIGURE 37 NORTH AMERICA FRAUD DETECTION AND PREVENTION CURRENT AND FUTURE MARKET VOLUME SHARE REGIONAL ANALYSIS, 2025–2034, (USD MILLION)
FIGURE 38 U.S. FRAUD DETECTION AND PREVENTION CURRENT AND FUTURE TYPE ANALYSIS, 2025–2034, (USD MILLION)
FIGURE 39 U.S. FRAUD DETECTION AND PREVENTION CURRENT AND FUTURE END USER ANALYSIS, 2025–2034, (USD MILLION)
FIGURE 40 CANADA FRAUD DETECTION AND PREVENTION CURRENT AND FUTURE TYPE ANALYSIS, 2025–2034, (USD MILLION)
FIGURE 41 CANADA FRAUD DETECTION AND PREVENTION CURRENT AND FUTURE END USER ANALYSIS, 2025–2034, (USD MILLION)
FIGURE 42 LATIN AMERICA FRAUD DETECTION AND PREVENTION CURRENT AND FUTURE MARKET VOLUME SHARE REGIONAL ANALYSIS, 2025–2034, (USD MILLION)
FIGURE 43 MEXICO FRAUD DETECTION AND PREVENTION CURRENT AND FUTURE TYPE ANALYSIS, 2025–2034, (USD MILLION)
FIGURE 44 MEXICO FRAUD DETECTION AND PREVENTION CURRENT AND FUTURE END USER ANALYSIS, 2025–2034, (USD MILLION)
FIGURE 45 BRAZIL FRAUD DETECTION AND PREVENTION CURRENT AND FUTURE TYPE ANALYSIS, 2025–2034, (USD MILLION)
FIGURE 46 BRAZIL FRAUD DETECTION AND PREVENTION CURRENT AND FUTURE END USER ANALYSIS, 2025–2034, (USD MILLION)
FIGURE 47 ARGENTINA FRAUD DETECTION AND PREVENTION CURRENT AND FUTURE TYPE ANALYSIS, 2025–2034, (USD MILLION)
FIGURE 48 ARGENTINA FRAUD DETECTION AND PREVENTION CURRENT AND FUTURE END USER ANALYSIS, 2025–2034, (USD MILLION)
FIGURE 49 COLUMBIA FRAUD DETECTION AND PREVENTION CURRENT AND FUTURE TYPE ANALYSIS, 2025–2034, (USD MILLION)
FIGURE 50 COLUMBIA FRAUD DETECTION AND PREVENTION CURRENT AND FUTURE END USER ANALYSIS, 2025–2034, (USD MILLION)
FIGURE 51 REST OF LATIN AMERICA FRAUD DETECTION AND PREVENTION CURRENT AND FUTURE TYPE ANALYSIS, 2025–2034, (USD MILLION)
FIGURE 52 REST OF LATIN AMERICA FRAUD DETECTION AND PREVENTION CURRENT AND FUTURE END USER ANALYSIS, 2025–2034, (USD MILLION)
FIGURE 53 EASTERN EUROPE FRAUD DETECTION AND PREVENTION CURRENT AND FUTURE MARKET VOLUME SHARE REGIONAL ANALYSIS, 2025–2034, (USD MILLION)
FIGURE 54 POLAND FRAUD DETECTION AND PREVENTION CURRENT AND FUTURE TYPE ANALYSIS, 2025–2034, (USD MILLION)
FIGURE 55 POLAND FRAUD DETECTION AND PREVENTION CURRENT AND FUTURE END USER ANALYSIS, 2025–2034, (USD MILLION)
FIGURE 56 RUSSIA FRAUD DETECTION AND PREVENTION CURRENT AND FUTURE TYPE ANALYSIS, 2025–2034, (USD MILLION)
FIGURE 57 RUSSIA FRAUD DETECTION AND PREVENTION CURRENT AND FUTURE END USER ANALYSIS, 2025–2034, (USD MILLION)
FIGURE 58 CZECH REPUBLIC FRAUD DETECTION AND PREVENTION CURRENT AND FUTURE TYPE ANALYSIS, 2025–2034, (USD MILLION)
FIGURE 59 CZECH REPUBLIC FRAUD DETECTION AND PREVENTION CURRENT AND FUTURE END USER ANALYSIS, 2025–2034, (USD MILLION)
FIGURE 60 ROMANIA FRAUD DETECTION AND PREVENTION CURRENT AND FUTURE TYPE ANALYSIS, 2025–2034, (USD MILLION)
FIGURE 61 ROMANIA FRAUD DETECTION AND PREVENTION CURRENT AND FUTURE END USER ANALYSIS, 2025–2034, (USD MILLION)
FIGURE 62 REST OF EASTERN EUROPE FRAUD DETECTION AND PREVENTION CURRENT AND FUTURE TYPE ANALYSIS, 2025–2034, (USD MILLION)
FIGURE 63 REST OF EASTERN EUROPE FRAUD DETECTION AND PREVENTION CURRENT AND FUTURE END USER ANALYSIS, 2025–2034, (USD MILLION)
FIGURE 64 WESTERN EUROPE FRAUD DETECTION AND PREVENTION CURRENT AND FUTURE MARKET VOLUME SHARE REGIONAL ANALYSIS, 2025–2034, (USD MILLION)
FIGURE 65 GERMANY FRAUD DETECTION AND PREVENTION CURRENT AND FUTURE TYPE ANALYSIS, 2025–2034, (USD MILLION)
FIGURE 66 GERMANY FRAUD DETECTION AND PREVENTION CURRENT AND FUTURE END USER ANALYSIS, 2025–2034, (USD MILLION)
FIGURE 67 FRANCE FRAUD DETECTION AND PREVENTION CURRENT AND FUTURE TYPE ANALYSIS, 2025–2034, (USD MILLION)
FIGURE 68 FRANCE FRAUD DETECTION AND PREVENTION CURRENT AND FUTURE END USER ANALYSIS, 2025–2034, (USD MILLION)
FIGURE 69 UK FRAUD DETECTION AND PREVENTION CURRENT AND FUTURE TYPE ANALYSIS, 2025–2034, (USD MILLION)
FIGURE 70 UK FRAUD DETECTION AND PREVENTION CURRENT AND FUTURE END USER ANALYSIS, 2025–2034, (USD MILLION)
FIGURE 71 SPAIN FRAUD DETECTION AND PREVENTION CURRENT AND FUTURE TYPE ANALYSIS, 2025–2034, (USD MILLION)
FIGURE 72 SPAIN FRAUD DETECTION AND PREVENTION CURRENT AND FUTURE END USER ANALYSIS, 2025–2034, (USD MILLION)
FIGURE 73 ITALY FRAUD DETECTION AND PREVENTION CURRENT AND FUTURE TYPE ANALYSIS, 2025–2034, (USD MILLION)
FIGURE 74 ITALY FRAUD DETECTION AND PREVENTION CURRENT AND FUTURE END USER ANALYSIS, 2025–2034, (USD MILLION)
FIGURE 75 REST OF WESTERN EUROPE FRAUD DETECTION AND PREVENTION CURRENT AND FUTURE TYPE ANALYSIS, 2025–2034, (USD MILLION)
FIGURE 76 REST OF WESTERN EUROPE FRAUD DETECTION AND PREVENTION CURRENT AND FUTURE END USER ANALYSIS, 2025–2034, (USD MILLION)
FIGURE 77 EAST ASIA AND PACIFIC FRAUD DETECTION AND PREVENTION CURRENT AND FUTURE MARKET VOLUME SHARE REGIONAL ANALYSIS, 2025–2034, (USD MILLION)
FIGURE 78 CHINA FRAUD DETECTION AND PREVENTION CURRENT AND FUTURE TYPE ANALYSIS, 2025–2034, (USD MILLION)
FIGURE 79 CHINA FRAUD DETECTION AND PREVENTION CURRENT AND FUTURE END USER ANALYSIS, 2025–2034, (USD MILLION)
FIGURE 80 JAPAN FRAUD DETECTION AND PREVENTION CURRENT AND FUTURE TYPE ANALYSIS, 2025–2034, (USD MILLION)
FIGURE 81 JAPAN FRAUD DETECTION AND PREVENTION CURRENT AND FUTURE END USER ANALYSIS, 2025–2034, (USD MILLION)
FIGURE 82 AUSTRALIA FRAUD DETECTION AND PREVENTION CURRENT AND FUTURE TYPE ANALYSIS, 2025–2034, (USD MILLION)
FIGURE 83 AUSTRALIA FRAUD DETECTION AND PREVENTION CURRENT AND FUTURE END USER ANALYSIS, 2025–2034, (USD MILLION)
FIGURE 84 CAMBODIA FRAUD DETECTION AND PREVENTION CURRENT AND FUTURE TYPE ANALYSIS, 2025–2034, (USD MILLION)
FIGURE 85 CAMBODIA FRAUD DETECTION AND PREVENTION CURRENT AND FUTURE END USER ANALYSIS, 2025–2034, (USD MILLION)
FIGURE 86 FIJI FRAUD DETECTION AND PREVENTION CURRENT AND FUTURE TYPE ANALYSIS, 2025–2034, (USD MILLION)
FIGURE 87 FIJI FRAUD DETECTION AND PREVENTION CURRENT AND FUTURE END USER ANALYSIS, 2025–2034, (USD MILLION)
FIGURE 88 INDONESIA FRAUD DETECTION AND PREVENTION CURRENT AND FUTURE TYPE ANALYSIS, 2025–2034, (USD MILLION)
FIGURE 89 INDONESIA FRAUD DETECTION AND PREVENTION CURRENT AND FUTURE END USER ANALYSIS, 2025–2034, (USD MILLION)
FIGURE 90 SOUTH KOREA FRAUD DETECTION AND PREVENTION CURRENT AND FUTURE TYPE ANALYSIS, 2025–2034, (USD MILLION)
FIGURE 91 SOUTH KOREA FRAUD DETECTION AND PREVENTION CURRENT AND FUTURE END USER ANALYSIS, 2025–2034, (USD MILLION)
FIGURE 92 REST OF EAST ASIA AND PACIFIC FRAUD DETECTION AND PREVENTION CURRENT AND FUTURE TYPE ANALYSIS, 2025–2034, (USD MILLION)
FIGURE 93 REST OF EAST ASIA AND PACIFIC FRAUD DETECTION AND PREVENTION CURRENT AND FUTURE END USER ANALYSIS, 2025–2034, (USD MILLION)
FIGURE 94 SEA AND SOUTH ASIA FRAUD DETECTION AND PREVENTION CURRENT AND FUTURE MARKET VOLUME SHARE REGIONAL ANALYSIS, 2025–2034, (USD MILLION)
FIGURE 95 BANGLADESH FRAUD DETECTION AND PREVENTION CURRENT AND FUTURE TYPE ANALYSIS, 2025–2034, (USD MILLION)
FIGURE 96 BANGLADESH FRAUD DETECTION AND PREVENTION CURRENT AND FUTURE END USER ANALYSIS, 2025–2034, (USD MILLION)
FIGURE 97 NEW ZEALAND FRAUD DETECTION AND PREVENTION CURRENT AND FUTURE TYPE ANALYSIS, 2025–2034, (USD MILLION)
FIGURE 98 NEW ZEALAND FRAUD DETECTION AND PREVENTION CURRENT AND FUTURE END USER ANALYSIS, 2025–2034, (USD MILLION)
FIGURE 99 INDIA FRAUD DETECTION AND PREVENTION CURRENT AND FUTURE TYPE ANALYSIS, 2025–2034, (USD MILLION)
FIGURE 100 INDIA FRAUD DETECTION AND PREVENTION CURRENT AND FUTURE END USER ANALYSIS, 2025–2034, (USD MILLION)
FIGURE 101 SINGAPORE FRAUD DETECTION AND PREVENTION CURRENT AND FUTURE TYPE ANALYSIS, 2025–2034, (USD MILLION)
FIGURE 102 SINGAPORE FRAUD DETECTION AND PREVENTION CURRENT AND FUTURE END USER ANALYSIS, 2025–2034, (USD MILLION)
FIGURE 103 THAILAND FRAUD DETECTION AND PREVENTION CURRENT AND FUTURE TYPE ANALYSIS, 2025–2034, (USD MILLION)
FIGURE 104 THAILAND FRAUD DETECTION AND PREVENTION CURRENT AND FUTURE END USER ANALYSIS, 2025–2034, (USD MILLION)
FIGURE 105 TAIWAN FRAUD DETECTION AND PREVENTION CURRENT AND FUTURE TYPE ANALYSIS, 2025–2034, (USD MILLION)
FIGURE 106 TAIWAN FRAUD DETECTION AND PREVENTION CURRENT AND FUTURE END USER ANALYSIS, 2025–2034, (USD MILLION)
FIGURE 107 MALAYSIA FRAUD DETECTION AND PREVENTION CURRENT AND FUTURE TYPE ANALYSIS, 2025–2034, (USD MILLION)
FIGURE 108 MALAYSIA FRAUD DETECTION AND PREVENTION CURRENT AND FUTURE END USER ANALYSIS, 2025–2034, (USD MILLION)
FIGURE 109 REST OF SEA AND SOUTH ASIA FRAUD DETECTION AND PREVENTION CURRENT AND FUTURE TYPE ANALYSIS, 2025–2034, (USD MILLION)
FIGURE 110 REST OF SEA AND SOUTH ASIA FRAUD DETECTION AND PREVENTION CURRENT AND FUTURE END USER ANALYSIS, 2025–2034, (USD MILLION)
FIGURE 111 MIDDLE EAST AND AFRICA FRAUD DETECTION AND PREVENTION CURRENT AND FUTURE MARKET VOLUME SHARE REGIONAL ANALYSIS, 2025–2034, (USD MILLION)
FIGURE 112 GCC COUNTRIES FRAUD DETECTION AND PREVENTION CURRENT AND FUTURE TYPE ANALYSIS, 2025–2034, (USD MILLION)
FIGURE 113 GCC COUNTRIES FRAUD DETECTION AND PREVENTION CURRENT AND FUTURE END USER ANALYSIS, 2025–2034, (USD MILLION)
FIGURE 114 SAUDI ARABIA FRAUD DETECTION AND PREVENTION CURRENT AND FUTURE TYPE ANALYSIS, 2025–2034, (USD MILLION)
FIGURE 115 SAUDI ARABIA FRAUD DETECTION AND PREVENTION CURRENT AND FUTURE END USER ANALYSIS, 2025–2034, (USD MILLION)
FIGURE 116 UAE FRAUD DETECTION AND PREVENTION CURRENT AND FUTURE TYPE ANALYSIS, 2025–2034, (USD MILLION)
FIGURE 117 UAE FRAUD DETECTION AND PREVENTION CURRENT AND FUTURE END USER ANALYSIS, 2025–2034, (USD MILLION)
FIGURE 118 BAHRAIN FRAUD DETECTION AND PREVENTION CURRENT AND FUTURE TYPE ANALYSIS, 2025–2034, (USD MILLION)
FIGURE 119 BAHRAIN FRAUD DETECTION AND PREVENTION CURRENT AND FUTURE END USER ANALYSIS, 2025–2034, (USD MILLION)
FIGURE 120 KUWAIT FRAUD DETECTION AND PREVENTION CURRENT AND FUTURE TYPE ANALYSIS, 2025–2034, (USD MILLION)
FIGURE 121 KUWAIT FRAUD DETECTION AND PREVENTION CURRENT AND FUTURE END USER ANALYSIS, 2025–2034, (USD MILLION)
FIGURE 122 OMAN FRAUD DETECTION AND PREVENTION CURRENT AND FUTURE TYPE ANALYSIS, 2025–2034, (USD MILLION)
FIGURE 123 OMAN FRAUD DETECTION AND PREVENTION CURRENT AND FUTURE END USER ANALYSIS, 2025–2034, (USD MILLION)
FIGURE 124 QATAR FRAUD DETECTION AND PREVENTION CURRENT AND FUTURE TYPE ANALYSIS, 2025–2034, (USD MILLION)
FIGURE 125 QATAR FRAUD DETECTION AND PREVENTION CURRENT AND FUTURE END USER ANALYSIS, 2025–2034, (USD MILLION)
FIGURE 126 EGYPT FRAUD DETECTION AND PREVENTION CURRENT AND FUTURE TYPE ANALYSIS, 2025–2034, (USD MILLION)
FIGURE 127 EGYPT FRAUD DETECTION AND PREVENTION CURRENT AND FUTURE END USER ANALYSIS, 2025–2034, (USD MILLION)
FIGURE 128 NIGERIA FRAUD DETECTION AND PREVENTION CURRENT AND FUTURE TYPE ANALYSIS, 2025–2034, (USD MILLION)
FIGURE 129 NIGERIA FRAUD DETECTION AND PREVENTION CURRENT AND FUTURE END USER ANALYSIS, 2025–2034, (USD MILLION)
FIGURE 130 SOUTH AFRICA FRAUD DETECTION AND PREVENTION CURRENT AND FUTURE TYPE ANALYSIS, 2025–2034, (USD MILLION)
FIGURE 131 SOUTH AFRICA FRAUD DETECTION AND PREVENTION CURRENT AND FUTURE END USER ANALYSIS, 2025–2034, (USD MILLION)
FIGURE 132 ISRAEL FRAUD DETECTION AND PREVENTION CURRENT AND FUTURE TYPE ANALYSIS, 2025–2034, (USD MILLION)
FIGURE 133 ISRAEL FRAUD DETECTION AND PREVENTION CURRENT AND FUTURE END USER ANALYSIS, 2025–2034, (USD MILLION)
FIGURE 134 REST OF MEA FRAUD DETECTION AND PREVENTION CURRENT AND FUTURE TYPE ANALYSIS, 2025–2034, (USD MILLION)
FIGURE 135 REST OF MEA FRAUD DETECTION AND PREVENTION CURRENT AND FUTURE END USER ANALYSIS, 2025–2034, (USD MILLION)
FIGURE 136 U. S. MARKET SHARE ANALYSIS BY TYPE (2024)
FIGURE 137 U. S. MARKET SHARE ANALYSIS BY END USER (2024)
FIGURE 138 CANADA MARKET SHARE ANALYSIS BY TYPE (2024)
FIGURE 139 CANADA MARKET SHARE ANALYSIS BY END USER (2024)
FIGURE 140 MEXICO MARKET SHARE ANALYSIS BY TYPE (2024)
FIGURE 141 MEXICO MARKET SHARE ANALYSIS BY END USER (2024)
FIGURE 142 CHINA MARKET SHARE ANALYSIS BY TYPE (2024)
FIGURE 143 CHINA MARKET SHARE ANALYSIS BY END USER (2024)
FIGURE 144 JAPAN MARKET SHARE ANALYSIS BY TYPE (2024)
FIGURE 145 JAPAN MARKET SHARE ANALYSIS BY END USER (2024)
FIGURE 146 INDIA MARKET SHARE ANALYSIS BY TYPE (2024)
FIGURE 147 INDIA MARKET SHARE ANALYSIS BY END USER (2024)
FIGURE 148 SOUTH KOREA MARKET SHARE ANALYSIS BY TYPE (2024)
FIGURE 149 SOUTH KOREA MARKET SHARE ANALYSIS BY END USER (2024)
FIGURE 150 SAUDI ARABIA MARKET SHARE ANALYSIS BY TYPE (2024)
FIGURE 151 SAUDI ARABIA MARKET SHARE ANALYSIS BY END USER (2024)
FIGURE 152 UAE MARKET SHARE ANALYSIS BY TYPE (2024)
FIGURE 153 UAE MARKET SHARE ANALYSIS BY END USER (2024)
FIGURE 154 EGYPT MARKET SHARE ANALYSIS BY TYPE (2024)
FIGURE 155 EGYPT MARKET SHARE ANALYSIS BY END USER (2024)
FIGURE 156 NIGERIA MARKET SHARE ANALYSIS BY TYPE (2024)
FIGURE 157 NIGERIA MARKET SHARE ANALYSIS BY END USER (2024)
FIGURE 158 SOUTH AFRICA MARKET SHARE ANALYSIS BY TYPE (2024)
FIGURE 159 SOUTH AFRICA MARKET SHARE ANALYSIS BY END USER (2024)
FIGURE 160 GERMANY MARKET SHARE ANALYSIS BY TYPE (2024)
FIGURE 161 GERMANY MARKET SHARE ANALYSIS BY END USER (2024)
FIGURE 162 FRANCE MARKET SHARE ANALYSIS BY TYPE (2024)
FIGURE 163 FRANCE MARKET SHARE ANALYSIS BY END USER (2024)
FIGURE 164 UK MARKET SHARE ANALYSIS BY TYPE (2024)
FIGURE 165 UK MARKET SHARE ANALYSIS BY END USER (2024)
FIGURE 166 SPAIN MARKET SHARE ANALYSIS BY TYPE (2024)
FIGURE 167 SPAIN MARKET SHARE ANALYSIS BY END USER (2024)
FIGURE 168 ITALY MARKET SHARE ANALYSIS BY TYPE (2024)
FIGURE 169 ITALY MARKET SHARE ANALYSIS BY END USER (2024)
FIGURE 170 BRAZIL MARKET SHARE ANALYSIS BY TYPE (2024)
FIGURE 171 BRAZIL MARKET SHARE ANALYSIS BY END USER (2024)
FIGURE 172 ARGENTINA MARKET SHARE ANALYSIS BY TYPE (2024)
FIGURE 173 ARGENTINA MARKET SHARE ANALYSIS BY END USER (2024)
FIGURE 174 COLUMBIA MARKET SHARE ANALYSIS BY TYPE (2024)
FIGURE 175 COLUMBIA MARKET SHARE ANALYSIS BY END USER (2024)
FIGURE 176 GLOBAL FRAUD DETECTION AND PREVENTION CURRENT AND FUTURE MARKET KEY COUNTRY LEVEL ANALYSIS, 2024–2034, (USD MILLION)
FIGURE 177 FINANCIAL OVERVIEW:
Key Player Analysis
SAP SE: SAP SE positions itself as a leader in the global FDP market with a strong presence across banking, retail, telecommunications, and public sector clients. Its portfolio integrates fraud management, GRC platforms, and real-time analytics that run on the SAP HANA architecture. These tools support high-volume transaction monitoring and identity assurance across core enterprise systems. SAP strengthens its market influence by embedding AI-driven anomaly detection into its cloud suite and expanding integration with ERP, procurement, and finance workflows.
The company continues to invest in cloud migration as more than 60 percent of new deployments in 2025 originate from its SAP S/4HANA Cloud and Business Technology Platform customers. SAP builds strategic alliances with financial institutions and global systems integrators to extend FDP capabilities into regulated markets. Its differentiators include strong data integration, large enterprise adoption, and global compliance support across more than 100 countries. These strengths reinforce SAP’s role as a preferred provider for organizations seeking unified fraud and risk oversight.
SAS Institute Inc.: SAS Institute operates as a challenger with deep specialization in analytics-driven fraud management. The company maintains a strong footprint in banking, insurance, and government sectors where real-time detection and advanced modeling are critical. Its Fraud and Security Intelligence platform offers predictive scoring, network analysis, and case management supported by machine learning and natural language processing. In 2025, SAS reports strong demand for its cloud-native editions, especially as financial institutions shift analytics workloads to hybrid cloud environments.
SAS advances its strategy through expanded R&D investment in adaptive models that adjust to changing fraud behavior without manual tuning. The company collaborates with major payment networks and regulatory agencies to shape detection standards and improve model transparency. Its key differentiators include advanced data science capabilities, strong regulatory expertise, and a long-standing reputation for high detection accuracy. These capabilities position SAS as a preferred partner for organizations with complex analytics requirements.
Experian plc: Experian plc ranks as a key innovator in identity and credit-based fraud detection. The company integrates FDP solutions with its global credit bureau infrastructure, giving clients access to identity verification, device intelligence, and behavioral analytics across millions of profiles. Its CrossCore platform continues to expand in 2025 with new AI-driven decisioning tools that help banks and fintechs manage onboarding fraud, account takeover, and synthetic identity risk. Experian reports steady growth in identity solutions, with adoption rising across North America, Europe, and Asia Pacific.
The company accelerates strategic investments in digital identity partnerships and API-driven onboarding frameworks. It also enhances fraud scoring models by combining bureau data with transactional signals from payment processors and telecom operators. Experian’s differentiators include vast data assets, strong presence in consumer finance, and specialized tools for identity-centric threats. These capabilities strengthen its role as a critical partner for institutions seeking improved customer authentication and lower fraud losses across digital channels.
Market Key Players
NICE Systems Ltd.
Experian plc
RSA Security LLC
FICO
IBM Corporation
ACI Worldwide Inc.
LexisNexis
SAP SE
Software AG
Fiserv, Inc.
SAS Institute Inc.
Oracle Corporation
Other Key Players
Driver:
Expansion of Digital Transaction Ecosystems
By 2025, enterprises operate in highly digitized environments where cloud platforms, mobile applications, and IoT-enabled systems handle the majority of customer and operational data. This rapid digital expansion significantly increases the number of exposed endpoints and transaction touchpoints. Fraudsters increasingly exploit payment gateways, digital wallets, connected devices, and online identity systems that collectively process billions of interactions daily. As digital dependency deepens, organizations face elevated risks of unauthorized access, transaction manipulation, and data misuse, directly driving demand for advanced fraud detection and prevention solutions.
Regulatory Pressure and Enterprise Risk Exposure
The strategic importance of fraud detection is reinforced by rising regulatory scrutiny across financial services, e-commerce, telecom, and digital platforms. Enterprises expanding digital operations without robust fraud monitoring capabilities face higher financial losses, reputational damage, and compliance penalties. Regulatory frameworks related to data protection, anti-money laundering, and consumer security are pushing organizations to invest in automated, real-time fraud detection tools. This alignment of regulatory pressure and operational risk supports sustained market growth at a pace consistent with the projected CAGR of nearly 20 percent through 2034.
Restraint:
Escalating Sophistication of Fraud Techniques
In 2025, fraud schemes are becoming more complex as attackers leverage synthetic identities, automated bots, deepfake technologies, and advanced social engineering tactics. These methods often bypass traditional rule-based detection systems, forcing organizations to rethink their security architectures. Many enterprises struggle to keep pace with this escalation, particularly when legacy systems lack adaptability or real-time intelligence capabilities. The growing sophistication of attacks increases false positives and complicates fraud investigation workflows.
Talent Shortages and Operational Constraints
A critical barrier to adoption is the limited availability of skilled fraud analysts, data scientists, and cybersecurity professionals. Industry assessments indicate that nearly half of large enterprises face understaffing in specialized fraud and risk management roles. This talent gap slows deployment of advanced FDP platforms and limits the effective use of AI-driven analytics. For organizations, this results in higher operational costs, delayed response times, and partial utilization of system capabilities, while vendors encounter longer onboarding and implementation cycles.
Opportunity:
AI-Driven Analytics and Predictive Detection
Advanced analytics represents the strongest growth opportunity for the fraud detection and prevention market beyond 2025. Artificial intelligence, machine learning, and behavioral analytics now underpin most next-generation FDP platforms, delivering detection accuracy improvements exceeding 30 percent compared with legacy systems. These technologies enable real-time risk scoring, adaptive learning, and cross-channel fraud correlation, significantly reducing both fraud losses and manual review volumes.
Cloud-Based and Scalable Fraud Ecosystems
The transition toward cloud-native fraud detection ecosystems unlocks substantial revenue potential. Cloud-based FDP platforms are projected to generate several billion dollars in incremental annual revenue by 2030 as enterprises migrate away from static rules engines. For organizations, cloud deployment lowers entry barriers, accelerates implementation, and supports continuous updates against evolving threats. Banks, insurers, digital marketplaces, and service providers increasingly view AI-enabled, cloud-based fraud platforms as long-term strategic investments.
Trend:
Shift Toward Identity-Centric Fraud Prevention
By 2025, fraud activity increasingly targets identity layers rather than isolated transactions. Account takeovers, biometric spoofing, and synthetic identity fraud are rising sharply across financial services and e-commerce channels. This shift compels enterprises to prioritize identity intelligence, including device fingerprinting, behavioral biometrics, and contextual risk assessment across user journeys. Identity-driven attacks are growing at more than 20 percent annually, reshaping evaluation criteria for FDP solutions.
Unified and Continuous Risk Assessment Models
Vendors are responding by developing unified fraud platforms that deliver continuous risk assessment across login, transaction, and post-transaction stages. These solutions integrate identity behavior, device data, and transaction context into a single risk framework. For enterprises, this evolution improves detection accuracy while preserving customer experience through adaptive authentication. As identity becomes the primary attack surface, fraud detection solutions are evolving into comprehensive trust and security platforms that support both compliance mandates and long-term customer protection.
Recent Developments
Dec 2024 – Reserve Bank of India (RBI): RBI, through the Reserve Bank Innovation Hub, launched MuleHunter.AI, an AI and machine learning model piloted with two large public sector banks to identify mule accounts and reduce digital payment fraud, in a market where online financial frauds account for about 67.8% of cybercrime complaints in India. This initiative strengthens the national fraud intelligence fabric and sets a higher benchmark for banks and FDP vendors on mule-account analytics and consortium data use.
Feb 2025 – Worldpay: Worldpay agreed to acquire UK-based Ravelin, an AI-native fraud prevention platform that serves global e-commerce brands, to embed its real-time fraud scoring into Worldpay’s payment stack, which processes over 50 billion transactions annually across 146 countries and 135 currencies and around 2.5 trillion USD in volume. The acquisition expands Worldpay’s FDP capabilities for merchants and intensifies competition among integrated payment and fraud platforms.
Apr 2025 – CSI: CSI introduced TruDetect and TruProtect, AI-powered AML and fraud detection solutions built with DataSeers technology, targeting false-positive rates that can exceed 95% of AML alerts and a market where consumers reported more than 12.5 billion USD in fraud losses in 2024. The launch broadens access to advanced FDP and AML tools for community and regional banks and supports vendors that can combine case management, AML and fraud analytics on a single platform.
Jul 2025 – LexisNexis Risk Solutions: LexisNexis Risk Solutions was named a Leader in Frost & Sullivan’s 2025 Fraud Detection and Prevention Frost Radar for both Know Your Customer and Know Your User, and secured Category Leader status across four Chartis market quadrants for enterprise and payment fraud among a field of 42 vendors. This recognition reinforces its position as a tier-one provider and pressures peers to match its depth in global digital identity, device intelligence and behavioral analytics.
Sep 2025 – Nasdaq Verafin and BioCatch: Nasdaq Verafin and BioCatch formed a strategic partnership to combine Verafin’s consortium-based fraud platform, used by more than 2,600 financial institutions with over 10 trillion USD in assets, with BioCatch’s behavioral analytics, which analyzes over 3,000 device and behavior signals per session. The collaboration accelerates adoption of behavior-plus-transaction models in FDP, enabling banks to halt real-time payment scams and money mule flows before funds leave customer accounts and influencing product roadmaps across the FDP vendor landscape.