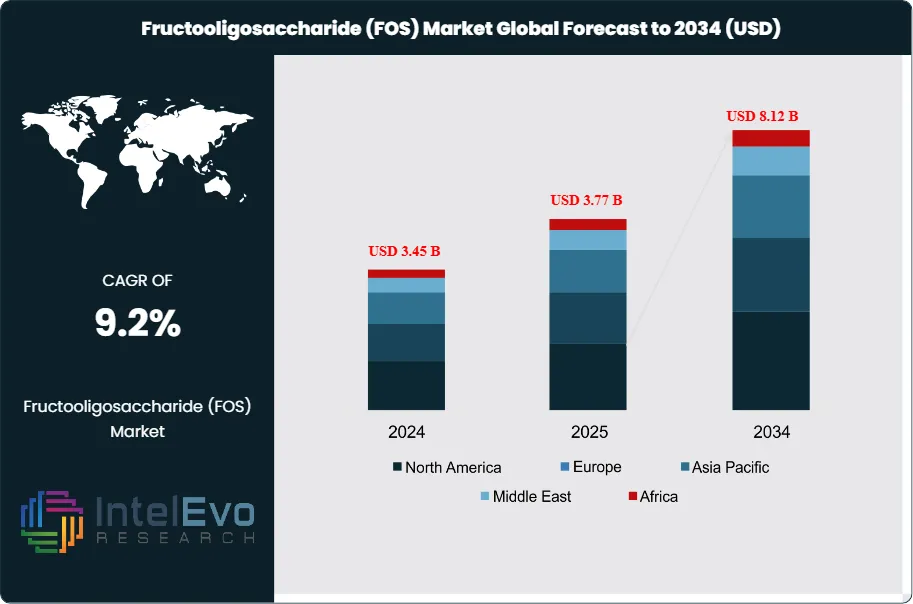
The Fructooligosaccharide (FOS) Market size is projected to reach USD 8.12 Billion by 2034, up from USD 3.45 Billion in 2024, growing at a CAGR of 9.2% during the forecast period from 2025 to 2034. Rising consumer demand for natural prebiotics, increasing awareness of gut health, and the surge in functional food and beverage applications are driving rapid growth in the FOS market. With the growing shift toward clean-label and plant-derived ingredients, the industry is witnessing strong traction among health-conscious consumers and food manufacturers alike.
Fructooligosaccharides (FOS) are a type of prebiotic fiber consisting of short chains of fructose molecules. These non-digestible oligosaccharides occur naturally in certain plants, such as chicory root, onions, and garlic, and they have gained considerable attention for their health benefits, particularly for improving gut health. FOS is used primarily in functional foods, beverages, dietary supplements, and pharmaceuticals for its ability to promote the growth of beneficial gut bacteria, enhance digestive health, and boost immune function. With increasing awareness of health and wellness, the demand for FOS has surged across various applications. The global Fructooligosaccharide (FOS) market has experienced steady growth and is anticipated to continue expanding due to its natural origin, health benefits, and rising consumer preference for clean label and natural ingredients.
Poised for steady growth, driven by increasing consumer demand for prebiotics, natural health products, and functional foods. The market is witnessing strong growth in developed regions such as North America and Europe, while the Asia-Pacific region presents the highest growth opportunities. The ongoing trend toward health and wellness, coupled with increasing awareness about gut health, immune function, and the demand for natural ingredients, will continue to propel the market forward. However, market participants must address challenges such as high production costs and competition from alternative prebiotics.
The COVID-19 pandemic had a noticeable impact on the Fructooligosaccharide (FOS) market. During the pandemic, there was an increased focus on immunity, gut health, and overall wellness, leading to a surge in demand for prebiotics like FOS. With consumers becoming more health-conscious, many turned to functional foods, dietary supplements, and other wellness products to boost their immunity and digestive health during the pandemic. However, the supply chain disruptions caused by the pandemic impacted the production and distribution of FOS. Logistical challenges and restrictions on trade led to delays in the delivery of raw materials, especially those sourced from chicory, which is a primary raw material for FOS production. Despite these challenges, the overall market resilience and growing demand for prebiotic ingredients ensured that the market for FOS remained strong.
Key Takeaways:
Market Growth: The Fructooligosaccharide (FOS) Market is expected to reach USD 8.12 Billion by 2034, growing at a robust CAGR of 9.2%, the growing middle class in these countries is driving the demand for functional foods and health-enhancing ingredients, with FOS being a popular choice.
Source Dominance: Chicory remains the dominant source due to its natural composition and high inulin content, while sucrose-based FOS is witnessing rising demand due to its cost-effectiveness and growing industrial applications.
Form Dominance: Powdered FOS leads the market due to its stability, longer shelf life, and ease of handling. However, the liquid segment is projected to grow steadily, driven by rising demand in beverages and liquid nutritional products.
Application Dominance: Food & beverages dominate the market, driven by growing consumer demand for functional foods. The dietary supplements segment is expected to see significant growth due to the increasing focus on gut health and immune support.
Driver: The growing consumer focus on digestive health and the increasing use of functional ingredients in the food & beverage industry are key drivers for the FOS market. Rising awareness of prebiotics’ role in enhancing gut microbiota is encouraging demand across multiple sectors.
Restraint: High production costs and limited consumer awareness in emerging economies are key restraints. Additionally, inconsistent regulations across regions may limit product standardization and market penetration.
Opportunity: Rising demand for plant-based and clean-label ingredients, combined with increased R&D in prebiotic formulations, offers vast market potential for FOS. Expanding applications in infant formula and animal nutrition also present untapped growth areas.
Trend: The FOS market is witnessing innovation in delivery forms and formulation strategies. Collaborations and acquisitions by major players to expand their prebiotic portfolios are also a significant trend.
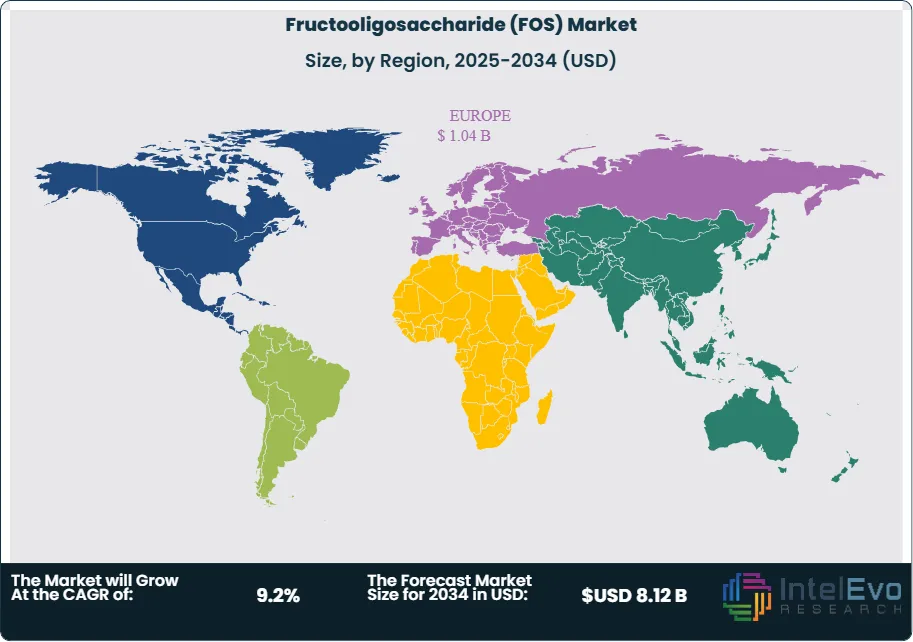
Regional Analysis: Europe and North America lead in terms of market size due to their focus on health-conscious consumers and the increasing demand for functional foods and dietary supplements.
Source Analysis:
Chicory currently leads the market owing to its natural origin, superior inulin content, and clean-label acceptance among consumers. Its established presence in health foods and wide application range across regions gives it a competitive edge.
Sucrose-based FOS is poised for significant growth due to cost-efficiency, large-scale availability, and increasing demand from developing countries where affordability and scalability are critical. As R&D improves enzymatic yield and purity, sucrose is expected to expand its footprint across multiple industries.
Form Analysis:
Powdered FOS is widely used in functional foods, dietary supplements, infant nutrition, and bakery products due to its easy incorporation into dry formulations. Its solid form allows for superior shelf stability, simplified transportation, and longer storage without degradation. The powdered form is also preferred in regions with stringent food safety regulations as it minimizes microbial contamination risks.
Liquid FOS is gaining attention due to its solubility, prebiotic function, and sweetening ability in a wide array of beverage products, including juices, smoothies, and dairy drinks. It also acts as a viscosity enhancer in syrups and sports nutrition products. The liquid form is particularly beneficial for manufacturers seeking to avoid the dust and mixing complications of powders.
Application Analysis:
Food & Beverages Leads With more than 40% Market Share In Fructooligosaccharide (FOS) Market. The food & beverages sector remains the largest application for FOS due to the growing trend of functional foods that offer health benefits beyond basic nutrition. FOS is used in this sector as a prebiotic, sweetener, and fiber in products like dairy, juices, snack bars, and baked goods. It not only improves taste but also enhances digestive health, as FOS serves as food for beneficial gut bacteria. The increasing demand for low-calorie, sugar-free, and high-fiber food and beverage products is fueling FOS adoption.
The dietary supplements segment is experiencing significant growth due to an increased focus on gut health, immunity, and overall well-being. As more consumers adopt preventive health practices, there is a rising demand for supplements that aid in digestion, gut flora balance, and immune system support.
Region Analysis:
Europe Leads With over 30% Market Share In Fructooligosaccharide (FOS) Market. Europe and North America dominate the FOS market due to strong demand from health-conscious consumers seeking low-calorie, functional foods, and dietary supplements. In North America, the market for prebiotics like FOS has grown, particularly in the functional food, beverage, and supplement sectors. A shift toward natural ingredients, clean-label products, and digestive health solutions is contributing to increased FOS consumption. In Europe, the growing preference for plant-based, sugar-free, and fiber-enriched food products boosts the adoption of FOS. Additionally, the aging population in these regions, seeking immunity-boosting and digestive health solutions, supports market growth.
The Asia-Pacific region is expected to experience the highest growth rate in the FOS market due to the region's expanding population, rising health awareness, and increasing urbanization. Countries like China, India, and Japan are witnessing growing demand for prebiotic fibers in food, beverages, and dietary supplements.
While still a smaller market, Latin America and Middle East & Africa are witnessing gradual growth in FOS consumption.
Customization for segments, region/country-level will be provided. Moreover, additional customization can be done based on the requirements.
Pricing and Purchase Options
Avail customized purchase options to meet your exact research needs. We have three licenses to opt for: Single User License, Multi-User License (Up to 5 Users), Corporate Use License (Unlimited User and Printable PDF).
TABLE OF CONTENTS
1. EXECUTIVE SUMMARY
1.1. MARKET SNAPSHOT
1.2. KEY FINDINGS & INSIGHTS
1.3. ANALYST RECOMMENDATIONS
1.4. FUTURE OUTLOOK
2. RESEARCH METHODOLOGY
2.1. MARKET DEFINITION & SCOPE
2.2. RESEARCH OBJECTIVES: PRIMARY & SECONDARY DATA SOURCES
2.3. DATA COLLECTION SOURCES
2.3.1. COVERAGE OF 100+ PRIMARY RESEARCH/CONSULTATION CALLS WITH INDUSTRY STAKEHOLDERS
FIGURE 17 NORTH AMERICA FRUCTOOLIGOSACCHARIDE CURRENT AND FUTURE TYPE ANALYSIS, 2025–2034, (USD MILLION)
FIGURE 18 NORTH AMERICA FRUCTOOLIGOSACCHARIDE CURRENT AND FUTURE END USER ANALYSIS, 2025–2034, (USD MILLION)
FIGURE 19 MARKET SHARE BY COUNTRY
FIGURE 20 LATIN AMERICA FRUCTOOLIGOSACCHARIDE CURRENT AND FUTURE TYPE ANALYSIS, 2025–2034, (USD MILLION)
FIGURE 21 LATIN AMERICA FRUCTOOLIGOSACCHARIDE CURRENT AND FUTURE END USER ANALYSIS, 2025–2034, (USD MILLION)
FIGURE 22 MARKET SHARE BY COUNTRY
FIGURE 23 EASTERN EUROPE FRUCTOOLIGOSACCHARIDE CURRENT AND FUTURE TYPE ANALYSIS, 2025–2034, (USD MILLION)
FIGURE 24 EASTERN EUROPE FRUCTOOLIGOSACCHARIDE CURRENT AND FUTURE END USER ANALYSIS, 2025–2034, (USD MILLION)
FIGURE 25 MARKET SHARE BY COUNTRY
FIGURE 26 WESTERN EUROPE FRUCTOOLIGOSACCHARIDE CURRENT AND FUTURE TYPE ANALYSIS, 2025–2034, (USD MILLION)
FIGURE 27 WESTERN EUROPE FRUCTOOLIGOSACCHARIDE CURRENT AND FUTURE END USER ANALYSIS, 2025–2034, (USD MILLION)
FIGURE 28 MARKET SHARE BY COUNTRY
FIGURE 29 EAST ASIA AND PACIFIC FRUCTOOLIGOSACCHARIDE CURRENT AND FUTURE TYPE ANALYSIS, 2025–2034, (USD MILLION)
FIGURE 30 EAST ASIA AND PACIFIC FRUCTOOLIGOSACCHARIDE CURRENT AND FUTURE END USER ANALYSIS, 2025–2034, (USD MILLION)
FIGURE 31 MARKET SHARE BY COUNTRY
FIGURE 32 SEA AND SOUTH ASIA FRUCTOOLIGOSACCHARIDE CURRENT AND FUTURE TYPE ANALYSIS, 2025–2034, (USD MILLION)
FIGURE 33 SEA AND SOUTH ASIA FRUCTOOLIGOSACCHARIDE CURRENT AND FUTURE END USER ANALYSIS, 2025–2034, (USD MILLION)
FIGURE 34 MARKET SHARE BY COUNTRY
FIGURE 35 MIDDLE EAST AND AFRICA FRUCTOOLIGOSACCHARIDE CURRENT AND FUTURE TYPE ANALYSIS, 2025–2034, (USD MILLION)
FIGURE 36 MIDDLE EAST AND AFRICA FRUCTOOLIGOSACCHARIDE CURRENT AND FUTURE END USER ANALYSIS, 2025–2034, (USD MILLION)
FIGURE 37 NORTH AMERICA FRUCTOOLIGOSACCHARIDE CURRENT AND FUTURE MARKET VOLUME SHARE REGIONAL ANALYSIS, 2025–2034, (USD MILLION)
FIGURE 38 U.S. FRUCTOOLIGOSACCHARIDE CURRENT AND FUTURE TYPE ANALYSIS, 2025–2034, (USD MILLION)
FIGURE 39 U.S. FRUCTOOLIGOSACCHARIDE CURRENT AND FUTURE END USER ANALYSIS, 2025–2034, (USD MILLION)
FIGURE 40 CANADA FRUCTOOLIGOSACCHARIDE CURRENT AND FUTURE TYPE ANALYSIS, 2025–2034, (USD MILLION)
FIGURE 41 CANADA FRUCTOOLIGOSACCHARIDE CURRENT AND FUTURE END USER ANALYSIS, 2025–2034, (USD MILLION)
FIGURE 42 LATIN AMERICA FRUCTOOLIGOSACCHARIDE CURRENT AND FUTURE MARKET VOLUME SHARE REGIONAL ANALYSIS, 2025–2034, (USD MILLION)
FIGURE 43 MEXICO FRUCTOOLIGOSACCHARIDE CURRENT AND FUTURE TYPE ANALYSIS, 2025–2034, (USD MILLION)
FIGURE 44 MEXICO FRUCTOOLIGOSACCHARIDE CURRENT AND FUTURE END USER ANALYSIS, 2025–2034, (USD MILLION)
FIGURE 45 BRAZIL FRUCTOOLIGOSACCHARIDE CURRENT AND FUTURE TYPE ANALYSIS, 2025–2034, (USD MILLION)
FIGURE 46 BRAZIL FRUCTOOLIGOSACCHARIDE CURRENT AND FUTURE END USER ANALYSIS, 2025–2034, (USD MILLION)
FIGURE 47 ARGENTINA FRUCTOOLIGOSACCHARIDE CURRENT AND FUTURE TYPE ANALYSIS, 2025–2034, (USD MILLION)
FIGURE 48 ARGENTINA FRUCTOOLIGOSACCHARIDE CURRENT AND FUTURE END USER ANALYSIS, 2025–2034, (USD MILLION)
FIGURE 49 COLUMBIA FRUCTOOLIGOSACCHARIDE CURRENT AND FUTURE TYPE ANALYSIS, 2025–2034, (USD MILLION)
FIGURE 50 COLUMBIA FRUCTOOLIGOSACCHARIDE CURRENT AND FUTURE END USER ANALYSIS, 2025–2034, (USD MILLION)
FIGURE 51 REST OF LATIN AMERICA FRUCTOOLIGOSACCHARIDE CURRENT AND FUTURE TYPE ANALYSIS, 2025–2034, (USD MILLION)
FIGURE 52 REST OF LATIN AMERICA FRUCTOOLIGOSACCHARIDE CURRENT AND FUTURE END USER ANALYSIS, 2025–2034, (USD MILLION)
FIGURE 53 EASTERN EUROPE FRUCTOOLIGOSACCHARIDE CURRENT AND FUTURE MARKET VOLUME SHARE REGIONAL ANALYSIS, 2025–2034, (USD MILLION)
FIGURE 54 POLAND FRUCTOOLIGOSACCHARIDE CURRENT AND FUTURE TYPE ANALYSIS, 2025–2034, (USD MILLION)
FIGURE 55 POLAND FRUCTOOLIGOSACCHARIDE CURRENT AND FUTURE END USER ANALYSIS, 2025–2034, (USD MILLION)
FIGURE 56 RUSSIA FRUCTOOLIGOSACCHARIDE CURRENT AND FUTURE TYPE ANALYSIS, 2025–2034, (USD MILLION)
FIGURE 57 RUSSIA FRUCTOOLIGOSACCHARIDE CURRENT AND FUTURE END USER ANALYSIS, 2025–2034, (USD MILLION)
FIGURE 58 CZECH REPUBLIC FRUCTOOLIGOSACCHARIDE CURRENT AND FUTURE TYPE ANALYSIS, 2025–2034, (USD MILLION)
FIGURE 59 CZECH REPUBLIC FRUCTOOLIGOSACCHARIDE CURRENT AND FUTURE END USER ANALYSIS, 2025–2034, (USD MILLION)
FIGURE 60 ROMANIA FRUCTOOLIGOSACCHARIDE CURRENT AND FUTURE TYPE ANALYSIS, 2025–2034, (USD MILLION)
FIGURE 61 ROMANIA FRUCTOOLIGOSACCHARIDE CURRENT AND FUTURE END USER ANALYSIS, 2025–2034, (USD MILLION)
FIGURE 62 REST OF EASTERN EUROPE FRUCTOOLIGOSACCHARIDE CURRENT AND FUTURE TYPE ANALYSIS, 2025–2034, (USD MILLION)
FIGURE 63 REST OF EASTERN EUROPE FRUCTOOLIGOSACCHARIDE CURRENT AND FUTURE END USER ANALYSIS, 2025–2034, (USD MILLION)
FIGURE 64 WESTERN EUROPE FRUCTOOLIGOSACCHARIDE CURRENT AND FUTURE MARKET VOLUME SHARE REGIONAL ANALYSIS, 2025–2034, (USD MILLION)
FIGURE 65 GERMANY FRUCTOOLIGOSACCHARIDE CURRENT AND FUTURE TYPE ANALYSIS, 2025–2034, (USD MILLION)
FIGURE 66 GERMANY FRUCTOOLIGOSACCHARIDE CURRENT AND FUTURE END USER ANALYSIS, 2025–2034, (USD MILLION)
FIGURE 67 FRANCE FRUCTOOLIGOSACCHARIDE CURRENT AND FUTURE TYPE ANALYSIS, 2025–2034, (USD MILLION)
FIGURE 68 FRANCE FRUCTOOLIGOSACCHARIDE CURRENT AND FUTURE END USER ANALYSIS, 2025–2034, (USD MILLION)
FIGURE 69 UK FRUCTOOLIGOSACCHARIDE CURRENT AND FUTURE TYPE ANALYSIS, 2025–2034, (USD MILLION)
FIGURE 70 UK FRUCTOOLIGOSACCHARIDE CURRENT AND FUTURE END USER ANALYSIS, 2025–2034, (USD MILLION)
FIGURE 71 SPAIN FRUCTOOLIGOSACCHARIDE CURRENT AND FUTURE TYPE ANALYSIS, 2025–2034, (USD MILLION)
FIGURE 72 SPAIN FRUCTOOLIGOSACCHARIDE CURRENT AND FUTURE END USER ANALYSIS, 2025–2034, (USD MILLION)
FIGURE 73 ITALY FRUCTOOLIGOSACCHARIDE CURRENT AND FUTURE TYPE ANALYSIS, 2025–2034, (USD MILLION)
FIGURE 74 ITALY FRUCTOOLIGOSACCHARIDE CURRENT AND FUTURE END USER ANALYSIS, 2025–2034, (USD MILLION)
FIGURE 75 REST OF WESTERN EUROPE FRUCTOOLIGOSACCHARIDE CURRENT AND FUTURE TYPE ANALYSIS, 2025–2034, (USD MILLION)
FIGURE 76 REST OF WESTERN EUROPE FRUCTOOLIGOSACCHARIDE CURRENT AND FUTURE END USER ANALYSIS, 2025–2034, (USD MILLION)
FIGURE 77 EAST ASIA AND PACIFIC FRUCTOOLIGOSACCHARIDE CURRENT AND FUTURE MARKET VOLUME SHARE REGIONAL ANALYSIS, 2025–2034, (USD MILLION)
FIGURE 78 CHINA FRUCTOOLIGOSACCHARIDE CURRENT AND FUTURE TYPE ANALYSIS, 2025–2034, (USD MILLION)
FIGURE 79 CHINA FRUCTOOLIGOSACCHARIDE CURRENT AND FUTURE END USER ANALYSIS, 2025–2034, (USD MILLION)
FIGURE 80 JAPAN FRUCTOOLIGOSACCHARIDE CURRENT AND FUTURE TYPE ANALYSIS, 2025–2034, (USD MILLION)
FIGURE 81 JAPAN FRUCTOOLIGOSACCHARIDE CURRENT AND FUTURE END USER ANALYSIS, 2025–2034, (USD MILLION)
FIGURE 82 AUSTRALIA FRUCTOOLIGOSACCHARIDE CURRENT AND FUTURE TYPE ANALYSIS, 2025–2034, (USD MILLION)
FIGURE 83 AUSTRALIA FRUCTOOLIGOSACCHARIDE CURRENT AND FUTURE END USER ANALYSIS, 2025–2034, (USD MILLION)
FIGURE 84 CAMBODIA FRUCTOOLIGOSACCHARIDE CURRENT AND FUTURE TYPE ANALYSIS, 2025–2034, (USD MILLION)
FIGURE 85 CAMBODIA FRUCTOOLIGOSACCHARIDE CURRENT AND FUTURE END USER ANALYSIS, 2025–2034, (USD MILLION)
FIGURE 86 FIJI FRUCTOOLIGOSACCHARIDE CURRENT AND FUTURE TYPE ANALYSIS, 2025–2034, (USD MILLION)
FIGURE 87 FIJI FRUCTOOLIGOSACCHARIDE CURRENT AND FUTURE END USER ANALYSIS, 2025–2034, (USD MILLION)
FIGURE 88 INDONESIA FRUCTOOLIGOSACCHARIDE CURRENT AND FUTURE TYPE ANALYSIS, 2025–2034, (USD MILLION)
FIGURE 89 INDONESIA FRUCTOOLIGOSACCHARIDE CURRENT AND FUTURE END USER ANALYSIS, 2025–2034, (USD MILLION)
FIGURE 90 SOUTH KOREA FRUCTOOLIGOSACCHARIDE CURRENT AND FUTURE TYPE ANALYSIS, 2025–2034, (USD MILLION)
FIGURE 91 SOUTH KOREA FRUCTOOLIGOSACCHARIDE CURRENT AND FUTURE END USER ANALYSIS, 2025–2034, (USD MILLION)
FIGURE 92 REST OF EAST ASIA AND PACIFIC FRUCTOOLIGOSACCHARIDE CURRENT AND FUTURE TYPE ANALYSIS, 2025–2034, (USD MILLION)
FIGURE 93 REST OF EAST ASIA AND PACIFIC FRUCTOOLIGOSACCHARIDE CURRENT AND FUTURE END USER ANALYSIS, 2025–2034, (USD MILLION)
FIGURE 94 SEA AND SOUTH ASIA FRUCTOOLIGOSACCHARIDE CURRENT AND FUTURE MARKET VOLUME SHARE REGIONAL ANALYSIS, 2025–2034, (USD MILLION)
FIGURE 95 BANGLADESH FRUCTOOLIGOSACCHARIDE CURRENT AND FUTURE TYPE ANALYSIS, 2025–2034, (USD MILLION)
FIGURE 96 BANGLADESH FRUCTOOLIGOSACCHARIDE CURRENT AND FUTURE END USER ANALYSIS, 2025–2034, (USD MILLION)
FIGURE 97 NEW ZEALAND FRUCTOOLIGOSACCHARIDE CURRENT AND FUTURE TYPE ANALYSIS, 2025–2034, (USD MILLION)
FIGURE 98 NEW ZEALAND FRUCTOOLIGOSACCHARIDE CURRENT AND FUTURE END USER ANALYSIS, 2025–2034, (USD MILLION)
FIGURE 99 INDIA FRUCTOOLIGOSACCHARIDE CURRENT AND FUTURE TYPE ANALYSIS, 2025–2034, (USD MILLION)
FIGURE 100 INDIA FRUCTOOLIGOSACCHARIDE CURRENT AND FUTURE END USER ANALYSIS, 2025–2034, (USD MILLION)
FIGURE 101 SINGAPORE FRUCTOOLIGOSACCHARIDE CURRENT AND FUTURE TYPE ANALYSIS, 2025–2034, (USD MILLION)
FIGURE 102 SINGAPORE FRUCTOOLIGOSACCHARIDE CURRENT AND FUTURE END USER ANALYSIS, 2025–2034, (USD MILLION)
FIGURE 103 THAILAND FRUCTOOLIGOSACCHARIDE CURRENT AND FUTURE TYPE ANALYSIS, 2025–2034, (USD MILLION)
FIGURE 104 THAILAND FRUCTOOLIGOSACCHARIDE CURRENT AND FUTURE END USER ANALYSIS, 2025–2034, (USD MILLION)
FIGURE 105 TAIWAN FRUCTOOLIGOSACCHARIDE CURRENT AND FUTURE TYPE ANALYSIS, 2025–2034, (USD MILLION)
FIGURE 106 TAIWAN FRUCTOOLIGOSACCHARIDE CURRENT AND FUTURE END USER ANALYSIS, 2025–2034, (USD MILLION)
FIGURE 107 MALAYSIA FRUCTOOLIGOSACCHARIDE CURRENT AND FUTURE TYPE ANALYSIS, 2025–2034, (USD MILLION)
FIGURE 108 MALAYSIA FRUCTOOLIGOSACCHARIDE CURRENT AND FUTURE END USER ANALYSIS, 2025–2034, (USD MILLION)
FIGURE 109 REST OF SEA AND SOUTH ASIA FRUCTOOLIGOSACCHARIDE CURRENT AND FUTURE TYPE ANALYSIS, 2025–2034, (USD MILLION)
FIGURE 110 REST OF SEA AND SOUTH ASIA FRUCTOOLIGOSACCHARIDE CURRENT AND FUTURE END USER ANALYSIS, 2025–2034, (USD MILLION)
FIGURE 111 MIDDLE EAST AND AFRICA FRUCTOOLIGOSACCHARIDE CURRENT AND FUTURE MARKET VOLUME SHARE REGIONAL ANALYSIS, 2025–2034, (USD MILLION)
FIGURE 112 GCC COUNTRIES FRUCTOOLIGOSACCHARIDE CURRENT AND FUTURE TYPE ANALYSIS, 2025–2034, (USD MILLION)
FIGURE 113 GCC COUNTRIES FRUCTOOLIGOSACCHARIDE CURRENT AND FUTURE END USER ANALYSIS, 2025–2034, (USD MILLION)
FIGURE 114 SAUDI ARABIA FRUCTOOLIGOSACCHARIDE CURRENT AND FUTURE TYPE ANALYSIS, 2025–2034, (USD MILLION)
FIGURE 115 SAUDI ARABIA FRUCTOOLIGOSACCHARIDE CURRENT AND FUTURE END USER ANALYSIS, 2025–2034, (USD MILLION)
FIGURE 116 UAE FRUCTOOLIGOSACCHARIDE CURRENT AND FUTURE TYPE ANALYSIS, 2025–2034, (USD MILLION)
FIGURE 117 UAE FRUCTOOLIGOSACCHARIDE CURRENT AND FUTURE END USER ANALYSIS, 2025–2034, (USD MILLION)
FIGURE 118 BAHRAIN FRUCTOOLIGOSACCHARIDE CURRENT AND FUTURE TYPE ANALYSIS, 2025–2034, (USD MILLION)
FIGURE 119 BAHRAIN FRUCTOOLIGOSACCHARIDE CURRENT AND FUTURE END USER ANALYSIS, 2025–2034, (USD MILLION)
FIGURE 120 KUWAIT FRUCTOOLIGOSACCHARIDE CURRENT AND FUTURE TYPE ANALYSIS, 2025–2034, (USD MILLION)
FIGURE 121 KUWAIT FRUCTOOLIGOSACCHARIDE CURRENT AND FUTURE END USER ANALYSIS, 2025–2034, (USD MILLION)
FIGURE 122 OMAN FRUCTOOLIGOSACCHARIDE CURRENT AND FUTURE TYPE ANALYSIS, 2025–2034, (USD MILLION)
FIGURE 123 OMAN FRUCTOOLIGOSACCHARIDE CURRENT AND FUTURE END USER ANALYSIS, 2025–2034, (USD MILLION)
FIGURE 124 QATAR FRUCTOOLIGOSACCHARIDE CURRENT AND FUTURE TYPE ANALYSIS, 2025–2034, (USD MILLION)
FIGURE 125 QATAR FRUCTOOLIGOSACCHARIDE CURRENT AND FUTURE END USER ANALYSIS, 2025–2034, (USD MILLION)
FIGURE 126 EGYPT FRUCTOOLIGOSACCHARIDE CURRENT AND FUTURE TYPE ANALYSIS, 2025–2034, (USD MILLION)
FIGURE 127 EGYPT FRUCTOOLIGOSACCHARIDE CURRENT AND FUTURE END USER ANALYSIS, 2025–2034, (USD MILLION)
FIGURE 128 NIGERIA FRUCTOOLIGOSACCHARIDE CURRENT AND FUTURE TYPE ANALYSIS, 2025–2034, (USD MILLION)
FIGURE 129 NIGERIA FRUCTOOLIGOSACCHARIDE CURRENT AND FUTURE END USER ANALYSIS, 2025–2034, (USD MILLION)
FIGURE 130 SOUTH AFRICA FRUCTOOLIGOSACCHARIDE CURRENT AND FUTURE TYPE ANALYSIS, 2025–2034, (USD MILLION)
FIGURE 131 SOUTH AFRICA FRUCTOOLIGOSACCHARIDE CURRENT AND FUTURE END USER ANALYSIS, 2025–2034, (USD MILLION)
FIGURE 132 ISRAEL FRUCTOOLIGOSACCHARIDE CURRENT AND FUTURE TYPE ANALYSIS, 2025–2034, (USD MILLION)
FIGURE 133 ISRAEL FRUCTOOLIGOSACCHARIDE CURRENT AND FUTURE END USER ANALYSIS, 2025–2034, (USD MILLION)
FIGURE 134 REST OF MEA FRUCTOOLIGOSACCHARIDE CURRENT AND FUTURE TYPE ANALYSIS, 2025–2034, (USD MILLION)
FIGURE 135 REST OF MEA FRUCTOOLIGOSACCHARIDE CURRENT AND FUTURE END USER ANALYSIS, 2025–2034, (USD MILLION)
FIGURE 136 U. S. MARKET SHARE ANALYSIS BY TYPE (2024)
FIGURE 137 U. S. MARKET SHARE ANALYSIS BY END USER (2024)
FIGURE 138 CANADA MARKET SHARE ANALYSIS BY TYPE (2024)
FIGURE 139 CANADA MARKET SHARE ANALYSIS BY END USER (2024)
FIGURE 140 MEXICO MARKET SHARE ANALYSIS BY TYPE (2024)
FIGURE 141 MEXICO MARKET SHARE ANALYSIS BY END USER (2024)
FIGURE 142 CHINA MARKET SHARE ANALYSIS BY TYPE (2024)
FIGURE 143 CHINA MARKET SHARE ANALYSIS BY END USER (2024)
FIGURE 144 JAPAN MARKET SHARE ANALYSIS BY TYPE (2024)
FIGURE 145 JAPAN MARKET SHARE ANALYSIS BY END USER (2024)
FIGURE 146 INDIA MARKET SHARE ANALYSIS BY TYPE (2024)
FIGURE 147 INDIA MARKET SHARE ANALYSIS BY END USER (2024)
FIGURE 148 SOUTH KOREA MARKET SHARE ANALYSIS BY TYPE (2024)
FIGURE 149 SOUTH KOREA MARKET SHARE ANALYSIS BY END USER (2024)
FIGURE 150 SAUDI ARABIA MARKET SHARE ANALYSIS BY TYPE (2024)
FIGURE 151 SAUDI ARABIA MARKET SHARE ANALYSIS BY END USER (2024)
FIGURE 152 UAE MARKET SHARE ANALYSIS BY TYPE (2024)
FIGURE 153 UAE MARKET SHARE ANALYSIS BY END USER (2024)
FIGURE 154 EGYPT MARKET SHARE ANALYSIS BY TYPE (2024)
FIGURE 155 EGYPT MARKET SHARE ANALYSIS BY END USER (2024)
FIGURE 156 NIGERIA MARKET SHARE ANALYSIS BY TYPE (2024)
FIGURE 157 NIGERIA MARKET SHARE ANALYSIS BY END USER (2024)
FIGURE 158 SOUTH AFRICA MARKET SHARE ANALYSIS BY TYPE (2024)
FIGURE 159 SOUTH AFRICA MARKET SHARE ANALYSIS BY END USER (2024)
FIGURE 160 GERMANY MARKET SHARE ANALYSIS BY TYPE (2024)
FIGURE 161 GERMANY MARKET SHARE ANALYSIS BY END USER (2024)
FIGURE 162 FRANCE MARKET SHARE ANALYSIS BY TYPE (2024)
FIGURE 163 FRANCE MARKET SHARE ANALYSIS BY END USER (2024)
FIGURE 164 UK MARKET SHARE ANALYSIS BY TYPE (2024)
FIGURE 165 UK MARKET SHARE ANALYSIS BY END USER (2024)
FIGURE 166 SPAIN MARKET SHARE ANALYSIS BY TYPE (2024)
FIGURE 167 SPAIN MARKET SHARE ANALYSIS BY END USER (2024)
FIGURE 168 ITALY MARKET SHARE ANALYSIS BY TYPE (2024)
FIGURE 169 ITALY MARKET SHARE ANALYSIS BY END USER (2024)
FIGURE 170 BRAZIL MARKET SHARE ANALYSIS BY TYPE (2024)
FIGURE 171 BRAZIL MARKET SHARE ANALYSIS BY END USER (2024)
FIGURE 172 ARGENTINA MARKET SHARE ANALYSIS BY TYPE (2024)
FIGURE 173 ARGENTINA MARKET SHARE ANALYSIS BY END USER (2024)
FIGURE 174 COLUMBIA MARKET SHARE ANALYSIS BY TYPE (2024)
FIGURE 175 COLUMBIA MARKET SHARE ANALYSIS BY END USER (2024)
FIGURE 176 GLOBAL FRUCTOOLIGOSACCHARIDE CURRENT AND FUTURE MARKET KEY COUNTRY LEVEL ANALYSIS, 2024–2034, (USD MILLION)
FIGURE 177 FINANCIAL OVERVIEW:
Key Players Analysis:
Tate & Lyle PLC: Tate & Lyle has significantly expanded its presence in the FOS market through strategic acquisitions and product innovation. In 2022, the company acquired Quantum Hi-Tech, a prominent Chinese prebiotic dietary fiber business specializing in FOS and galactooligosaccharides (GOS). This acquisition bolstered Tate & Lyle's position in the global dietary fiber market and enhanced its footprint in Asia. Furthermore, Tate & Lyle has developed hybrid fiber solutions combining FOS with resistant starch, aiming to provide dual digestive health benefits. These initiatives reflect the company's commitment to meeting the growing demand for prebiotic ingredients in functional foods and beverages.
Beneo: Beneo, a subsidiary of Südzucker AG, is a leading supplier of functional ingredients, including FOS derived from chicory root. The company has a strong focus on prebiotic fibers, offering high-purity FOS products that support digestive health. Beneo's FOS ingredients are widely used in various applications, such as infant nutrition, dairy products, and baked goods. The company's commitment to scientific research and innovation has solidified its position as a key player in the FOS market.
Tata Chemicals: Tata Chemicals, through its Nutrition Science division, produces FOSSENCE®, a short-chain FOS ingredient manufactured using proprietary fermentation technology at its Mambattu facility. FOSSENCE® is utilized across multiple applications, including food and beverages, infant nutrition, and animal feed. The product is recognized for its prebiotic benefits, promoting gut health by stimulating beneficial bacteria. Tata Chemicals' emphasis on innovation and quality has enabled it to establish a strong presence in the FOS market, catering to both domestic and international customers.
Cargill, Incorporated: Cargill is a major player in the global FOS market, offering a range of prebiotic ingredients for various applications. The company has developed high-solubility liquid FOS solutions tailored for functional beverages, dairy alternatives, and gut health products. Cargill's extensive distribution network and focus on innovation have allowed it to meet the increasing demand for prebiotic fibers in the food and beverage industry.
Ingredion: Ingredion is a prominent supplier of FOS, providing chicory-based prebiotic fibers for the food and beverage sector. The company has expanded its production capabilities in North America to meet the growing demand for gut health-enhancing ingredients. Ingredion's FOS products are utilized in various applications, including bakery, dairy, and functional beverages. The company's commitment to sustainability and innovation has reinforced its position in the FOS market.
Market Key Players
Tate & Lyle PLC
Beneo
Tata Chemicals
Biosynth
Brenntag SE
Meiji Holdings Co., Ltd.
Cargill, Incorporated
ELICITYL
Tereos Group
Galam Group
Ingredion
Jarrow Formulas Inc.
New Francisco Biotechnology Corporation
Quantum Hi-Tech
Nutra Food Ingredients
Driver:
Growing Consumer Focus on Digestive Health
Consumers are becoming increasingly aware of the link between gut health and overall well-being, which has significantly boosted the demand for prebiotics like FOS. Fructooligosaccharides help increase the growth of beneficial gut bacteria such as bifidobacteria, which improve digestion and immunity. This shift is especially prominent in urban populations, where lifestyle-related digestive issues are common. Moreover, doctors and nutritionists are now recommending prebiotic-enriched diets as part of holistic healthcare routines. This demand has translated into higher sales of FOS-infused products like yogurts, supplements, and functional beverages. As a result, manufacturers in the food and nutraceutical industries are prioritizing prebiotic formulations, creating a strong pull for FOS materials.
Rising Functional Ingredient Use in Food & Beverage Industry
The food and beverage sector is evolving toward health-centric formulations, integrating natural and functional ingredients. FOS serves as both a sweetener and a fiber source, making it a multifunctional additive that appeals to health-conscious consumers. Unlike synthetic ingredients, FOS is naturally derived and fits clean-label demands. Its mildly sweet taste, low caloric value, and fiber content make it an attractive choice for low-sugar foods, sports nutrition products, and infant formula. Food manufacturers are embracing FOS to align with global trends in health and wellness, especially as sugar-reduction and digestive health become core purchase drivers.
Restrain:
High Production Costs
Manufacturing FOS requires sophisticated enzymatic fermentation processes and quality control measures, which elevate production costs compared to conventional ingredients. Small and medium-sized companies may find it challenging to invest in these technologies or maintain consistent output. Moreover, raw material costs—primarily sucrose or inulin sources—and stringent purification steps also contribute to the high price of the final product. This limits FOS use in price-sensitive markets or budget-oriented product lines. As a result, FOS adoption is currently concentrated in premium health products and developed markets, creating a barrier for mass-market expansion.
Limited Awareness in Developing Markets
In many developing regions, public awareness about gut health and the benefits of prebiotics like FOS remains low. Consumers are more familiar with probiotics than prebiotics, creating a gap in demand education. Moreover, limited access to health-focused food products and fewer marketing campaigns in these areas hinder market penetration. Even though some urban segments are becoming more health-aware, overall outreach remains minimal. Without strong public health advocacy or regulatory endorsement, the benefits of FOS are not fully appreciated, which delays consumer adoption and commercial expansion in these high-potential markets.
Opportunities:
Demand for Plant-Based and Clean-Label Ingredients
Consumers are increasingly seeking products with natural origins and minimal processing. FOS, typically derived from chicory root or sugar beet, aligns well with this preference for clean-label, plant-based ingredients. Its prebiotic benefits and non-GMO sourcing make it ideal for plant-based food formulations, which are rapidly gaining traction globally. Food brands focusing on vegan or allergen-free products are integrating FOS to enhance digestive health while preserving label integrity. As the clean-label movement intensifies, FOS is set to play a prominent role as a functional, natural ingredient in both established and emerging food categories.
Growth in Infant Nutrition and Animal Feed
FOS is being increasingly studied and adopted for use in infant nutrition, particularly in formula milk where it mimics the function of human milk oligosaccharides (HMOs). Its gentle digestive properties and ability to foster healthy gut flora make it suitable for newborns and toddlers. In parallel, FOS is gaining popularity in animal feed—especially for poultry and swine—where it supports immune function and reduces antibiotic dependence. These sectors remain relatively untapped and represent lucrative long-term growth avenues as manufacturers diversify FOS applications beyond mainstream foods.
Trends:
Innovation in Delivery Formats and Blends
As consumer demand for gut-health products grows, manufacturers are developing novel delivery systems such as chewables, gummies, and beverages enriched with FOS. There is also a rising trend of combining FOS with other prebiotics like GOS or inulin to create synergistic blends that provide broader health benefits. These advancements make prebiotics more accessible and palatable, expanding their reach across age groups. Product diversification is helping companies tap into niche segments like sports nutrition, aging populations, and diabetic-friendly foods, keeping the FOS market dynamic and evolving.
Strategic Partnerships and M&A Activity
Leading companies are engaging in mergers, acquisitions, and partnerships to strengthen their position in the FOS space. For instance, Tate & Lyle's acquisition of Quantum Hi-Tech enhanced its capability to offer advanced prebiotic solutions, particularly in Asia. Such consolidations help companies expand their distribution, streamline production, and invest in R&D for tailored prebiotic innovations. This consolidation trend ensures long-term supply chain security and competitive advantage, allowing for faster innovation and wider market reach for FOS-based products.
Recent Development:
In July 2024 - Meiji has introduced a new line of chocolate products that replace sugar with fructooligosaccharides (FOS), targeting health-conscious consumers seeking functional snacks. FOS, a naturally occurring carbohydrate found in plants like garlic, onion, and chicory root, serves as a low-calorie, subtly sweet alternative to sugar and is not digested by the body, meaning it does not impact blood glucose levels.
In 2023 - BENEO, a leading producer of functional ingredients, has expanded its product range with the introduction of Beneo-scL85, a short-chain fructooligosaccharide (scFOS). This new ingredient, derived from beet sugar and produced in Germany, provides manufacturers with greater flexibility for sugar reduction and the addition of dietary fibre in food products.