Fruit & Vegetable Juice Market Size, Growth & Forecast | 8.7% CAGR
Global Fruit and Vegetable Juice Market Size, Share & Analysis By Product Type (Fruit & Vegetable Blend, Fruit Juices, Vegetable Juices), By Type (Regular Juice, Low-Sugar, Fortified), By Distribution Channel (Convenience Stores, Supermarkets/Hypermarkets, Online, Other Distribution Channels), Health & Wellness Trends, Clean-Label Demand, Regional Insights & Forecast 2025–2034
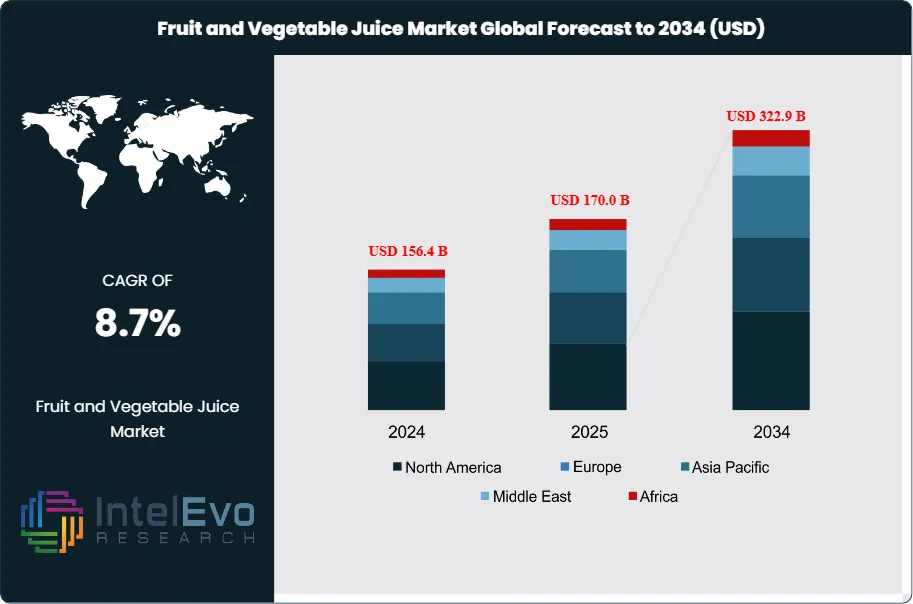
The Fruit and Vegetable Juice Market is valued at approximately USD 156.4 billion in 2024 and is projected to reach nearly USD 322.9 billion by 2034, expanding at a CAGR of around 8.7% during 2025–2034. Rising health consciousness, functional juice innovations, and the surge in cold-pressed, organic, and immunity-boosting blends are reshaping category demand worldwide. Consumers are increasingly shifting from sugary carbonated drinks to natural, nutrient-dense juice formats, driving strong retail momentum. Clean-label formulations, premium fruit blends, and convenient on-the-go packaging are becoming major growth accelerators, making this one of the most vibrant segments in the global beverages market.
Following a steady recovery from pandemic-era channel disruptions, the category has shifted from volume-led to value-led growth as consumers’ trade up to not-from-concentrate (NFC), cold-pressed, and functional blends. Historically, demand expanded at approximately 4–5% CAGR between 2018 and 2024, but the forecast period is characterized by premiumization and healthier formulation trends that lift average selling prices and expand margins.
On the demand side, rising health consciousness, the mainstreaming of “5-a-day” nutrition, and the search for immune and gut-health benefits are propelling double-digit growth in functional SKUs; products fortified with vitamins, probiotics, or fiber are projected to outpace the total market by 300–500 basis points.
Supply-side drivers include improved year-round availability via diversified sourcing and cold-chain investments, while recurring challenges stem from agricultural yield volatility, climate-related shocks in citrus and apple harvests, and tightening sugar and labeling regulations. Sugar taxes and front-of-pack nutrition schemes, now active or proposed in more than 40 markets, are accelerating reformulation toward low/no-added-sugar lines, which are growing at an estimated 8–9% annually.
Technology is reshaping product quality and route-to-market: high-pressure processing (HPP) and advanced aseptic lines extend shelf life without compromising flavor, with processing costs declining an estimated 15–20% over five years; AI-enabled demand forecasting and precision agriculture improve raw-material planning and reduce waste; and digital traceability elevates provenance as a purchase cue. Notably, e-commerce and quick-commerce together account for an estimated 10–12% of retail juice sales in leading urban markets, compounding at >15% as basket sizes shift online.
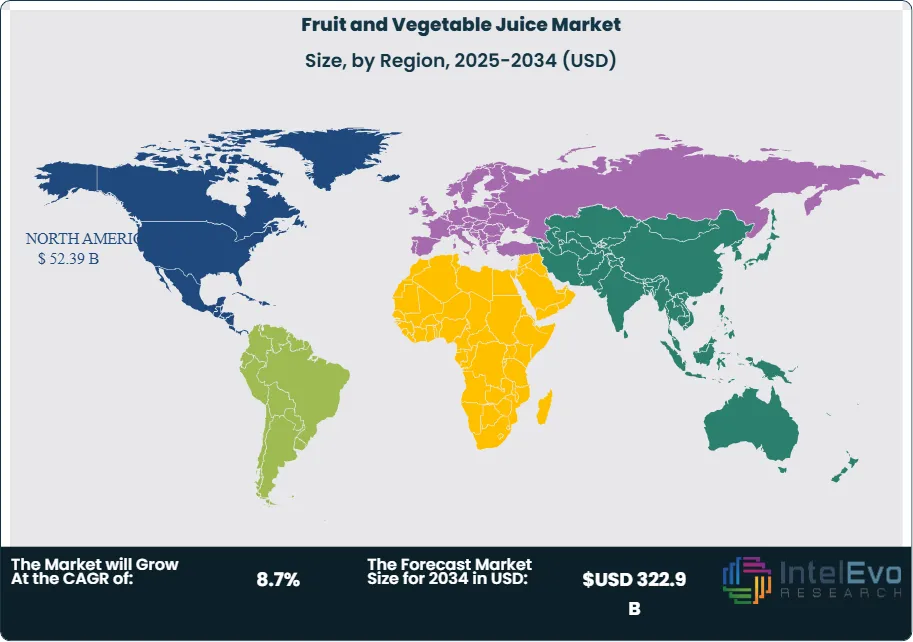
Regionally, North America and Western Europe remain high-value, regulation-intensive markets with stable 3–4% growth, while Asia Pacific is the clear volume and growth engine, projected at 8–9% CAGR on the back of urbanization, modern trade expansion, and rising middle-class incomes in China, India, and Southeast Asia. Latin America offers strategic citrus supply advantages and growing domestic consumption, and the Gulf states are emerging premium import hubs. Investment hotspots include HPP-enabled premium brands, NFC and vegetable-forward blends, recyclable lightweight PET and carton packaging, and omnichannel platforms targeting Tier-2/3 cities across Asia.
Key Takeaways
Market Growth: The global Fruit & Vegetable Juice market is projected to reach USD 322.9 billion by 2034, up from USD 156.4 billion in 2024, reflecting a 8.7% CAGR driven by health-and-wellness positioning, premiumization (NFC, cold-pressed), and wider modern retail access.
Segment Dominance – Product Type: Fruit juices led with a 62.3% revenue share in 2024, underpinned by orange and apple lines from majors such as Tropicana Brands Group and Coca-Cola’s Minute Maid/Simply; vegetable and blended juices comprise the remaining ~37.7%, gaining traction for lower sugar profiles and functional nutrition.
Segment Dominance – Distribution Channel: Supermarkets/Hypermarkets accounted for 52.3% of sales in 2024 due to assortment breadth and promotions, while online grocery and DTC together are estimated at ~10–12% of category sales in leading urban markets and compounding >15% annually.
Driver: Rising health consciousness and “food as medicine” behaviors are accelerating uptake of fortified SKUs (vitamins, probiotics, fiber), which are outpacing the total market by an estimated 300–500 bps, supported by clean-label claims and cold-chain availability.
Restraint: Agricultural yield volatility and climate-related shocks in citrus and apple supply elevate input costs and price dispersion; in poor harvest years, raw commodity spikes of 20–30% can compress margins and trigger selective price increases or pack-size reductions.
Opportunity: Asia Pacific is the clear growth engine, expected to expand at ~8–9% CAGR, supported by urbanization, rising mid-income consumption in China, India, and Southeast Asia, and modern trade penetration—likely contributing >40% of absolute global revenue growth to 2034.
Trend: High-pressure processing (HPP) and advanced aseptic filling are scaling, enabling longer shelf life without preservatives; processing efficiencies have lowered per-liter costs by ~15–20% over five years, catalyzing premium cold-pressed launches from players like Suja and Innocent.
Regional Analysis: North America held 33.5% of global revenue in 2024, with steady 3–4% growth amid sugar-reduction and functional trends; Western Europe remains regulation-intensive but premium-oriented; Asia Pacific leads in volume and growth; GCC markets emerge as premium import hubs, while Latin America offers strategic citrus sourcing alongside improving domestic demand.
Product Type Analysis
Fruit juices remain the anchor category, holding an estimated 62.3% share in 2024 and retaining leadership through 2025 on the strength of orange and apple lines from scaled brands and private labels. While volumes are steady, the value mix is shifting toward not-from-concentrate (NFC) and cold-pressed SKUs, lifting average selling prices and supporting mid-single-digit growth even in mature markets.
Vegetable juices are smaller in absolute terms but are expanding faster as consumers seek lower-sugar, nutrient-dense options; carrot, beet, and tomato ranges are projected to grow at roughly 7–8% CAGR through 2030, supported by HPP and aseptic processing that enhance freshness without preservatives. Fruit-and-vegetable blends are emerging as a sweet spot, marrying palatability with function (e.g., apple–carrot–ginger); this subcategory is expected to outpace the total market by 200–300 bps as immunity, gut health, and energy claims resonate with urban, on-the-go consumers.
Type Analysis
Regular juice accounted for just over 53% of sales in 2024 and will remain the volume workhorse, particularly in family multipacks and foodservice. Nonetheless, its share is expected to edge down to ~49–50% by 2030 as policy (sugar taxes, front-of-pack labels) and retailer targets for sugar reduction redirect growth to reformulated lines.
Low-sugar (no-added-sugar/low-calorie) juices are the fastest-growing type, projected at ~8–9% CAGR through 2030 on the back of NFC bases, fruit-and-veg blends, and natural sweeteners. Fortified juices—enriched with vitamins, fiber, electrolytes, or probiotics—are scaling as “food-as-medicine” gains traction; this segment is expected to approach a ~20–22% share by 2030, with functional SKUs typically commanding 10–20% price premiums and higher repeat rates.
Distribution Channel Analysis
Supermarkets/Hypermarkets captured ~52.3% of category sales in 2024 and will remain the primary purchasing venue through 2025, aided by breadth of assortment, private-label expansion, and end-cap promotions. Retailers are also allocating more chilled space to NFC and HPP ranges, improving trial and trading consumers up from ambient cartons.
Convenience stores leverage single-serve and immediate-consumption missions, sustaining a ~20–22% share, particularly for 250–350 ml PET and can formats tied to breakfast and snacking occasions. Online (e-grocery, quick-commerce, and DTC subscriptions) accounts for an estimated 10–12% of sales in leading urban markets and is compounding >15% annually, supported by basket bundling, scheduled delivery, and discovery of premium niche brands. Specialty and health stores, cafés, and local markets (Other channels) provide incremental reach for artisanal and functional SKUs despite lower overall share.
Regional Analysis
North America led with ~33.5% revenue share in 2024 and is expected to post steady 3–4% value growth through 2030, driven by premiumization (NFC, cold-pressed) and functional fortification. Europe remains a high-value, regulation-intensive market; sugar and labeling rules are accelerating reformulation and supporting higher-margin lines, though overall growth is moderate at ~2–3% amid mature per-capita consumption.
Asia Pacific is the clear growth engine, projected at ~8–9% CAGR as modern trade expands in China, India, and Southeast Asia, supported by rising middle-income households and rapid e-commerce adoption; the region is likely to contribute >40% of absolute global growth through 2030. Latin America combines strategic citrus supply with improving domestic demand (5–6% CAGR), while the Middle East & Africa, led by GCC import hubs and urbanizing African metros, is expected to grow ~6–7%, favoring premium imports and ambient formats where cold-chain is limited.
By Product Type (Fruit & Vegetable Blend, Fruit Juices, Vegetable Juices), By Type (Regular Juice, Low-Sugar, Fortified), By Distribution Channel (Convenience Stores, Supermarkets/Hypermarkets, Online, Other Distribution Channels)
Research Methodology
Primary Research- 100 Interviews of Stakeholders
Secondary Research
Desk Research
Regional scope
North America (United States, Canada, Mexico)
Latin America (Brazil, Argentina, Columbia)
East Asia And Pacific (China, Japan, South Korea, Australia, Cambodia, Fiji, Indonesia)
Sea And South Asia (India, Singapore, Thailand, Taiwan, Malaysia)
Eastern Europe (Poland, Russia, Czech Republic, Romania)
Western Europe (Germany, U.K., France, Spain, Itlay)
Middle East & Africa (GCC Countries, Egypt, Nigeria, South Africa, Israel)
Competitive Landscape
Welch Foods, Inc., Citrus World Inc., The Kraft Heinz Company, Fresh Del Monte Produce, Ocean Spray Cranberries, Inc., Campbell Soup Company, PepsiCo Inc., Keurig Dr Pepper Inc., Nestle S.A., Reed’s, Inc., Del Monte Foods, Eckes-Granini Group, Dr. Pepper Snapple Group, The Coca-Cola Company
Customization Scope
Customization for segments, region/country-level will be provided. Moreover, additional customization can be done based on the requirements.
Pricing and Purchase Options
Avail customized purchase options to meet your exact research needs. We have three licenses to opt for: Single User License, Multi-User License (Up to 5 Users), Corporate Use License (Unlimited User and Printable PDF).
TABLE OF CONTENTS
1. EXECUTIVE SUMMARY
1.1. MARKET SNAPSHOT
1.2. KEY FINDINGS & INSIGHTS
1.3. ANALYST RECOMMENDATIONS
1.4. FUTURE OUTLOOK
2. RESEARCH METHODOLOGY
2.1. MARKET DEFINITION & SCOPE
2.2. RESEARCH OBJECTIVES: PRIMARY & SECONDARY DATA SOURCES
2.3. DATA COLLECTION SOURCES
2.3.1. COVERAGE OF 100+ PRIMARY RESEARCH/CONSULTATION CALLS WITH INDUSTRY STAKEHOLDERS
FIGURE 17 NORTH AMERICA FRUIT AND VEGETABLE JUICE SYSTEM CURRENT AND FUTURE TYPE ANALYSIS, 2025–2034, (USD MILLION)
FIGURE 18 NORTH AMERICA FRUIT AND VEGETABLE JUICE SYSTEM CURRENT AND FUTURE END USER ANALYSIS, 2025–2034, (USD MILLION)
FIGURE 19 MARKET SHARE BY COUNTRY
FIGURE 20 LATIN AMERICA FRUIT AND VEGETABLE JUICE SYSTEM CURRENT AND FUTURE TYPE ANALYSIS, 2025–2034, (USD MILLION)
FIGURE 21 LATIN AMERICA FRUIT AND VEGETABLE JUICE SYSTEM CURRENT AND FUTURE END USER ANALYSIS, 2025–2034, (USD MILLION)
FIGURE 22 MARKET SHARE BY COUNTRY
FIGURE 23 EASTERN EUROPE FRUIT AND VEGETABLE JUICE SYSTEM CURRENT AND FUTURE TYPE ANALYSIS, 2025–2034, (USD MILLION)
FIGURE 24 EASTERN EUROPE FRUIT AND VEGETABLE JUICE SYSTEM CURRENT AND FUTURE END USER ANALYSIS, 2025–2034, (USD MILLION)
FIGURE 25 MARKET SHARE BY COUNTRY
FIGURE 26 WESTERN EUROPE FRUIT AND VEGETABLE JUICE SYSTEM CURRENT AND FUTURE TYPE ANALYSIS, 2025–2034, (USD MILLION)
FIGURE 27 WESTERN EUROPE FRUIT AND VEGETABLE JUICE SYSTEM CURRENT AND FUTURE END USER ANALYSIS, 2025–2034, (USD MILLION)
FIGURE 28 MARKET SHARE BY COUNTRY
FIGURE 29 EAST ASIA AND PACIFIC FRUIT AND VEGETABLE JUICE SYSTEM CURRENT AND FUTURE TYPE ANALYSIS, 2025–2034, (USD MILLION)
FIGURE 30 EAST ASIA AND PACIFIC FRUIT AND VEGETABLE JUICE SYSTEM CURRENT AND FUTURE END USER ANALYSIS, 2025–2034, (USD MILLION)
FIGURE 31 MARKET SHARE BY COUNTRY
FIGURE 32 SEA AND SOUTH ASIA FRUIT AND VEGETABLE JUICE SYSTEM CURRENT AND FUTURE TYPE ANALYSIS, 2025–2034, (USD MILLION)
FIGURE 33 SEA AND SOUTH ASIA FRUIT AND VEGETABLE JUICE SYSTEM CURRENT AND FUTURE END USER ANALYSIS, 2025–2034, (USD MILLION)
FIGURE 34 MARKET SHARE BY COUNTRY
FIGURE 35 MIDDLE EAST AND AFRICA FRUIT AND VEGETABLE JUICE SYSTEM CURRENT AND FUTURE TYPE ANALYSIS, 2025–2034, (USD MILLION)
FIGURE 36 MIDDLE EAST AND AFRICA FRUIT AND VEGETABLE JUICE SYSTEM CURRENT AND FUTURE END USER ANALYSIS, 2025–2034, (USD MILLION)
FIGURE 37 NORTH AMERICA FRUIT AND VEGETABLE JUICE SYSTEM CURRENT AND FUTURE MARKET VOLUME SHARE REGIONAL ANALYSIS, 2025–2034, (USD MILLION)
FIGURE 38 U.S. FRUIT AND VEGETABLE JUICE SYSTEM CURRENT AND FUTURE TYPE ANALYSIS, 2025–2034, (USD MILLION)
FIGURE 39 U.S. FRUIT AND VEGETABLE JUICE SYSTEM CURRENT AND FUTURE END USER ANALYSIS, 2025–2034, (USD MILLION)
FIGURE 40 CANADA FRUIT AND VEGETABLE JUICE SYSTEM CURRENT AND FUTURE TYPE ANALYSIS, 2025–2034, (USD MILLION)
FIGURE 41 CANADA FRUIT AND VEGETABLE JUICE SYSTEM CURRENT AND FUTURE END USER ANALYSIS, 2025–2034, (USD MILLION)
FIGURE 42 LATIN AMERICA FRUIT AND VEGETABLE JUICE SYSTEM CURRENT AND FUTURE MARKET VOLUME SHARE REGIONAL ANALYSIS, 2025–2034, (USD MILLION)
FIGURE 43 MEXICO FRUIT AND VEGETABLE JUICE SYSTEM CURRENT AND FUTURE TYPE ANALYSIS, 2025–2034, (USD MILLION)
FIGURE 44 MEXICO FRUIT AND VEGETABLE JUICE SYSTEM CURRENT AND FUTURE END USER ANALYSIS, 2025–2034, (USD MILLION)
FIGURE 45 BRAZIL FRUIT AND VEGETABLE JUICE SYSTEM CURRENT AND FUTURE TYPE ANALYSIS, 2025–2034, (USD MILLION)
FIGURE 46 BRAZIL FRUIT AND VEGETABLE JUICE SYSTEM CURRENT AND FUTURE END USER ANALYSIS, 2025–2034, (USD MILLION)
FIGURE 47 ARGENTINA FRUIT AND VEGETABLE JUICE SYSTEM CURRENT AND FUTURE TYPE ANALYSIS, 2025–2034, (USD MILLION)
FIGURE 48 ARGENTINA FRUIT AND VEGETABLE JUICE SYSTEM CURRENT AND FUTURE END USER ANALYSIS, 2025–2034, (USD MILLION)
FIGURE 49 COLUMBIA FRUIT AND VEGETABLE JUICE SYSTEM CURRENT AND FUTURE TYPE ANALYSIS, 2025–2034, (USD MILLION)
FIGURE 50 COLUMBIA FRUIT AND VEGETABLE JUICE SYSTEM CURRENT AND FUTURE END USER ANALYSIS, 2025–2034, (USD MILLION)
FIGURE 51 REST OF LATIN AMERICA FRUIT AND VEGETABLE JUICE SYSTEM CURRENT AND FUTURE TYPE ANALYSIS, 2025–2034, (USD MILLION)
FIGURE 52 REST OF LATIN AMERICA FRUIT AND VEGETABLE JUICE SYSTEM CURRENT AND FUTURE END USER ANALYSIS, 2025–2034, (USD MILLION)
FIGURE 53 EASTERN EUROPE FRUIT AND VEGETABLE JUICE SYSTEM CURRENT AND FUTURE MARKET VOLUME SHARE REGIONAL ANALYSIS, 2025–2034, (USD MILLION)
FIGURE 54 POLAND FRUIT AND VEGETABLE JUICE SYSTEM CURRENT AND FUTURE TYPE ANALYSIS, 2025–2034, (USD MILLION)
FIGURE 55 POLAND FRUIT AND VEGETABLE JUICE SYSTEM CURRENT AND FUTURE END USER ANALYSIS, 2025–2034, (USD MILLION)
FIGURE 56 RUSSIA FRUIT AND VEGETABLE JUICE SYSTEM CURRENT AND FUTURE TYPE ANALYSIS, 2025–2034, (USD MILLION)
FIGURE 57 RUSSIA FRUIT AND VEGETABLE JUICE SYSTEM CURRENT AND FUTURE END USER ANALYSIS, 2025–2034, (USD MILLION)
FIGURE 58 CZECH REPUBLIC FRUIT AND VEGETABLE JUICE SYSTEM CURRENT AND FUTURE TYPE ANALYSIS, 2025–2034, (USD MILLION)
FIGURE 59 CZECH REPUBLIC FRUIT AND VEGETABLE JUICE SYSTEM CURRENT AND FUTURE END USER ANALYSIS, 2025–2034, (USD MILLION)
FIGURE 60 ROMANIA FRUIT AND VEGETABLE JUICE SYSTEM CURRENT AND FUTURE TYPE ANALYSIS, 2025–2034, (USD MILLION)
FIGURE 61 ROMANIA FRUIT AND VEGETABLE JUICE SYSTEM CURRENT AND FUTURE END USER ANALYSIS, 2025–2034, (USD MILLION)
FIGURE 62 REST OF EASTERN EUROPE FRUIT AND VEGETABLE JUICE SYSTEM CURRENT AND FUTURE TYPE ANALYSIS, 2025–2034, (USD MILLION)
FIGURE 63 REST OF EASTERN EUROPE FRUIT AND VEGETABLE JUICE SYSTEM CURRENT AND FUTURE END USER ANALYSIS, 2025–2034, (USD MILLION)
FIGURE 64 WESTERN EUROPE FRUIT AND VEGETABLE JUICE SYSTEM CURRENT AND FUTURE MARKET VOLUME SHARE REGIONAL ANALYSIS, 2025–2034, (USD MILLION)
FIGURE 65 GERMANY FRUIT AND VEGETABLE JUICE SYSTEM CURRENT AND FUTURE TYPE ANALYSIS, 2025–2034, (USD MILLION)
FIGURE 66 GERMANY FRUIT AND VEGETABLE JUICE SYSTEM CURRENT AND FUTURE END USER ANALYSIS, 2025–2034, (USD MILLION)
FIGURE 67 FRANCE FRUIT AND VEGETABLE JUICE SYSTEM CURRENT AND FUTURE TYPE ANALYSIS, 2025–2034, (USD MILLION)
FIGURE 68 FRANCE FRUIT AND VEGETABLE JUICE SYSTEM CURRENT AND FUTURE END USER ANALYSIS, 2025–2034, (USD MILLION)
FIGURE 69 UK FRUIT AND VEGETABLE JUICE SYSTEM CURRENT AND FUTURE TYPE ANALYSIS, 2025–2034, (USD MILLION)
FIGURE 70 UK FRUIT AND VEGETABLE JUICE SYSTEM CURRENT AND FUTURE END USER ANALYSIS, 2025–2034, (USD MILLION)
FIGURE 71 SPAIN FRUIT AND VEGETABLE JUICE SYSTEM CURRENT AND FUTURE TYPE ANALYSIS, 2025–2034, (USD MILLION)
FIGURE 72 SPAIN FRUIT AND VEGETABLE JUICE SYSTEM CURRENT AND FUTURE END USER ANALYSIS, 2025–2034, (USD MILLION)
FIGURE 73 ITALY FRUIT AND VEGETABLE JUICE SYSTEM CURRENT AND FUTURE TYPE ANALYSIS, 2025–2034, (USD MILLION)
FIGURE 74 ITALY FRUIT AND VEGETABLE JUICE SYSTEM CURRENT AND FUTURE END USER ANALYSIS, 2025–2034, (USD MILLION)
FIGURE 75 REST OF WESTERN EUROPE FRUIT AND VEGETABLE JUICE SYSTEM CURRENT AND FUTURE TYPE ANALYSIS, 2025–2034, (USD MILLION)
FIGURE 76 REST OF WESTERN EUROPE FRUIT AND VEGETABLE JUICE SYSTEM CURRENT AND FUTURE END USER ANALYSIS, 2025–2034, (USD MILLION)
FIGURE 77 EAST ASIA AND PACIFIC FRUIT AND VEGETABLE JUICE SYSTEM CURRENT AND FUTURE MARKET VOLUME SHARE REGIONAL ANALYSIS, 2025–2034, (USD MILLION)
FIGURE 78 CHINA FRUIT AND VEGETABLE JUICE SYSTEM CURRENT AND FUTURE TYPE ANALYSIS, 2025–2034, (USD MILLION)
FIGURE 79 CHINA FRUIT AND VEGETABLE JUICE SYSTEM CURRENT AND FUTURE END USER ANALYSIS, 2025–2034, (USD MILLION)
FIGURE 80 JAPAN FRUIT AND VEGETABLE JUICE SYSTEM CURRENT AND FUTURE TYPE ANALYSIS, 2025–2034, (USD MILLION)
FIGURE 81 JAPAN FRUIT AND VEGETABLE JUICE SYSTEM CURRENT AND FUTURE END USER ANALYSIS, 2025–2034, (USD MILLION)
FIGURE 82 AUSTRALIA FRUIT AND VEGETABLE JUICE SYSTEM CURRENT AND FUTURE TYPE ANALYSIS, 2025–2034, (USD MILLION)
FIGURE 83 AUSTRALIA FRUIT AND VEGETABLE JUICE SYSTEM CURRENT AND FUTURE END USER ANALYSIS, 2025–2034, (USD MILLION)
FIGURE 84 CAMBODIA FRUIT AND VEGETABLE JUICE SYSTEM CURRENT AND FUTURE TYPE ANALYSIS, 2025–2034, (USD MILLION)
FIGURE 85 CAMBODIA FRUIT AND VEGETABLE JUICE SYSTEM CURRENT AND FUTURE END USER ANALYSIS, 2025–2034, (USD MILLION)
FIGURE 86 FIJI FRUIT AND VEGETABLE JUICE SYSTEM CURRENT AND FUTURE TYPE ANALYSIS, 2025–2034, (USD MILLION)
FIGURE 87 FIJI FRUIT AND VEGETABLE JUICE SYSTEM CURRENT AND FUTURE END USER ANALYSIS, 2025–2034, (USD MILLION)
FIGURE 88 INDONESIA FRUIT AND VEGETABLE JUICE SYSTEM CURRENT AND FUTURE TYPE ANALYSIS, 2025–2034, (USD MILLION)
FIGURE 89 INDONESIA FRUIT AND VEGETABLE JUICE SYSTEM CURRENT AND FUTURE END USER ANALYSIS, 2025–2034, (USD MILLION)
FIGURE 90 SOUTH KOREA FRUIT AND VEGETABLE JUICE SYSTEM CURRENT AND FUTURE TYPE ANALYSIS, 2025–2034, (USD MILLION)
FIGURE 91 SOUTH KOREA FRUIT AND VEGETABLE JUICE SYSTEM CURRENT AND FUTURE END USER ANALYSIS, 2025–2034, (USD MILLION)
FIGURE 92 REST OF EAST ASIA AND PACIFIC FRUIT AND VEGETABLE JUICE SYSTEM CURRENT AND FUTURE TYPE ANALYSIS, 2025–2034, (USD MILLION)
FIGURE 93 REST OF EAST ASIA AND PACIFIC FRUIT AND VEGETABLE JUICE SYSTEM CURRENT AND FUTURE END USER ANALYSIS, 2025–2034, (USD MILLION)
FIGURE 94 SEA AND SOUTH ASIA FRUIT AND VEGETABLE JUICE SYSTEM CURRENT AND FUTURE MARKET VOLUME SHARE REGIONAL ANALYSIS, 2025–2034, (USD MILLION)
FIGURE 95 BANGLADESH FRUIT AND VEGETABLE JUICE SYSTEM CURRENT AND FUTURE TYPE ANALYSIS, 2025–2034, (USD MILLION)
FIGURE 96 BANGLADESH FRUIT AND VEGETABLE JUICE SYSTEM CURRENT AND FUTURE END USER ANALYSIS, 2025–2034, (USD MILLION)
FIGURE 97 NEW ZEALAND FRUIT AND VEGETABLE JUICE SYSTEM CURRENT AND FUTURE TYPE ANALYSIS, 2025–2034, (USD MILLION)
FIGURE 98 NEW ZEALAND FRUIT AND VEGETABLE JUICE SYSTEM CURRENT AND FUTURE END USER ANALYSIS, 2025–2034, (USD MILLION)
FIGURE 99 INDIA FRUIT AND VEGETABLE JUICE SYSTEM CURRENT AND FUTURE TYPE ANALYSIS, 2025–2034, (USD MILLION)
FIGURE 100 INDIA FRUIT AND VEGETABLE JUICE SYSTEM CURRENT AND FUTURE END USER ANALYSIS, 2025–2034, (USD MILLION)
FIGURE 101 SINGAPORE FRUIT AND VEGETABLE JUICE SYSTEM CURRENT AND FUTURE TYPE ANALYSIS, 2025–2034, (USD MILLION)
FIGURE 102 SINGAPORE FRUIT AND VEGETABLE JUICE SYSTEM CURRENT AND FUTURE END USER ANALYSIS, 2025–2034, (USD MILLION)
FIGURE 103 THAILAND FRUIT AND VEGETABLE JUICE SYSTEM CURRENT AND FUTURE TYPE ANALYSIS, 2025–2034, (USD MILLION)
FIGURE 104 THAILAND FRUIT AND VEGETABLE JUICE SYSTEM CURRENT AND FUTURE END USER ANALYSIS, 2025–2034, (USD MILLION)
FIGURE 105 TAIWAN FRUIT AND VEGETABLE JUICE SYSTEM CURRENT AND FUTURE TYPE ANALYSIS, 2025–2034, (USD MILLION)
FIGURE 106 TAIWAN FRUIT AND VEGETABLE JUICE SYSTEM CURRENT AND FUTURE END USER ANALYSIS, 2025–2034, (USD MILLION)
FIGURE 107 MALAYSIA FRUIT AND VEGETABLE JUICE SYSTEM CURRENT AND FUTURE TYPE ANALYSIS, 2025–2034, (USD MILLION)
FIGURE 108 MALAYSIA FRUIT AND VEGETABLE JUICE SYSTEM CURRENT AND FUTURE END USER ANALYSIS, 2025–2034, (USD MILLION)
FIGURE 109 REST OF SEA AND SOUTH ASIA FRUIT AND VEGETABLE JUICE SYSTEM CURRENT AND FUTURE TYPE ANALYSIS, 2025–2034, (USD MILLION)
FIGURE 110 REST OF SEA AND SOUTH ASIA FRUIT AND VEGETABLE JUICE SYSTEM CURRENT AND FUTURE END USER ANALYSIS, 2025–2034, (USD MILLION)
FIGURE 111 MIDDLE EAST AND AFRICA FRUIT AND VEGETABLE JUICE SYSTEM CURRENT AND FUTURE MARKET VOLUME SHARE REGIONAL ANALYSIS, 2025–2034, (USD MILLION)
FIGURE 112 GCC COUNTRIES FRUIT AND VEGETABLE JUICE SYSTEM CURRENT AND FUTURE TYPE ANALYSIS, 2025–2034, (USD MILLION)
FIGURE 113 GCC COUNTRIES FRUIT AND VEGETABLE JUICE SYSTEM CURRENT AND FUTURE END USER ANALYSIS, 2025–2034, (USD MILLION)
FIGURE 114 SAUDI ARABIA FRUIT AND VEGETABLE JUICE SYSTEM CURRENT AND FUTURE TYPE ANALYSIS, 2025–2034, (USD MILLION)
FIGURE 115 SAUDI ARABIA FRUIT AND VEGETABLE JUICE SYSTEM CURRENT AND FUTURE END USER ANALYSIS, 2025–2034, (USD MILLION)
FIGURE 116 UAE FRUIT AND VEGETABLE JUICE SYSTEM CURRENT AND FUTURE TYPE ANALYSIS, 2025–2034, (USD MILLION)
FIGURE 117 UAE FRUIT AND VEGETABLE JUICE SYSTEM CURRENT AND FUTURE END USER ANALYSIS, 2025–2034, (USD MILLION)
FIGURE 118 BAHRAIN FRUIT AND VEGETABLE JUICE SYSTEM CURRENT AND FUTURE TYPE ANALYSIS, 2025–2034, (USD MILLION)
FIGURE 119 BAHRAIN FRUIT AND VEGETABLE JUICE SYSTEM CURRENT AND FUTURE END USER ANALYSIS, 2025–2034, (USD MILLION)
FIGURE 120 KUWAIT FRUIT AND VEGETABLE JUICE SYSTEM CURRENT AND FUTURE TYPE ANALYSIS, 2025–2034, (USD MILLION)
FIGURE 121 KUWAIT FRUIT AND VEGETABLE JUICE SYSTEM CURRENT AND FUTURE END USER ANALYSIS, 2025–2034, (USD MILLION)
FIGURE 122 OMAN FRUIT AND VEGETABLE JUICE SYSTEM CURRENT AND FUTURE TYPE ANALYSIS, 2025–2034, (USD MILLION)
FIGURE 123 OMAN FRUIT AND VEGETABLE JUICE SYSTEM CURRENT AND FUTURE END USER ANALYSIS, 2025–2034, (USD MILLION)
FIGURE 124 QATAR FRUIT AND VEGETABLE JUICE SYSTEM CURRENT AND FUTURE TYPE ANALYSIS, 2025–2034, (USD MILLION)
FIGURE 125 QATAR FRUIT AND VEGETABLE JUICE SYSTEM CURRENT AND FUTURE END USER ANALYSIS, 2025–2034, (USD MILLION)
FIGURE 126 EGYPT FRUIT AND VEGETABLE JUICE SYSTEM CURRENT AND FUTURE TYPE ANALYSIS, 2025–2034, (USD MILLION)
FIGURE 127 EGYPT FRUIT AND VEGETABLE JUICE SYSTEM CURRENT AND FUTURE END USER ANALYSIS, 2025–2034, (USD MILLION)
FIGURE 128 NIGERIA FRUIT AND VEGETABLE JUICE SYSTEM CURRENT AND FUTURE TYPE ANALYSIS, 2025–2034, (USD MILLION)
FIGURE 129 NIGERIA FRUIT AND VEGETABLE JUICE SYSTEM CURRENT AND FUTURE END USER ANALYSIS, 2025–2034, (USD MILLION)
FIGURE 130 SOUTH AFRICA FRUIT AND VEGETABLE JUICE SYSTEM CURRENT AND FUTURE TYPE ANALYSIS, 2025–2034, (USD MILLION)
FIGURE 131 SOUTH AFRICA FRUIT AND VEGETABLE JUICE SYSTEM CURRENT AND FUTURE END USER ANALYSIS, 2025–2034, (USD MILLION)
FIGURE 132 ISRAEL FRUIT AND VEGETABLE JUICE SYSTEM CURRENT AND FUTURE TYPE ANALYSIS, 2025–2034, (USD MILLION)
FIGURE 133 ISRAEL FRUIT AND VEGETABLE JUICE SYSTEM CURRENT AND FUTURE END USER ANALYSIS, 2025–2034, (USD MILLION)
FIGURE 134 REST OF MEA FRUIT AND VEGETABLE JUICE SYSTEM CURRENT AND FUTURE TYPE ANALYSIS, 2025–2034, (USD MILLION)
FIGURE 135 REST OF MEA FRUIT AND VEGETABLE JUICE SYSTEM CURRENT AND FUTURE END USER ANALYSIS, 2025–2034, (USD MILLION)
FIGURE 136 U. S. MARKET SHARE ANALYSIS BY TYPE (2024)
FIGURE 137 U. S. MARKET SHARE ANALYSIS BY END USER (2024)
FIGURE 138 CANADA MARKET SHARE ANALYSIS BY TYPE (2024)
FIGURE 139 CANADA MARKET SHARE ANALYSIS BY END USER (2024)
FIGURE 140 MEXICO MARKET SHARE ANALYSIS BY TYPE (2024)
FIGURE 141 MEXICO MARKET SHARE ANALYSIS BY END USER (2024)
FIGURE 142 CHINA MARKET SHARE ANALYSIS BY TYPE (2024)
FIGURE 143 CHINA MARKET SHARE ANALYSIS BY END USER (2024)
FIGURE 144 JAPAN MARKET SHARE ANALYSIS BY TYPE (2024)
FIGURE 145 JAPAN MARKET SHARE ANALYSIS BY END USER (2024)
FIGURE 146 INDIA MARKET SHARE ANALYSIS BY TYPE (2024)
FIGURE 147 INDIA MARKET SHARE ANALYSIS BY END USER (2024)
FIGURE 148 SOUTH KOREA MARKET SHARE ANALYSIS BY TYPE (2024)
FIGURE 149 SOUTH KOREA MARKET SHARE ANALYSIS BY END USER (2024)
FIGURE 150 SAUDI ARABIA MARKET SHARE ANALYSIS BY TYPE (2024)
FIGURE 151 SAUDI ARABIA MARKET SHARE ANALYSIS BY END USER (2024)
FIGURE 152 UAE MARKET SHARE ANALYSIS BY TYPE (2024)
FIGURE 153 UAE MARKET SHARE ANALYSIS BY END USER (2024)
FIGURE 154 EGYPT MARKET SHARE ANALYSIS BY TYPE (2024)
FIGURE 155 EGYPT MARKET SHARE ANALYSIS BY END USER (2024)
FIGURE 156 NIGERIA MARKET SHARE ANALYSIS BY TYPE (2024)
FIGURE 157 NIGERIA MARKET SHARE ANALYSIS BY END USER (2024)
FIGURE 158 SOUTH AFRICA MARKET SHARE ANALYSIS BY TYPE (2024)
FIGURE 159 SOUTH AFRICA MARKET SHARE ANALYSIS BY END USER (2024)
FIGURE 160 GERMANY MARKET SHARE ANALYSIS BY TYPE (2024)
FIGURE 161 GERMANY MARKET SHARE ANALYSIS BY END USER (2024)
FIGURE 162 FRANCE MARKET SHARE ANALYSIS BY TYPE (2024)
FIGURE 163 FRANCE MARKET SHARE ANALYSIS BY END USER (2024)
FIGURE 164 UK MARKET SHARE ANALYSIS BY TYPE (2024)
FIGURE 165 UK MARKET SHARE ANALYSIS BY END USER (2024)
FIGURE 166 SPAIN MARKET SHARE ANALYSIS BY TYPE (2024)
FIGURE 167 SPAIN MARKET SHARE ANALYSIS BY END USER (2024)
FIGURE 168 ITALY MARKET SHARE ANALYSIS BY TYPE (2024)
FIGURE 169 ITALY MARKET SHARE ANALYSIS BY END USER (2024)
FIGURE 170 BRAZIL MARKET SHARE ANALYSIS BY TYPE (2024)
FIGURE 171 BRAZIL MARKET SHARE ANALYSIS BY END USER (2024)
FIGURE 172 ARGENTINA MARKET SHARE ANALYSIS BY TYPE (2024)
FIGURE 173 ARGENTINA MARKET SHARE ANALYSIS BY END USER (2024)
FIGURE 174 COLUMBIA MARKET SHARE ANALYSIS BY TYPE (2024)
FIGURE 175 COLUMBIA MARKET SHARE ANALYSIS BY END USER (2024)
FIGURE 176 GLOBAL FRUIT AND VEGETABLE JUICE SYSTEM CURRENT AND FUTURE MARKET KEY COUNTRY LEVEL ANALYSIS, 2024–2034, (USD MILLION)
FIGURE 177 FINANCIAL OVERVIEW:
Key Player Analysis
PepsiCo Inc.: PepsiCo materially reshaped its role in juice by selling a 61% stake in Tropicana, Naked and select juice assets to PAI Partners while retaining a 39% non-controlling interest and exclusive U.S. distribution rights in the new Tropicana Brands Group (TBG). The move redirected capital toward faster-growing zero-sugar beverages while preserving access to premium chilled juice economics and retail shelf space. The structure positions PepsiCo to benefit from category recovery without carrying full agricultural and processing risk, and it leverages PepsiCo’s scaled cold-chain and omnichannel routes to market across U.S. grocery and foodservice. PepsiCo’s strategic influence is felt through execution capabilities—demand planning, merchandising, and cooler availability—rather than direct brand stewardship. For investors, the model supports margin resilience and portfolio optionality as citrus costs and labeling rules evolve; FoodDive noted that prior to the transaction, PepsiCo flagged structurally lower margins in traditional juice, underscoring the rationale for an asset-light stake with distribution synergies.
The Kraft Heinz Company: Kraft Heinz competes primarily via the Capri Sun pouch franchise in the United States through a long-standing licensing partnership with Capri-Sun Group, complemented by powdered beverage brands for value-oriented occasions. The portfolio’s recent focus has been sugar reduction and cleaner labels in core SKUs to align with school guidelines and retailer scorecards, alongside packaging tweaks designed for portion control and convenience. Strategically, Kraft Heinz is leaning into brand renovation and digital shelf execution to defend share against flavored waters and hydration formats. The Capri-Sun masterbrand’s global scale (distributed in 100+ countries by Capri-Sun Group) underpins cross-market learning on recipes and packaging, while the U.S. license allows Kraft Heinz to deploy category management and trade promotion capabilities in mass retail. Execution on reformulation and pack sustainability will be the key differentiators in 2025–2027 as schools and large retailers tighten sugar thresholds.
Keurig Dr Pepper Inc.: KDP’s juice exposure centers on Mott’s (apple juice and sauces) and Snapple (juice drinks), supported by allied brands and a powerful convenience-retail footprint. In 2024, company net sales reached ~$15.4 billion (+3.6% YoY), providing the scale to invest in packaging agility, single-serve formats, and data-led revenue growth management across chilled and ambient aisles. KDP’s partnership model and portfolio architecture—spanning coffee systems to hydration—enable cross-category displays and cooler penetration that benefit on-the-go juice occasions. Its 2025 “State of Beverages” outlook highlights a pipeline around better-for-you propositions and allied-brand platforms, which, combined with disciplined pricing and mix, positions KDP to capture incremental share where apple-based and blended drinks see stable household penetration. (
The Coca-Cola Company: Coca-Cola operates a broad, regionally tuned portfolio—Minute Maid and Simply in North America, Del Valle in Latin America, Innocent in Europe, Cappy in EMEA/Asia—allowing it to balance premium refrigerated growth with scale ambient volumes. Organizationally, the company moved Innocent and Costa Coffee under its Europe operating unit effective January 1, 2025, sharpening regional decision-making for chilled execution and supply. Coca-Cola’s differentiation rests on system capabilities—manufacturing partners, cold-drink equipment, and advanced RGM—paired with sustainability programs that resonate with retailers (e.g., “World Without Waste” packaging goals and expanded water-security actions). These initiatives mitigate regulatory and ESG risks while supporting premiumization in NFC and low/no-added-sugar lines, reinforcing leadership as front-of-pack labeling spreads and consumers pivot to cleaner labels in 2025–2027.
Market Key Players
Welch Foods, Inc.
Citrus World Inc.
The Kraft Heinz Company
Fresh Del Monte Produce
Ocean Spray Cranberries, Inc.
Campbell Soup Company
PepsiCo Inc.
Keurig Dr Pepper Inc.
Nestle S.A.
Reed’s, Inc.
Del Monte Foods
Eckes-Granini Group
Dr. Pepper Snapple Group
The Coca-Cola Company
Driver:
Strong Health-Driven Demand
As of 2025, the fruit and vegetable juice category is tracking toward ~USD 166 billion in global sales, with the long-term outlook anchored by health-and-wellness priorities and premiumization. Consumers are shifting from carbonates to nutrient-dense formats, driving above-market growth in not-from-concentrate (NFC), cold-pressed, and functional blends. Functional SKUs (vitamin-, fiber-, probiotic-, or electrolyte-fortified) are expanding 300–500 bps faster than the total market, supported by repeat purchase rates and 10–20% price premiums. On the route-to-market side, omnichannel access has improved: e-grocery, quick commerce, and DTC subscriptions account for an estimated 10–12% of sales in leading cities and are compounding at >15% annually, widening availability of premium chilled options.
Premiumization Power Market Growth
Technology further amplifies demand. High-pressure processing (HPP) and modern aseptic lines preserve freshness and extend shelf life, enabling clean-label propositions at scale; processing costs have fallen roughly 15–20% since 2020. Upstream, precision agriculture and AI-enabled forecasting improve crop planning and cut waste, tightening service levels for retailers while stabilizing costs for branded and private-label suppliers.
Restraint:
Sugar Scrutiny, Cost Volatility
The most material brake on growth is sugar scrutiny. As of 2025, front-of-pack labeling schemes and sugar taxes across dozens of national and sub-national markets are raising price points and forcing reformulation; in price-sensitive segments, pass-throughs have dampened volumes and pressured mix. Competition from flavored waters, RTD tea, sports/energy drinks, and flavored dairy further fragments share of throat, especially in single-serve, on-the-go occasions.
Competition Limit Expansion
Supply volatility compounds the challenge. Weather-driven yield swings and disease pressures in citrus and apple supply can move raw material costs by 20–30% in adverse seasons, compressing beverage margins by 100–200 bps. Perishability raises logistics and cold-chain requirements, while packaging resin/carton price swings and tightening sustainability standards (recycled content, EPR fees) add cost and complexity to portfolio planning.
Opportunity:
APAC, Low-Sugar Innovation
The clearest upside sits in Asia Pacific, where modernization of retail and rising middle-income consumption position the region to deliver >40% of global category value growth through 2030, at an estimated 8–9% CAGR. Penetration white space in Tier-2/3 cities, combined with rapid e-commerce adoption, favors scalable brands with localized flavors and multi-price ladders. Parallel opportunities exist in vegetable-forward and fruit-veg blends that deliver lower sugar and functional nutrition without flavor sacrifice.
Functional Juices Unlock Major Upside
Premium and purpose-built functionality also present investable runways. Fortified and low/no-added-sugar lines are on track to exceed one-fifth of category revenue by 2030, supported by clinical positioning around immunity, hydration, and gut health. HPP-enabled chilled SKUs, electrolyte-enhanced juices for “active hydration,” and fiber-fortified breakfast blends can sustain mid- to high-single-digit growth, while sustainable packaging (light-weighted cartons, higher-PCR PET) improves retailer acceptance and qualifies products for eco-score incentives.
Trend:
Tech-Enabled Processing, Clean Labels
A decisive technology stack is reshaping the category. HPP, enzymatic clarification, and advanced aseptic are scaling from niche to mainstream, allowing clean-label recipes with extended shelf life and consistent organoleptics. Fermentation-derived sweeteners (e.g., next-gen stevia glycosides) and flavor modulators enable 20–30% sugar reduction without compromising taste, aligning portfolios with regulatory thresholds and retailer scorecards.
Digital Traceability Shape the Future
Digitization is the second vector. QR-enabled traceability and provenance storytelling are moving from pilots to standard practice in premium lines, while AI-driven demand sensing reduces out-of-stocks and markdowns in chilled juice. Together, these shifts favor brands that marry technical credibility with transparent sourcing—tilting market share toward operators capable of integrating R&D, sustainable packaging, and omnichannel execution into a defensible premium position.
Recent Developments
Dec 2024 – The Coca-Cola Company: Updated its voluntary environmental goals across water security, packaging waste reduction, climate, and sustainable agriculture, replacing prior targets to strengthen long-term resilience of its beverages portfolio.
Feb 2025 – Tropicana Brands Group: Reports indicated significant financial stress at the PepsiCo/PAI Partners JV—Debtwire/CNN coverage cited a ~4% quarterly revenue decline and ~10% income drop, with controlling owner PAI Partners providing a USD 30 million emergency loan; multiple outlets said Chapter 11 was under consideration.
Apr 2025 – Keurig Dr Pepper Inc.: Reported Q1 2025 net sales of USD 3.64 billion (+4.8% YoY reported; +6.4% adjusted), reaffirming full-year guidance and noting double-digit growth in U.S. Refreshment Beverages, which includes Mott’s and Snapple juice platforms.
Jul 2025 – innocent Drinks (The Coca-Cola Company, Europe): Announced nine recipients of its 2025 Farmer Innovation Fund, committing ~£1 million to regenerative agriculture projects across key fruit and vegetable supply chains.
Sep 2025 – The Coca-Cola Company: Became a founding member of MIT’s Generative AI Impact Consortium and launched “Save the Orange,” applying AI with partners (Fundecitrus, Invaio) to combat citrus greening (HLB), a disease linked to steep yield declines in Florida and Brazil.