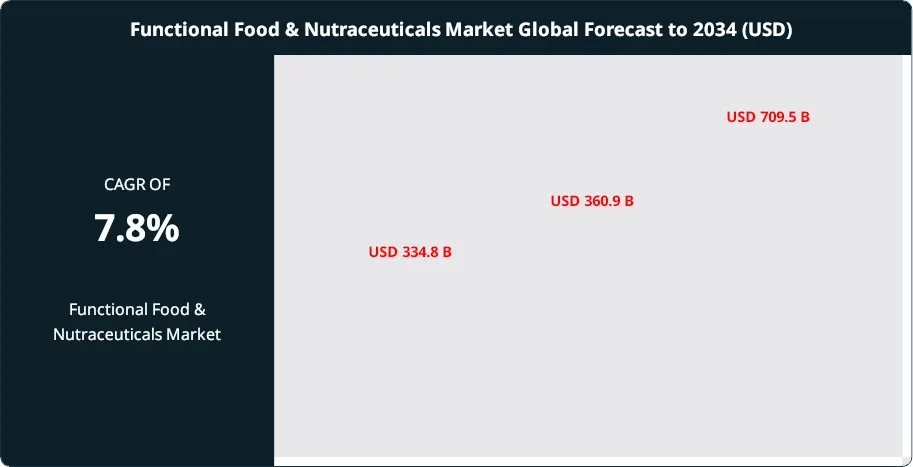
The Functional Food & Nutraceuticals Market was valued at USD 334.8 Billion in 2024 and is estimated to reach approximately USD 360.9 Billion in 2025. Driven by increasing consumer focus on preventive healthcare, rising demand for fortified foods, and growing adoption of dietary supplements, the market is projected to grow from about USD 389.0 Billion in 2026 to nearly USD 709.5 Billion by 2034, registering a compound annual growth rate (CAGR) of around 7.8% during the forecast period from 2026 to 2034.
The sector is consolidating its position within the global health and wellness economy as consumers prioritize prevention and daily performance. Category expansion is supported by higher per-capita intake, premium formulations, and broader retail and digital availability.
Demand is driven by the rising chronic disease burden and the mainstreaming of food-as-health behaviors. Non-communicable diseases account for 74% of global deaths, and diet quality remains a leading contributing factor, which sustains policy attention and consumer spending. In the United States, nearly 40% of adults reported daily dietary supplement use in 2022, underscoring mature-market depth. Aging further strengthens consumption. The population aged 60 and above is projected to rise from 1.0 billion in 2020 to 2.1 billion by 2050, expanding the addressable base for immunity, cardiovascular, cognition, bone, and metabolic health solutions. This aligns with global healthcare spending of USD 9.8 trillion in 2022, where preventive routines increasingly complement clinical care.
On the supply side, companies compete on substantiated efficacy, ingredient purity, and scalable production. Probiotics, omega-3 fatty acids, vitamins, and plant bioactives remain core revenue pools, while fortification and sugar-reduction technologies extend functional positioning into beverages, dairy, and snacks. Digitalization is reshaping commercialization and product design. E-commerce and direct-to-consumer models are reasonably estimated at 20–25% of global sales in 2024 and continue to rise as brands build first-party data. AI and automation support faster ingredient screening, stability modeling, and quality testing, while personalization engines improve conversion and retention through targeted bundles and subscription programs.
Regulation influences both growth and execution risk. The FDA’s authorized health claims, Japan’s FOSHU framework with more than 1,000 approved products, India’s FSSAI approvals exceeding 4,000 products, and sustained EFSA submissions between 2007 and 2023 signal a clear shift toward validated science and compliant innovation. North America likely contributes about 35% of 2024 revenue, while Asia Pacific leads growth, with investment hotspots in China, India, Southeast Asia, and the Gulf. Key risks include tighter claim enforcement, variability in clinical evidence standards, supply-chain volatility for specialty ingredients, and data privacy obligations as personalization expands.
Key Takeaways
Market Growth: The market will expand from 334.8 billion USD, 2024 to 709.5 billion USD, 2034, reflecting a 7.8% CAGR, 2026-2034. This trajectory implies net growth of 374.7 billion USD, 2034.
Segment Dominance: Functional Food leads the product mix with a 47.3% share, 2024. It remains the largest revenue contributor at estimated: 158.4 billion USD, 2024.
Segment Dominance: Supermarkets/Hypermarkets lead distribution with a 44.1% share, 2024. This channel generates an estimated: 147.6 billion USD, 2024 in sales.
Driver: Consumer health management accelerates adoption, supported by a 7.8% CAGR, 2024-2034. Preventive nutrition spending sustains demand at 334.8 billion USD, 2024.
Restraint: Regulatory scrutiny and claim substantiation raise compliance costs to estimated: 1.5% of revenue, 2024. This pressure can delay launches by estimated: 9.0 months, 2024.
Opportunity: Premiumization and personalized nutrition expand wallet share, targeting estimated: 12.0% of category revenue, 2034. This creates incremental upside of estimated: 85.1 billion USD, 2034.
Trend: Brands scale data-driven formulation and digital commerce, lifting online share to estimated: 24.0% of sales, 2024. AI-enabled product development reduces cycle times by estimated: 20.0%, 2024.
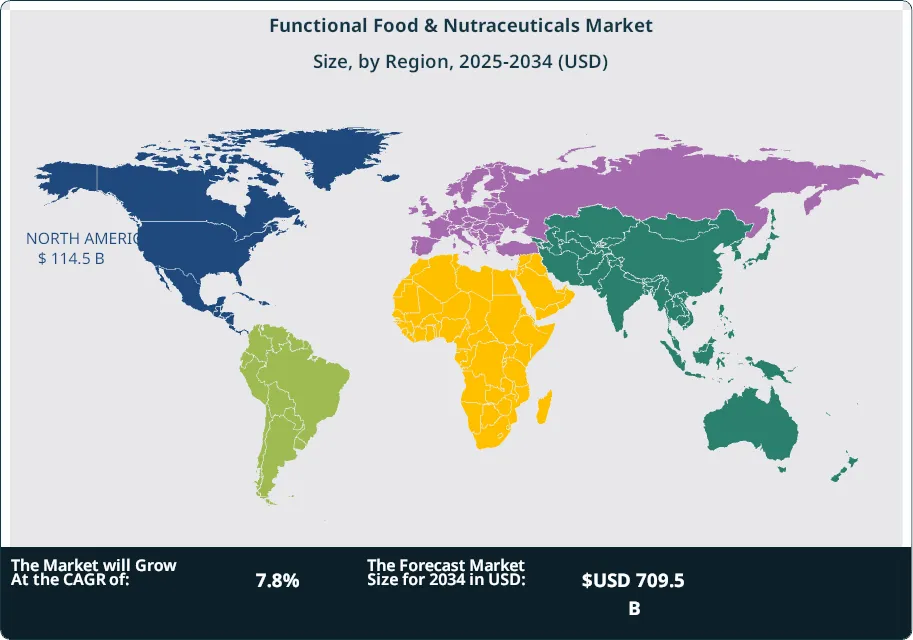
Regional Analysis: North America holds a 34.2% share, 2024, representing 114.5 billion USD, 2024 in market value. The region remains a primary profit pool through 709.5 billion USD, 2034 global scale, 2024-2034.
By Product Type
Functional food remained the largest product category in the global functional food and nutraceuticals market, accounting for 47.3 percent of total revenue in 2024. The segment benefits from sustained consumer focus on diet-based risk reduction and daily nutrition routines. Fortified staples, probiotic dairy products, fiber-enriched snacks, and omega-3-enhanced bakery items continue to gain traction as consumers prefer food formats over capsules and tablets. High penetration among working-age adults and seniors supports repeat consumption, particularly for digestive health, immunity support, and heart health.
From 2025 onward, functional food demand is expected to grow in line with overall market expansion at a mid-to-high single-digit CAGR through 2034. Product development activity centers on protein fortification, sugar reduction, and plant-based formulations. Asia Pacific and North America remain key launch markets due to scale and purchasing power. Manufacturers are also increasing investment in clinical validation to support on-pack claims and maintain regulatory compliance, which strengthens long-term category credibility.
By Distribution Channel
Supermarkets and hypermarkets led distribution in 2024 with a 44.1 percent market share, reflecting their role as the primary purchasing point for daily nutrition products. Consumers favor these outlets for product variety, price visibility, and the ability to compare labels and ingredients in person. Large-format retailers continue to expand shelf space for fortified foods, functional beverages, and dietary supplements, integrating them into mainstream grocery aisles rather than niche sections.
Looking ahead to 2025 and beyond, this channel is expected to maintain leadership as modern retail networks expand across emerging economies. Growth is supported by private-label functional foods, in-store nutrition education programs, and targeted promotions linked to lifestyle conditions such as diabetes and cholesterol management. While online retail is growing faster, supermarkets and hypermarkets retain scale advantages and account for the majority of volume sales in developing and mature markets.
By Region
North America led the global market in 2024 with a 34.2 percent share, equivalent to approximately USD 114.5 billion in revenue. The region benefits from high consumer awareness, strong supplement usage rates, and a mature regulatory environment that supports clearly defined health claims. The United States represents the largest national market, driven by aging demographics and high prevalence of lifestyle-related conditions that influence preventive nutrition spending.
Europe followed closely, supported by demand for fortified foods, functional dairy, and plant-based nutrition. Regulatory oversight from regional authorities continues to shape product formulation and claim approval. Asia Pacific represents the fastest-growing region entering 2025, led by China, India, and Japan. Rising disposable incomes, urbanization, and government-backed nutrition programs are accelerating adoption. Latin America and the Middle East and Africa show gradual uptake, supported by expanding retail access and growing interest in immunity and chronic disease management. This regional growth is further bolstered by a rising middle class that prioritizes value-added nutrition, such as fortified cereals and energy-boosting beverages, as part of a post-pandemic shift toward proactive health maintenance.
By Product Type (Functional Food, Functional Beverages, Dietary Supplements), By Distribution Channel (Specialty Stores, Supermarkets/Hypermarkets, Drug Stores/Pharmacies, Online Retail Stores, Other Distribution Channels)
Research Methodology
Primary Research- 100 Interviews of Stakeholders
Secondary Research
Desk Research
Regional scope
North America (United States, Canada, Mexico)
Latin America (Brazil, Argentina, Columbia)
East Asia And Pacific (China, Japan, South Korea, Australia, Cambodia, Fiji, Indonesia)
Sea And South Asia (India, Singapore, Thailand, Taiwan, Malaysia)
Eastern Europe (Poland, Russia, Czech Republic, Romania)
Western Europe (Germany, U.K., France, Spain, Itlay)
Middle East & Africa (GCC Countries, Egypt, Nigeria, South Africa, Israel)
Competitive Landscape
Bayer AG, Nu Skin Enterprises, Inc., Kellogg Company, Nature’s Sunshine Products, Inc., PepsiCo, Inc., Alticor Inc. (Amway Corporation), Abbott Laboratories, NOW Health Group, Inc. (NOW Foods), Red Bull GmbH, Danone S.A., The Hain Celestial Group, Inc., Herbalife International of America, Inc., Nestlé S.A.
Customization Scope
Customization for segments, region/country-level will be provided. Moreover, additional customization can be done based on the requirements.
Pricing and Purchase Options
Avail customized purchase options to meet your exact research needs. We have three licenses to opt for: Single User License, Multi-User License (Up to 5 Users), Corporate Use License (Unlimited User and Printable PDF).
TABLE OF CONTENTS
1. EXECUTIVE SUMMARY
1.1. MARKET SNAPSHOT
1.2. KEY FINDINGS & INSIGHTS
1.3. ANALYST RECOMMENDATIONS
1.4. FUTURE OUTLOOK
2. RESEARCH METHODOLOGY
2.1. MARKET DEFINITION & SCOPE
2.2. RESEARCH OBJECTIVES: PRIMARY & SECONDARY DATA SOURCES
2.3. DATA COLLECTION SOURCES
2.3.1. COVERAGE OF 100+ PRIMARY RESEARCH/CONSULTATION CALLS WITH INDUSTRY STAKEHOLDERS
FIGURE 17 NORTH AMERICA FUNCTIONAL FOOD AND NUTRACEUTICALS CURRENT AND FUTURE TYPE ANALYSIS, 2025–2034, (USD MILLION)
FIGURE 18 NORTH AMERICA FUNCTIONAL FOOD AND NUTRACEUTICALS CURRENT AND FUTURE END USER ANALYSIS, 2025–2034, (USD MILLION)
FIGURE 19 MARKET SHARE BY COUNTRY
FIGURE 20 LATIN AMERICA FUNCTIONAL FOOD AND NUTRACEUTICALS CURRENT AND FUTURE TYPE ANALYSIS, 2025–2034, (USD MILLION)
FIGURE 21 LATIN AMERICA FUNCTIONAL FOOD AND NUTRACEUTICALS CURRENT AND FUTURE END USER ANALYSIS, 2025–2034, (USD MILLION)
FIGURE 22 MARKET SHARE BY COUNTRY
FIGURE 23 EASTERN EUROPE FUNCTIONAL FOOD AND NUTRACEUTICALS CURRENT AND FUTURE TYPE ANALYSIS, 2025–2034, (USD MILLION)
FIGURE 24 EASTERN EUROPE FUNCTIONAL FOOD AND NUTRACEUTICALS CURRENT AND FUTURE END USER ANALYSIS, 2025–2034, (USD MILLION)
FIGURE 25 MARKET SHARE BY COUNTRY
FIGURE 26 WESTERN EUROPE FUNCTIONAL FOOD AND NUTRACEUTICALS CURRENT AND FUTURE TYPE ANALYSIS, 2025–2034, (USD MILLION)
FIGURE 27 WESTERN EUROPE FUNCTIONAL FOOD AND NUTRACEUTICALS CURRENT AND FUTURE END USER ANALYSIS, 2025–2034, (USD MILLION)
FIGURE 28 MARKET SHARE BY COUNTRY
FIGURE 29 EAST ASIA AND PACIFIC FUNCTIONAL FOOD AND NUTRACEUTICALS CURRENT AND FUTURE TYPE ANALYSIS, 2025–2034, (USD MILLION)
FIGURE 30 EAST ASIA AND PACIFIC FUNCTIONAL FOOD AND NUTRACEUTICALS CURRENT AND FUTURE END USER ANALYSIS, 2025–2034, (USD MILLION)
FIGURE 31 MARKET SHARE BY COUNTRY
FIGURE 32 SEA AND SOUTH ASIA FUNCTIONAL FOOD AND NUTRACEUTICALS CURRENT AND FUTURE TYPE ANALYSIS, 2025–2034, (USD MILLION)
FIGURE 33 SEA AND SOUTH ASIA FUNCTIONAL FOOD AND NUTRACEUTICALS CURRENT AND FUTURE END USER ANALYSIS, 2025–2034, (USD MILLION)
FIGURE 34 MARKET SHARE BY COUNTRY
FIGURE 35 MIDDLE EAST AND AFRICA FUNCTIONAL FOOD AND NUTRACEUTICALS CURRENT AND FUTURE TYPE ANALYSIS, 2025–2034, (USD MILLION)
FIGURE 36 MIDDLE EAST AND AFRICA FUNCTIONAL FOOD AND NUTRACEUTICALS CURRENT AND FUTURE END USER ANALYSIS, 2025–2034, (USD MILLION)
FIGURE 37 NORTH AMERICA FUNCTIONAL FOOD AND NUTRACEUTICALS CURRENT AND FUTURE MARKET VOLUME SHARE REGIONAL ANALYSIS, 2025–2034, (USD MILLION)
FIGURE 38 U.S. FUNCTIONAL FOOD AND NUTRACEUTICALS CURRENT AND FUTURE TYPE ANALYSIS, 2025–2034, (USD MILLION)
FIGURE 39 U.S. FUNCTIONAL FOOD AND NUTRACEUTICALS CURRENT AND FUTURE END USER ANALYSIS, 2025–2034, (USD MILLION)
FIGURE 40 CANADA FUNCTIONAL FOOD AND NUTRACEUTICALS CURRENT AND FUTURE TYPE ANALYSIS, 2025–2034, (USD MILLION)
FIGURE 41 CANADA FUNCTIONAL FOOD AND NUTRACEUTICALS CURRENT AND FUTURE END USER ANALYSIS, 2025–2034, (USD MILLION)
FIGURE 42 LATIN AMERICA FUNCTIONAL FOOD AND NUTRACEUTICALS CURRENT AND FUTURE MARKET VOLUME SHARE REGIONAL ANALYSIS, 2025–2034, (USD MILLION)
FIGURE 43 MEXICO FUNCTIONAL FOOD AND NUTRACEUTICALS CURRENT AND FUTURE TYPE ANALYSIS, 2025–2034, (USD MILLION)
FIGURE 44 MEXICO FUNCTIONAL FOOD AND NUTRACEUTICALS CURRENT AND FUTURE END USER ANALYSIS, 2025–2034, (USD MILLION)
FIGURE 45 BRAZIL FUNCTIONAL FOOD AND NUTRACEUTICALS CURRENT AND FUTURE TYPE ANALYSIS, 2025–2034, (USD MILLION)
FIGURE 46 BRAZIL FUNCTIONAL FOOD AND NUTRACEUTICALS CURRENT AND FUTURE END USER ANALYSIS, 2025–2034, (USD MILLION)
FIGURE 47 ARGENTINA FUNCTIONAL FOOD AND NUTRACEUTICALS CURRENT AND FUTURE TYPE ANALYSIS, 2025–2034, (USD MILLION)
FIGURE 48 ARGENTINA FUNCTIONAL FOOD AND NUTRACEUTICALS CURRENT AND FUTURE END USER ANALYSIS, 2025–2034, (USD MILLION)
FIGURE 49 COLUMBIA FUNCTIONAL FOOD AND NUTRACEUTICALS CURRENT AND FUTURE TYPE ANALYSIS, 2025–2034, (USD MILLION)
FIGURE 50 COLUMBIA FUNCTIONAL FOOD AND NUTRACEUTICALS CURRENT AND FUTURE END USER ANALYSIS, 2025–2034, (USD MILLION)
FIGURE 51 REST OF LATIN AMERICA FUNCTIONAL FOOD AND NUTRACEUTICALS CURRENT AND FUTURE TYPE ANALYSIS, 2025–2034, (USD MILLION)
FIGURE 52 REST OF LATIN AMERICA FUNCTIONAL FOOD AND NUTRACEUTICALS CURRENT AND FUTURE END USER ANALYSIS, 2025–2034, (USD MILLION)
FIGURE 53 EASTERN EUROPE FUNCTIONAL FOOD AND NUTRACEUTICALS CURRENT AND FUTURE MARKET VOLUME SHARE REGIONAL ANALYSIS, 2025–2034, (USD MILLION)
FIGURE 54 POLAND FUNCTIONAL FOOD AND NUTRACEUTICALS CURRENT AND FUTURE TYPE ANALYSIS, 2025–2034, (USD MILLION)
FIGURE 55 POLAND FUNCTIONAL FOOD AND NUTRACEUTICALS CURRENT AND FUTURE END USER ANALYSIS, 2025–2034, (USD MILLION)
FIGURE 56 RUSSIA FUNCTIONAL FOOD AND NUTRACEUTICALS CURRENT AND FUTURE TYPE ANALYSIS, 2025–2034, (USD MILLION)
FIGURE 57 RUSSIA FUNCTIONAL FOOD AND NUTRACEUTICALS CURRENT AND FUTURE END USER ANALYSIS, 2025–2034, (USD MILLION)
FIGURE 58 CZECH REPUBLIC FUNCTIONAL FOOD AND NUTRACEUTICALS CURRENT AND FUTURE TYPE ANALYSIS, 2025–2034, (USD MILLION)
FIGURE 59 CZECH REPUBLIC FUNCTIONAL FOOD AND NUTRACEUTICALS CURRENT AND FUTURE END USER ANALYSIS, 2025–2034, (USD MILLION)
FIGURE 60 ROMANIA FUNCTIONAL FOOD AND NUTRACEUTICALS CURRENT AND FUTURE TYPE ANALYSIS, 2025–2034, (USD MILLION)
FIGURE 61 ROMANIA FUNCTIONAL FOOD AND NUTRACEUTICALS CURRENT AND FUTURE END USER ANALYSIS, 2025–2034, (USD MILLION)
FIGURE 62 REST OF EASTERN EUROPE FUNCTIONAL FOOD AND NUTRACEUTICALS CURRENT AND FUTURE TYPE ANALYSIS, 2025–2034, (USD MILLION)
FIGURE 63 REST OF EASTERN EUROPE FUNCTIONAL FOOD AND NUTRACEUTICALS CURRENT AND FUTURE END USER ANALYSIS, 2025–2034, (USD MILLION)
FIGURE 64 WESTERN EUROPE FUNCTIONAL FOOD AND NUTRACEUTICALS CURRENT AND FUTURE MARKET VOLUME SHARE REGIONAL ANALYSIS, 2025–2034, (USD MILLION)
FIGURE 65 GERMANY FUNCTIONAL FOOD AND NUTRACEUTICALS CURRENT AND FUTURE TYPE ANALYSIS, 2025–2034, (USD MILLION)
FIGURE 66 GERMANY FUNCTIONAL FOOD AND NUTRACEUTICALS CURRENT AND FUTURE END USER ANALYSIS, 2025–2034, (USD MILLION)
FIGURE 67 FRANCE FUNCTIONAL FOOD AND NUTRACEUTICALS CURRENT AND FUTURE TYPE ANALYSIS, 2025–2034, (USD MILLION)
FIGURE 68 FRANCE FUNCTIONAL FOOD AND NUTRACEUTICALS CURRENT AND FUTURE END USER ANALYSIS, 2025–2034, (USD MILLION)
FIGURE 69 UK FUNCTIONAL FOOD AND NUTRACEUTICALS CURRENT AND FUTURE TYPE ANALYSIS, 2025–2034, (USD MILLION)
FIGURE 70 UK FUNCTIONAL FOOD AND NUTRACEUTICALS CURRENT AND FUTURE END USER ANALYSIS, 2025–2034, (USD MILLION)
FIGURE 71 SPAIN FUNCTIONAL FOOD AND NUTRACEUTICALS CURRENT AND FUTURE TYPE ANALYSIS, 2025–2034, (USD MILLION)
FIGURE 72 SPAIN FUNCTIONAL FOOD AND NUTRACEUTICALS CURRENT AND FUTURE END USER ANALYSIS, 2025–2034, (USD MILLION)
FIGURE 73 ITALY FUNCTIONAL FOOD AND NUTRACEUTICALS CURRENT AND FUTURE TYPE ANALYSIS, 2025–2034, (USD MILLION)
FIGURE 74 ITALY FUNCTIONAL FOOD AND NUTRACEUTICALS CURRENT AND FUTURE END USER ANALYSIS, 2025–2034, (USD MILLION)
FIGURE 75 REST OF WESTERN EUROPE FUNCTIONAL FOOD AND NUTRACEUTICALS CURRENT AND FUTURE TYPE ANALYSIS, 2025–2034, (USD MILLION)
FIGURE 76 REST OF WESTERN EUROPE FUNCTIONAL FOOD AND NUTRACEUTICALS CURRENT AND FUTURE END USER ANALYSIS, 2025–2034, (USD MILLION)
FIGURE 77 EAST ASIA AND PACIFIC FUNCTIONAL FOOD AND NUTRACEUTICALS CURRENT AND FUTURE MARKET VOLUME SHARE REGIONAL ANALYSIS, 2025–2034, (USD MILLION)
FIGURE 78 CHINA FUNCTIONAL FOOD AND NUTRACEUTICALS CURRENT AND FUTURE TYPE ANALYSIS, 2025–2034, (USD MILLION)
FIGURE 79 CHINA FUNCTIONAL FOOD AND NUTRACEUTICALS CURRENT AND FUTURE END USER ANALYSIS, 2025–2034, (USD MILLION)
FIGURE 80 JAPAN FUNCTIONAL FOOD AND NUTRACEUTICALS CURRENT AND FUTURE TYPE ANALYSIS, 2025–2034, (USD MILLION)
FIGURE 81 JAPAN FUNCTIONAL FOOD AND NUTRACEUTICALS CURRENT AND FUTURE END USER ANALYSIS, 2025–2034, (USD MILLION)
FIGURE 82 AUSTRALIA FUNCTIONAL FOOD AND NUTRACEUTICALS CURRENT AND FUTURE TYPE ANALYSIS, 2025–2034, (USD MILLION)
FIGURE 83 AUSTRALIA FUNCTIONAL FOOD AND NUTRACEUTICALS CURRENT AND FUTURE END USER ANALYSIS, 2025–2034, (USD MILLION)
FIGURE 84 CAMBODIA FUNCTIONAL FOOD AND NUTRACEUTICALS CURRENT AND FUTURE TYPE ANALYSIS, 2025–2034, (USD MILLION)
FIGURE 85 CAMBODIA FUNCTIONAL FOOD AND NUTRACEUTICALS CURRENT AND FUTURE END USER ANALYSIS, 2025–2034, (USD MILLION)
FIGURE 86 FIJI FUNCTIONAL FOOD AND NUTRACEUTICALS CURRENT AND FUTURE TYPE ANALYSIS, 2025–2034, (USD MILLION)
FIGURE 87 FIJI FUNCTIONAL FOOD AND NUTRACEUTICALS CURRENT AND FUTURE END USER ANALYSIS, 2025–2034, (USD MILLION)
FIGURE 88 INDONESIA FUNCTIONAL FOOD AND NUTRACEUTICALS CURRENT AND FUTURE TYPE ANALYSIS, 2025–2034, (USD MILLION)
FIGURE 89 INDONESIA FUNCTIONAL FOOD AND NUTRACEUTICALS CURRENT AND FUTURE END USER ANALYSIS, 2025–2034, (USD MILLION)
FIGURE 90 SOUTH KOREA FUNCTIONAL FOOD AND NUTRACEUTICALS CURRENT AND FUTURE TYPE ANALYSIS, 2025–2034, (USD MILLION)
FIGURE 91 SOUTH KOREA FUNCTIONAL FOOD AND NUTRACEUTICALS CURRENT AND FUTURE END USER ANALYSIS, 2025–2034, (USD MILLION)
FIGURE 92 REST OF EAST ASIA AND PACIFIC FUNCTIONAL FOOD AND NUTRACEUTICALS CURRENT AND FUTURE TYPE ANALYSIS, 2025–2034, (USD MILLION)
FIGURE 93 REST OF EAST ASIA AND PACIFIC FUNCTIONAL FOOD AND NUTRACEUTICALS CURRENT AND FUTURE END USER ANALYSIS, 2025–2034, (USD MILLION)
FIGURE 94 SEA AND SOUTH ASIA FUNCTIONAL FOOD AND NUTRACEUTICALS CURRENT AND FUTURE MARKET VOLUME SHARE REGIONAL ANALYSIS, 2025–2034, (USD MILLION)
FIGURE 95 BANGLADESH FUNCTIONAL FOOD AND NUTRACEUTICALS CURRENT AND FUTURE TYPE ANALYSIS, 2025–2034, (USD MILLION)
FIGURE 96 BANGLADESH FUNCTIONAL FOOD AND NUTRACEUTICALS CURRENT AND FUTURE END USER ANALYSIS, 2025–2034, (USD MILLION)
FIGURE 97 NEW ZEALAND FUNCTIONAL FOOD AND NUTRACEUTICALS CURRENT AND FUTURE TYPE ANALYSIS, 2025–2034, (USD MILLION)
FIGURE 98 NEW ZEALAND FUNCTIONAL FOOD AND NUTRACEUTICALS CURRENT AND FUTURE END USER ANALYSIS, 2025–2034, (USD MILLION)
FIGURE 99 INDIA FUNCTIONAL FOOD AND NUTRACEUTICALS CURRENT AND FUTURE TYPE ANALYSIS, 2025–2034, (USD MILLION)
FIGURE 100 INDIA FUNCTIONAL FOOD AND NUTRACEUTICALS CURRENT AND FUTURE END USER ANALYSIS, 2025–2034, (USD MILLION)
FIGURE 101 SINGAPORE FUNCTIONAL FOOD AND NUTRACEUTICALS CURRENT AND FUTURE TYPE ANALYSIS, 2025–2034, (USD MILLION)
FIGURE 102 SINGAPORE FUNCTIONAL FOOD AND NUTRACEUTICALS CURRENT AND FUTURE END USER ANALYSIS, 2025–2034, (USD MILLION)
FIGURE 103 THAILAND FUNCTIONAL FOOD AND NUTRACEUTICALS CURRENT AND FUTURE TYPE ANALYSIS, 2025–2034, (USD MILLION)
FIGURE 104 THAILAND FUNCTIONAL FOOD AND NUTRACEUTICALS CURRENT AND FUTURE END USER ANALYSIS, 2025–2034, (USD MILLION)
FIGURE 105 TAIWAN FUNCTIONAL FOOD AND NUTRACEUTICALS CURRENT AND FUTURE TYPE ANALYSIS, 2025–2034, (USD MILLION)
FIGURE 106 TAIWAN FUNCTIONAL FOOD AND NUTRACEUTICALS CURRENT AND FUTURE END USER ANALYSIS, 2025–2034, (USD MILLION)
FIGURE 107 MALAYSIA FUNCTIONAL FOOD AND NUTRACEUTICALS CURRENT AND FUTURE TYPE ANALYSIS, 2025–2034, (USD MILLION)
FIGURE 108 MALAYSIA FUNCTIONAL FOOD AND NUTRACEUTICALS CURRENT AND FUTURE END USER ANALYSIS, 2025–2034, (USD MILLION)
FIGURE 109 REST OF SEA AND SOUTH ASIA FUNCTIONAL FOOD AND NUTRACEUTICALS CURRENT AND FUTURE TYPE ANALYSIS, 2025–2034, (USD MILLION)
FIGURE 110 REST OF SEA AND SOUTH ASIA FUNCTIONAL FOOD AND NUTRACEUTICALS CURRENT AND FUTURE END USER ANALYSIS, 2025–2034, (USD MILLION)
FIGURE 111 MIDDLE EAST AND AFRICA FUNCTIONAL FOOD AND NUTRACEUTICALS CURRENT AND FUTURE MARKET VOLUME SHARE REGIONAL ANALYSIS, 2025–2034, (USD MILLION)
FIGURE 112 GCC COUNTRIES FUNCTIONAL FOOD AND NUTRACEUTICALS CURRENT AND FUTURE TYPE ANALYSIS, 2025–2034, (USD MILLION)
FIGURE 113 GCC COUNTRIES FUNCTIONAL FOOD AND NUTRACEUTICALS CURRENT AND FUTURE END USER ANALYSIS, 2025–2034, (USD MILLION)
FIGURE 114 SAUDI ARABIA FUNCTIONAL FOOD AND NUTRACEUTICALS CURRENT AND FUTURE TYPE ANALYSIS, 2025–2034, (USD MILLION)
FIGURE 115 SAUDI ARABIA FUNCTIONAL FOOD AND NUTRACEUTICALS CURRENT AND FUTURE END USER ANALYSIS, 2025–2034, (USD MILLION)
FIGURE 116 UAE FUNCTIONAL FOOD AND NUTRACEUTICALS CURRENT AND FUTURE TYPE ANALYSIS, 2025–2034, (USD MILLION)
FIGURE 117 UAE FUNCTIONAL FOOD AND NUTRACEUTICALS CURRENT AND FUTURE END USER ANALYSIS, 2025–2034, (USD MILLION)
FIGURE 118 BAHRAIN FUNCTIONAL FOOD AND NUTRACEUTICALS CURRENT AND FUTURE TYPE ANALYSIS, 2025–2034, (USD MILLION)
FIGURE 119 BAHRAIN FUNCTIONAL FOOD AND NUTRACEUTICALS CURRENT AND FUTURE END USER ANALYSIS, 2025–2034, (USD MILLION)
FIGURE 120 KUWAIT FUNCTIONAL FOOD AND NUTRACEUTICALS CURRENT AND FUTURE TYPE ANALYSIS, 2025–2034, (USD MILLION)
FIGURE 121 KUWAIT FUNCTIONAL FOOD AND NUTRACEUTICALS CURRENT AND FUTURE END USER ANALYSIS, 2025–2034, (USD MILLION)
FIGURE 122 OMAN FUNCTIONAL FOOD AND NUTRACEUTICALS CURRENT AND FUTURE TYPE ANALYSIS, 2025–2034, (USD MILLION)
FIGURE 123 OMAN FUNCTIONAL FOOD AND NUTRACEUTICALS CURRENT AND FUTURE END USER ANALYSIS, 2025–2034, (USD MILLION)
FIGURE 124 QATAR FUNCTIONAL FOOD AND NUTRACEUTICALS CURRENT AND FUTURE TYPE ANALYSIS, 2025–2034, (USD MILLION)
FIGURE 125 QATAR FUNCTIONAL FOOD AND NUTRACEUTICALS CURRENT AND FUTURE END USER ANALYSIS, 2025–2034, (USD MILLION)
FIGURE 126 EGYPT FUNCTIONAL FOOD AND NUTRACEUTICALS CURRENT AND FUTURE TYPE ANALYSIS, 2025–2034, (USD MILLION)
FIGURE 127 EGYPT FUNCTIONAL FOOD AND NUTRACEUTICALS CURRENT AND FUTURE END USER ANALYSIS, 2025–2034, (USD MILLION)
FIGURE 128 NIGERIA FUNCTIONAL FOOD AND NUTRACEUTICALS CURRENT AND FUTURE TYPE ANALYSIS, 2025–2034, (USD MILLION)
FIGURE 129 NIGERIA FUNCTIONAL FOOD AND NUTRACEUTICALS CURRENT AND FUTURE END USER ANALYSIS, 2025–2034, (USD MILLION)
FIGURE 130 SOUTH AFRICA FUNCTIONAL FOOD AND NUTRACEUTICALS CURRENT AND FUTURE TYPE ANALYSIS, 2025–2034, (USD MILLION)
FIGURE 131 SOUTH AFRICA FUNCTIONAL FOOD AND NUTRACEUTICALS CURRENT AND FUTURE END USER ANALYSIS, 2025–2034, (USD MILLION)
FIGURE 132 ISRAEL FUNCTIONAL FOOD AND NUTRACEUTICALS CURRENT AND FUTURE TYPE ANALYSIS, 2025–2034, (USD MILLION)
FIGURE 133 ISRAEL FUNCTIONAL FOOD AND NUTRACEUTICALS CURRENT AND FUTURE END USER ANALYSIS, 2025–2034, (USD MILLION)
FIGURE 134 REST OF MEA FUNCTIONAL FOOD AND NUTRACEUTICALS CURRENT AND FUTURE TYPE ANALYSIS, 2025–2034, (USD MILLION)
FIGURE 135 REST OF MEA FUNCTIONAL FOOD AND NUTRACEUTICALS CURRENT AND FUTURE END USER ANALYSIS, 2025–2034, (USD MILLION)
FIGURE 136 U. S. MARKET SHARE ANALYSIS BY TYPE (2025)
FIGURE 137 U. S. MARKET SHARE ANALYSIS BY END USER (2025)
FIGURE 138 CANADA MARKET SHARE ANALYSIS BY TYPE (2025)
FIGURE 139 CANADA MARKET SHARE ANALYSIS BY END USER (2025)
FIGURE 140 MEXICO MARKET SHARE ANALYSIS BY TYPE (2025)
FIGURE 141 MEXICO MARKET SHARE ANALYSIS BY END USER (2025)
FIGURE 142 CHINA MARKET SHARE ANALYSIS BY TYPE (2025)
FIGURE 143 CHINA MARKET SHARE ANALYSIS BY END USER (2025)
FIGURE 144 JAPAN MARKET SHARE ANALYSIS BY TYPE (2025)
FIGURE 145 JAPAN MARKET SHARE ANALYSIS BY END USER (2025)
FIGURE 146 INDIA MARKET SHARE ANALYSIS BY TYPE (2025)
FIGURE 147 INDIA MARKET SHARE ANALYSIS BY END USER (2025)
FIGURE 148 SOUTH KOREA MARKET SHARE ANALYSIS BY TYPE (2025)
FIGURE 149 SOUTH KOREA MARKET SHARE ANALYSIS BY END USER (2025)
FIGURE 150 SAUDI ARABIA MARKET SHARE ANALYSIS BY TYPE (2025)
FIGURE 151 SAUDI ARABIA MARKET SHARE ANALYSIS BY END USER (2025)
FIGURE 152 UAE MARKET SHARE ANALYSIS BY TYPE (2025)
FIGURE 153 UAE MARKET SHARE ANALYSIS BY END USER (2025)
FIGURE 154 EGYPT MARKET SHARE ANALYSIS BY TYPE (2025)
FIGURE 155 EGYPT MARKET SHARE ANALYSIS BY END USER (2025)
FIGURE 156 NIGERIA MARKET SHARE ANALYSIS BY TYPE (2025)
FIGURE 157 NIGERIA MARKET SHARE ANALYSIS BY END USER (2025)
FIGURE 158 SOUTH AFRICA MARKET SHARE ANALYSIS BY TYPE (2025)
FIGURE 159 SOUTH AFRICA MARKET SHARE ANALYSIS BY END USER (2025)
FIGURE 160 GERMANY MARKET SHARE ANALYSIS BY TYPE (2025)
FIGURE 161 GERMANY MARKET SHARE ANALYSIS BY END USER (2025)
FIGURE 162 FRANCE MARKET SHARE ANALYSIS BY TYPE (2025)
FIGURE 163 FRANCE MARKET SHARE ANALYSIS BY END USER (2025)
FIGURE 164 UK MARKET SHARE ANALYSIS BY TYPE (2025)
FIGURE 165 UK MARKET SHARE ANALYSIS BY END USER (2025)
FIGURE 166 SPAIN MARKET SHARE ANALYSIS BY TYPE (2025)
FIGURE 167 SPAIN MARKET SHARE ANALYSIS BY END USER (2025)
FIGURE 168 ITALY MARKET SHARE ANALYSIS BY TYPE (2025)
FIGURE 169 ITALY MARKET SHARE ANALYSIS BY END USER (2025)
FIGURE 170 BRAZIL MARKET SHARE ANALYSIS BY TYPE (2025)
FIGURE 171 BRAZIL MARKET SHARE ANALYSIS BY END USER (2025)
FIGURE 172 ARGENTINA MARKET SHARE ANALYSIS BY TYPE (2025)
FIGURE 173 ARGENTINA MARKET SHARE ANALYSIS BY END USER (2025)
FIGURE 174 COLUMBIA MARKET SHARE ANALYSIS BY TYPE (2025)
FIGURE 175 COLUMBIA MARKET SHARE ANALYSIS BY END USER (2025)
FIGURE 176 GLOBAL FUNCTIONAL FOOD AND NUTRACEUTICALS CURRENT AND FUTURE MARKET KEY COUNTRY LEVEL ANALYSIS, 2025–2034, (USD MILLION)
FIGURE 177 FINANCIAL OVERVIEW:
Key Player Analysis
Amway Corporation: Amway operates as a global market leader in dietary supplements and functional nutrition, supported by its Nutrilite brand portfolio. The company maintains strong penetration in North America, Asia Pacific, and Latin America through a direct-selling model that reached an estimated 10 million active distributors globally in 2024. Nutrition and wellness products account for more than 55 percent of Amway’s total revenue, with supplements positioned around immunity, digestive health, and energy support. This focus aligns with rising consumer preference for preventive nutrition as of 2025.
Strategically, Amway continues to increase investment in ingredient traceability, plant-based sourcing, and clinical validation. The company expanded organic farming capacity in the United States and India to secure supply consistency and cost control. Digital platforms now support distributor engagement and consumer education, improving conversion rates in mature and emerging markets. Amway differentiates through vertical integration, long-term supplier relationships, and strong brand trust among repeat users.
Danone S.A.: Danone holds a challenger position with strong influence in functional foods, particularly probiotics, fortified dairy, and plant-based nutrition. Its health-focused portfolio, led by brands such as Activia and Actimel, generates a significant share of group revenue. In 2024, health-oriented products represented an estimated 45 percent of Danone’s total food and beverage sales. Europe and North America remain core markets, while Asia Pacific delivers faster volume growth entering 2025.
The company prioritizes science-backed formulation and regulatory compliance to support health claims across regions. Danone continues to expand plant-based and low-sugar lines to address digestive and metabolic health demand. Investments in microbiome research and fermentation technology support product differentiation. Danone’s strength lies in scale manufacturing, clinical research depth, and strong relationships with large retail chains.
NOW Health Group, Inc. (NOW Foods): NOW Foods operates as a well-established niche player focused on dietary supplements and natural nutrition products. The company serves value-conscious consumers seeking clean-label supplements across vitamins, minerals, probiotics, and specialty extracts. North America represents its primary revenue base, with expanding presence in Europe and selected Asia Pacific markets. As of 2024, supplements accounted for an estimated 80 percent of NOW Foods’ total sales.
NOW Foods emphasizes in-house manufacturing, third-party testing, and transparent labeling to maintain quality consistency. The company continues to broaden its functional food offerings, including protein powders and fortified snacks, to capture cross-category demand. Digital sales channels and specialty retail partnerships support steady growth. Competitive differentiation comes from pricing discipline, manufacturing control, and strong credibility among health-focused consumers.
Market Key Players
Bayer AG
Nu Skin Enterprises, Inc.
Kellogg Company
Nature’s Sunshine Products, Inc.
PepsiCo, Inc.
Alticor Inc. (Amway Corporation)
Abbott Laboratories
NOW Health Group, Inc. (NOW Foods)
Red Bull GmbH
Danone S.A.
The Hain Celestial Group, Inc.
Herbalife International of America, Inc.
Nestlé S.A.
Other Key Players
Archer Daniels Midland Company
Glanbia plc
Yakult Honsha Co., Ltd.
GSK Consumer Healthcare
Otsuka Holdings Co., Ltd.
Driver:
Rising Health Awareness Driving Functional Food Demand
As of 2025, you operate in a market shaped by higher health awareness and sustained public-sector backing for preventive nutrition. Governments and health agencies continue to push diet-based risk reduction as healthcare costs rise. In the United States, federal nutrition guidance influences everyday food choices for a population where more than 40 percent of adults report regular dietary supplement use. Similar policy signals appear across Europe and Asia Pacific, where national programs promote micronutrient intake to reduce long-term disease burden. These signals reinforce consumer trust and normalize functional foods as part of daily diets.
This environment directly supports market expansion at a projected CAGR of about 7.8 percent through 2034. You see stronger demand for products positioned around immunity, heart health, and metabolic support. Chronic conditions such as diabetes and cardiovascular disease remain key demand anchors. Functional foods with fibers, omega-3 fatty acids, and fortified vitamins align with this shift. The result is higher volume growth and faster adoption across mass retail and digital channels.
Restraint:
Premium Pricing Limiting Mass Market Penetration
Despite rising demand, pricing remains a structural constraint you must manage carefully. Functional foods and nutraceuticals carry a premium of 20 to 40 percent over conventional alternatives in many markets as of 2025. Costs stem from specialized ingredients, clinical validation, and compliance requirements. Regulatory approval for health claims in regions such as the European Union adds time and expense, often extending product development cycles by 12 to 18 months.
Regulatory and Ingredient Costs Increasing Development Barriers
This cost structure limits penetration in price-sensitive regions and among lower-income consumers. You face slower volume growth outside urban centers and developed markets. Margin pressure also increases when raw material prices fluctuate, particularly for probiotics, plant extracts, and omega-3 sources. These factors constrain near-term expansion unless pricing strategies and formulation efficiency improve.
Opportunity:
Plant-Based Functional Products Creating New Growth Opportunities
Plant-based functional products present a clear growth pathway for your portfolio beyond 2025. Global adoption of vegetarian and flexitarian diets continues to rise, with plant-based food sales expected to grow at an estimated 9 to 10 percent CAGR through 2030. Consumers associate plant-derived proteins, fibers, and bioactives with both health and environmental benefits, expanding the addressable audience for functional offerings.
Expanding Consumer Demand for Plant-Derived Nutraceuticals
You can capture this demand through algae-based omega-3s, plant-protein nutrition bars, and fortified dairy alternatives. These segments attract younger consumers and premium buyers simultaneously. In value terms, plant-based functional products could account for an estimated 18 percent of total functional food revenue by 2034. This shift supports portfolio diversification and reduces dependence on animal-based inputs.
Trend:
Personalized Nutrition Transforming Consumer Health Choices
Personalized nutrition continues to gain commercial traction in 2025 as consumers seek targeted outcomes rather than general wellness claims. Digital platforms now combine biomarker testing, dietary surveys, and AI-driven recommendations to guide product selection. Subscription-based personalized vitamin packs and nutrition programs report adoption growth above 15 percent annually in developed markets.
For you, this trend reshapes product design and customer engagement. Custom formulations increase retention and support higher average order values. Data-driven personalization also improves marketing efficiency by aligning products with specific health goals such as energy management, gut health, or cognitive performance. Over time, this trend strengthens brand loyalty and supports premium pricing across functional food and nutraceutical categories.
Recent Developments
Dec 2024 – Danone S.A.: Danone announced the expansion of its probiotic and gut-health product portfolio across Europe and North America, supported by an investment of over USD 250 million in fermentation capacity and clinical research. This move strengthens Danone’s position in science-backed functional dairy and supports long-term growth in digestive health categories.
Feb 2025 – Nestlé Health Science: Nestlé Health Science launched a new range of personalized nutrition supplements integrated with digital assessment tools, targeting metabolic and healthy aging needs. The platform is expected to reach over 2 million users by the end of 2025. This initiative enhances Nestlé’s presence in personalized nutraceuticals and increases recurring revenue through subscription-based models.
Apr 2025 – Amway Corporation: Amway expanded its Nutrilite manufacturing operations in India and Southeast Asia with a facility investment valued at approximately USD 180 million. The expansion aims to increase regional output capacity by nearly 30 percent. This development improves supply resilience and accelerates penetration in high-growth Asia Pacific markets.
Jul 2025 – Herbalife Ltd.: Herbalife entered a strategic partnership with a biotechnology firm to develop plant-based protein and micronutrient blends tailored for active lifestyle consumers. Initial pilot launches cover North America and Latin America, representing an addressable consumer base of over 50 million. The partnership strengthens Herbalife’s product relevance among younger and fitness-focused demographics.
Sep 2025 – DSM-Firmenich: DSM-Firmenich introduced a new bioavailability-enhanced vitamin and omega-3 ingredient platform for functional foods and supplements. Early adoption agreements cover an estimated 20 percent of its top global food manufacturing clients. This advancement reinforces the company’s role as a key ingredient supplier and shapes formulation standards across the industry.
Frequently Asked Questions
How big is the Functional Food & Nutraceuticals Market?
The Global Functional Food & Nutraceuticals Market was valued at USD 334.8 Billion in 2024 and is projected to reach USD 709.5 Billion by 2034, expanding at a CAGR of 7.8% from 2026–2034. Explore key market trends, growth drivers, consumer demand for fortified foods, dietary supplements, and future industry opportunities.
Who are the major players in the Functional Food & Nutraceuticals Market?
Bayer AG, Nu Skin Enterprises, Inc., Kellogg Company, Nature’s Sunshine Products, Inc., PepsiCo, Inc., Alticor Inc. (Amway Corporation), Abbott Laboratories, NOW Health Group, Inc. (NOW Foods), Red Bull GmbH, Danone S.A., The Hain Celestial Group, Inc., Herbalife International of America, Inc., Nestlé S.A.
Which segments covered the Functional Food & Nutraceuticals Market?
By Product Type (Functional Food, Functional Beverages, Dietary Supplements), By Distribution Channel (Specialty Stores, Supermarkets/Hypermarkets, Drug Stores/Pharmacies, Online Retail Stores, Other Distribution Channels)
How can this market research report help my business make strategic decisions?
Our market research reports provide actionable intelligence, including verified market size data, CAGR projections, competitive benchmarking, and segment-level opportunity analysis. These insights support strategic planning, investment decisions, product development, and market entry strategies for enterprises and startups alike.
How frequently is the data updated?
We continuously monitor industry developments and update our reports to reflect regulatory changes, technological advancements, and macroeconomic shifts. Updated editions ensure you receive the latest market intelligence.