Gas Cylinder Market Size 2034 Global Growth & Trends| 6.0% CAGR
Global Gas Cylinder Market Size, Share & Analysis By Material (Steel, Aluminium, Composites, Others), By Capacity (Less than 10 Kg, 10 to 50 Kg, 50 to 100 Kg, Above 100 Kg), By Application (Liquefied Gases, Non-liquefied Gases, Dissolved Gases), By End-use (Industrial, Transportation, Residential, Commercial), Safety Regulations, Distribution Network, Competitive Analysis & Forecast 2025–2034
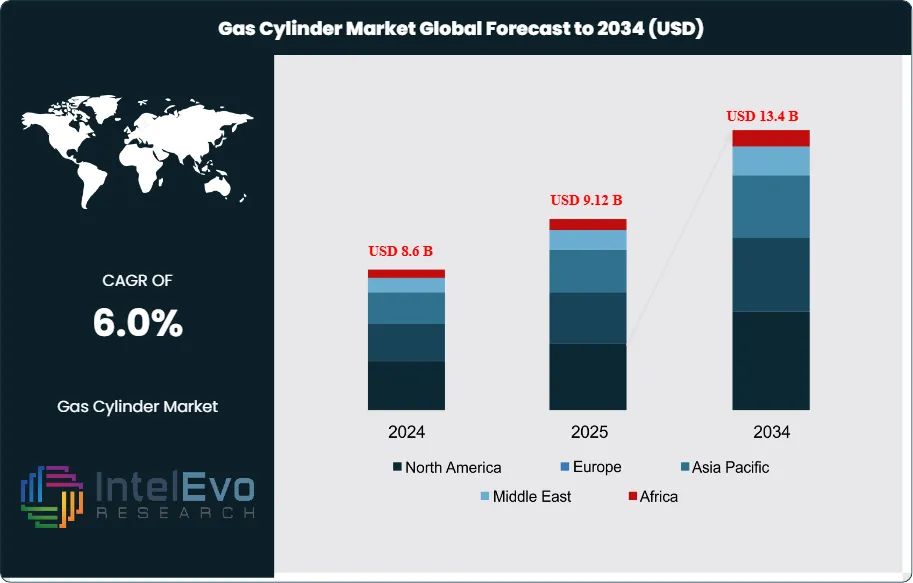
The Gas Cylinder Market is estimated at USD 8.6 billion in 2024 and is on track to reach roughly USD 13.4 billion by 2034, implying a compound annual growth rate of 6.0% over 2024–2034. Demand has historically been anchored in household LPG, medical oxygen, and industrial gases, with unit volumes steadily expanding as governments replace biomass and kerosene with cleaner fuels and as healthcare systems strengthen oxygen security. The market’s size evolution reflects this policy momentum: Asia–Pacific already accounts for 46.4% of global revenues, underpinned by rapid consumer adoption and industrialization, while multi-year programs have widened affordability and last-mile access. India’s LPG consumption alone rose more than 84%—from 15.3 million tonnes in 2011–12 to 28.3 million tonnes in 2021–22—illustrating how sustained subsidies translate into cylinder penetration and refill frequency. Targeted cash transfers in Latin America (e.g., monthly vouchers of S/25 per household, totaling S/.1.36 billion by October 2022) and the distribution of 60,000 six-kilogram cylinders alongside VAT exemptions for cooking LPG further underscore the policy tailwinds. India’s Pradhan Mantri Ujjwala Yojana, covering over 90 million beneficiaries, increased its per-cylinder subsidy to ₹300 in 2024 for up to 12 refills, reinforcing demand elasticity at the base of the pyramid.
Growth drivers over the forecast horizon include accelerated clean-cooking transitions in South and Southeast Asia and parts of Africa; post-pandemic resilience in medical oxygen infrastructure; and industrial demand from metals, fabrication, and specialty gases. On the supply side, manufacturers benefit from scale in cylinder fabrication, automated testing, and globalized valve and regulator supply chains. Key challenges persist: input-material volatility (steel and aluminum), safety and recertification compliance costs, counterfeiting risks in informal resale markets, and distribution inefficiencies in remote geographies. Regulatory tightening—covering design codes, periodic inspection, and traceability—raises barriers to entry but supports long-term quality and brand consolidation.
Technology is reshaping adoption. Lightweight composite cylinders (often 30–50% lower tare weight than steel) improve safety and ergonomics for rural users; RFID/IoT tagging and smart valves enhance asset tracking, anti-pilferage, and predictive maintenance; AI-enabled routing optimizes last-mile delivery and refill logistics; and automated filling lines raise throughput and consistency. Regionally, Asia–Pacific will remain the anchor of absolute growth, with South Asia as the largest volume opportunity and Southeast Asia as a fast-follower. Investment hotspots to watch include Africa’s emerging clean-cooking initiatives, Latin America’s targeted subsidy frameworks, and Europe’s specialty and hydrogen-ready cylinder niches, collectively shaping a stable, policy-backed growth trajectory through 2034.
Key Takeaways
Market Growth: The global gas cylinder market is projected to expand from USD 7.6 billion in 2024 to USD 13.4 billion by 2034, reflecting a 6.0% CAGR (2025–2034), underpinned by clean-cooking programs, industrial gas demand, and resilient medical oxygen infrastructure.
Material: Steel cylinders lead with a 64.5% revenue share due to lower cost, established codes, and high-pressure ratings; however, composite cylinders, which are typically 30–50% lighter, are gaining share in consumer and healthcare segments on safety and ergonomics.
Application: Liquefied gases (primarily LPG) account for 52.4% of demand, sustained by household and small-business refills as governments subsidize clean cooking and expand last-mile distribution.
Capacity: 10–50 kg formats hold 37.1% share, balancing portability with refill economics for household clusters, micro-enterprises, and field industrial uses.
Driver: Policy support is a decisive catalyst—industrial end-use already contributes 42.2% of market revenues, while clean-cooking subsidies (e.g., India’s PMUY at ₹300 per 14.2-kg refill and Latin American voucher programs) have lifted LPG adoption and refill frequency.
Restraint: Input-material volatility and compliance costs weigh on margins; steel price swings can materially affect cylinder ASPs, while mandatory inspection/recertification cycles (often every 5 years) add recurring OPEX and downtime, especially for small distributors.
Opportunity: A USD 4.8 billion incremental pool opens through 2034; if composites capture even +5 percentage points of share from steel by 2034, that shift alone would reallocate roughly USD 620 million of annual revenue toward higher-value lightweight designs.
Trend: Digitization is scaling fast—RFID/IoT-tagged cylinders enable asset traceability and anti-pilferage, and route optimization/automated filling lines are reducing delivery and turnaround costs, supporting higher refill throughput and improved safety performance.
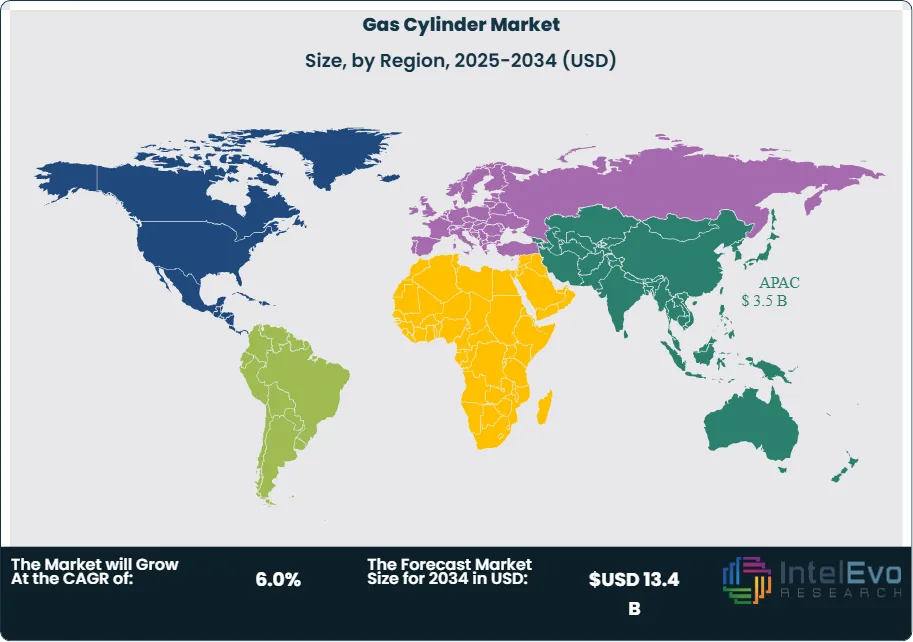
Regional Analysis: Asia–Pacific is the demand anchor at approximately USD 3.5 billion in 2024 (≈46% share), led by South and Southeast Asia’s clean-cooking transitions and industrialization; Latin America remains subsidy-driven and Africa is emerging as the next clean-cooking hotspot, while Europe skews toward specialty and hydrogen-ready cylinders.
Material Analysis
Steel remains the reference material in 2025, accounting for roughly 64.5% of installed cylinder revenues. Its dominance reflects a superior cost-to-pressure ratio, broad code acceptance (ISO/EN/DOT), and proven performance in high-pressure service for LPG, oxygen, nitrogen, and industrial mixes. High recyclability also aligns steel with tightening stewardship and end-of-life mandates, supporting procurement in industrial, healthcare, and municipal contracts.
Aluminium and advanced composites are, however, capturing incremental share in weight-sensitive use cases. Aluminium’s corrosion resistance and clean internal finish suit medical and beverage gases, while Type III/IV composites deliver 30–50% lower tare weight, reducing handling risk and last-mile costs in residential LPG and home-care oxygen. As AI-enabled route planning and IoT tracking scale, the economics of lighter, traceable assets improve; the resulting shift is expected to move several share points from steel to composites through 2030–2034, particularly in retail LPG and mobility pilots.
Capacity Analysis
The 10–50 kg band remains the workhorse of the market with about 37.1% share, balancing refill economics and portability. This format underpins household and micro-enterprise LPG use and supports field operations in hospitality, light fabrication, and construction where manual handling and rapid swap-outs are critical. Distributors favor this range for higher asset turns and better truck utilization.
Sub-10 kg packs are expanding with clean-cooking programs and last-mile delivery platforms, offering safer alternatives to biomass in peri-urban and rural settings. At the other end, 50–100 kg and >100 kg formats anchor industrial consumption—cutting/welding shops, chemical dosing, and water treatment—where stationary storage and manifolded banks dominate and price sensitivity to steel and valve components is highest. Across tiers, compliance (hydrostatic tests, periodic inspection) and improved valve/OPD designs are raising safety while preserving uptime.
Application Analysis
Liquefied gases lead with an estimated 52.4% share in 2025, propelled by LPG for cooking and commercial energy, and CO₂/N₂O in food, beverage, and medical applications. Growth is reinforced by subsidy frameworks, VAT relief in select markets, and expanding cold-chain and carbonation demand, which prefer standardized cylinders and well-developed exchange networks.
Non-liquefied (compressed) gases—oxygen, nitrogen, argon—remain essential to hospitals and fabrication shops, benefiting from post-pandemic oxygen infrastructure and ongoing manufacturing recovery. Dissolved gases, led by acetylene for welding, constitute a smaller but resilient niche; innovations in porous mass and safety valves continue to reduce incident rates and insurance costs, protecting share despite slower volume growth.
End-use Analysis
Industrial users account for roughly 42.2% of 2025 consumption, underwritten by metals fabrication (O₂/Ar/CO₂ blends), chemicals and petrochemicals (N₂ blanketing, specialty gases), and water treatment (chlorination/ozonation). Capital projects and infrastructure upgrades in emerging markets sustain multi-year demand visibility, while strict plant safety audits favor certified suppliers and drive replacement of legacy assets.
Residential and commercial segments grow on the back of LPG penetration and small-format refills for restaurants and small industries. Healthcare maintains elevated baseline demand for medical oxygen and specialty gases, with hospitals specifying lighter cylinders and integrated regulators to reduce manual-handling risk. In transportation, early hydrogen mobility and composite cylinder adoption in fleets and aerospace ground support remain pilot-scale but represent the fastest structural optionality for the supply base.
Regional Analysis
Asia Pacific remains the demand anchor with a mid-40s revenue share (~46%) and an estimated value near USD 3.5 billion in 2024, extending momentum into 2025. India, Southeast Asia, and China drive volumes via clean-cooking expansion and industrialization, while localization of cylinder manufacturing and valve assembly shortens lead times and buffers FX risk.
North America and Europe are mature, compliance-intensive markets where growth is tied to asset renewal, healthcare resilience, and specialty gases. Uptake of composite cylinders and hydrogen-ready designs is most pronounced here, aided by stringent safety frameworks and decarbonization funding. Latin America and the Middle East & Africa show accelerating, subsidy-supported LPG adoption and industrial project pipelines; although smaller in absolute value, these regions offer above-market CAGRs through 2034 as distribution networks formalize and medical gas infrastructure scales.
By Material (Steel, Aluminium, Composites, Others), By Capacity (Less than 10 Kg, 10 to 50 Kg, 50 to 100 Kg, Above 100 Kg), By Application (Liquefied Gases, Non-liquefied Gases, Dissolved Gases), By End-use (Industrial, Transportation, Residential, Commercial)
Research Methodology
Primary Research- 100 Interviews of Stakeholders
Secondary Research
Desk Research
Regional scope
North America (United States, Canada, Mexico)
Latin America (Brazil, Argentina, Columbia)
East Asia And Pacific (China, Japan, South Korea, Australia, Cambodia, Fiji, Indonesia)
Sea And South Asia (India, Singapore, Thailand, Taiwan, Malaysia)
Eastern Europe (Poland, Russia, Czech Republic, Romania)
Western Europe (Germany, U.K., France, Spain, Itlay)
Middle East & Africa (GCC Countries, Egypt, Nigeria, South Africa, Israel)
Competitive Landscape
Worthington Industries, Faber Industrie, 3M Company, Luxfer Gas Cylinders, Jiangsu Minsheng Heavy Industries Co., Ltd., Quantum Fuel Systems LLC., Al Aman Gas Cylinders Manufacturing, Manchester Tank, Beijing Tianhai Industrial Co., Ltd., Supreme Industries Limited, Aygaz A.Ş, Hexagon Composites, Everest Kanto Cylinder Ltd., BINA (SHANGHAI) GAS CYLINDER CO., LTD., Confidence Group, Other Key Players
Customization Scope
Customization for segments, region/country-level will be provided. Moreover, additional customization can be done based on the requirements.
Pricing and Purchase Options
Avail customized purchase options to meet your exact research needs. We have three licenses to opt for: Single User License, Multi-User License (Up to 5 Users), Corporate Use License (Unlimited User and Printable PDF).
TABLE OF CONTENTS
1. EXECUTIVE SUMMARY
1.1. MARKET SNAPSHOT
1.2. KEY FINDINGS & INSIGHTS
1.3. ANALYST RECOMMENDATIONS
1.4. FUTURE OUTLOOK
2. RESEARCH METHODOLOGY
2.1. MARKET DEFINITION & SCOPE
2.2. RESEARCH OBJECTIVES: PRIMARY & SECONDARY DATA SOURCES
2.3. DATA COLLECTION SOURCES
2.3.1. COVERAGE OF 100+ PRIMARY RESEARCH/CONSULTATION CALLS WITH INDUSTRY STAKEHOLDERS
FIGURE 17 NORTH AMERICA GAS CYLINDER SYSTEM CURRENT AND FUTURE TYPE ANALYSIS, 2025–2034, (USD MILLION)
FIGURE 18 NORTH AMERICA GAS CYLINDER SYSTEM CURRENT AND FUTURE END USER ANALYSIS, 2025–2034, (USD MILLION)
FIGURE 19 MARKET SHARE BY COUNTRY
FIGURE 20 LATIN AMERICA GAS CYLINDER SYSTEM CURRENT AND FUTURE TYPE ANALYSIS, 2025–2034, (USD MILLION)
FIGURE 21 LATIN AMERICA GAS CYLINDER SYSTEM CURRENT AND FUTURE END USER ANALYSIS, 2025–2034, (USD MILLION)
FIGURE 22 MARKET SHARE BY COUNTRY
FIGURE 23 EASTERN EUROPE GAS CYLINDER SYSTEM CURRENT AND FUTURE TYPE ANALYSIS, 2025–2034, (USD MILLION)
FIGURE 24 EASTERN EUROPE GAS CYLINDER SYSTEM CURRENT AND FUTURE END USER ANALYSIS, 2025–2034, (USD MILLION)
FIGURE 25 MARKET SHARE BY COUNTRY
FIGURE 26 WESTERN EUROPE GAS CYLINDER SYSTEM CURRENT AND FUTURE TYPE ANALYSIS, 2025–2034, (USD MILLION)
FIGURE 27 WESTERN EUROPE GAS CYLINDER SYSTEM CURRENT AND FUTURE END USER ANALYSIS, 2025–2034, (USD MILLION)
FIGURE 28 MARKET SHARE BY COUNTRY
FIGURE 29 EAST ASIA AND PACIFIC GAS CYLINDER SYSTEM CURRENT AND FUTURE TYPE ANALYSIS, 2025–2034, (USD MILLION)
FIGURE 30 EAST ASIA AND PACIFIC GAS CYLINDER SYSTEM CURRENT AND FUTURE END USER ANALYSIS, 2025–2034, (USD MILLION)
FIGURE 31 MARKET SHARE BY COUNTRY
FIGURE 32 SEA AND SOUTH ASIA GAS CYLINDER SYSTEM CURRENT AND FUTURE TYPE ANALYSIS, 2025–2034, (USD MILLION)
FIGURE 33 SEA AND SOUTH ASIA GAS CYLINDER SYSTEM CURRENT AND FUTURE END USER ANALYSIS, 2025–2034, (USD MILLION)
FIGURE 34 MARKET SHARE BY COUNTRY
FIGURE 35 MIDDLE EAST AND AFRICA GAS CYLINDER SYSTEM CURRENT AND FUTURE TYPE ANALYSIS, 2025–2034, (USD MILLION)
FIGURE 36 MIDDLE EAST AND AFRICA GAS CYLINDER SYSTEM CURRENT AND FUTURE END USER ANALYSIS, 2025–2034, (USD MILLION)
FIGURE 37 NORTH AMERICA GAS CYLINDER SYSTEM CURRENT AND FUTURE MARKET VOLUME SHARE REGIONAL ANALYSIS, 2025–2034, (USD MILLION)
FIGURE 38 U.S. GAS CYLINDER SYSTEM CURRENT AND FUTURE TYPE ANALYSIS, 2025–2034, (USD MILLION)
FIGURE 39 U.S. GAS CYLINDER SYSTEM CURRENT AND FUTURE END USER ANALYSIS, 2025–2034, (USD MILLION)
FIGURE 40 CANADA GAS CYLINDER SYSTEM CURRENT AND FUTURE TYPE ANALYSIS, 2025–2034, (USD MILLION)
FIGURE 41 CANADA GAS CYLINDER SYSTEM CURRENT AND FUTURE END USER ANALYSIS, 2025–2034, (USD MILLION)
FIGURE 42 LATIN AMERICA GAS CYLINDER SYSTEM CURRENT AND FUTURE MARKET VOLUME SHARE REGIONAL ANALYSIS, 2025–2034, (USD MILLION)
FIGURE 43 MEXICO GAS CYLINDER SYSTEM CURRENT AND FUTURE TYPE ANALYSIS, 2025–2034, (USD MILLION)
FIGURE 44 MEXICO GAS CYLINDER SYSTEM CURRENT AND FUTURE END USER ANALYSIS, 2025–2034, (USD MILLION)
FIGURE 45 BRAZIL GAS CYLINDER SYSTEM CURRENT AND FUTURE TYPE ANALYSIS, 2025–2034, (USD MILLION)
FIGURE 46 BRAZIL GAS CYLINDER SYSTEM CURRENT AND FUTURE END USER ANALYSIS, 2025–2034, (USD MILLION)
FIGURE 47 ARGENTINA GAS CYLINDER SYSTEM CURRENT AND FUTURE TYPE ANALYSIS, 2025–2034, (USD MILLION)
FIGURE 48 ARGENTINA GAS CYLINDER SYSTEM CURRENT AND FUTURE END USER ANALYSIS, 2025–2034, (USD MILLION)
FIGURE 49 COLUMBIA GAS CYLINDER SYSTEM CURRENT AND FUTURE TYPE ANALYSIS, 2025–2034, (USD MILLION)
FIGURE 50 COLUMBIA GAS CYLINDER SYSTEM CURRENT AND FUTURE END USER ANALYSIS, 2025–2034, (USD MILLION)
FIGURE 51 REST OF LATIN AMERICA GAS CYLINDER SYSTEM CURRENT AND FUTURE TYPE ANALYSIS, 2025–2034, (USD MILLION)
FIGURE 52 REST OF LATIN AMERICA GAS CYLINDER SYSTEM CURRENT AND FUTURE END USER ANALYSIS, 2025–2034, (USD MILLION)
FIGURE 53 EASTERN EUROPE GAS CYLINDER SYSTEM CURRENT AND FUTURE MARKET VOLUME SHARE REGIONAL ANALYSIS, 2025–2034, (USD MILLION)
FIGURE 54 POLAND GAS CYLINDER SYSTEM CURRENT AND FUTURE TYPE ANALYSIS, 2025–2034, (USD MILLION)
FIGURE 55 POLAND GAS CYLINDER SYSTEM CURRENT AND FUTURE END USER ANALYSIS, 2025–2034, (USD MILLION)
FIGURE 56 RUSSIA GAS CYLINDER SYSTEM CURRENT AND FUTURE TYPE ANALYSIS, 2025–2034, (USD MILLION)
FIGURE 57 RUSSIA GAS CYLINDER SYSTEM CURRENT AND FUTURE END USER ANALYSIS, 2025–2034, (USD MILLION)
FIGURE 58 CZECH REPUBLIC GAS CYLINDER SYSTEM CURRENT AND FUTURE TYPE ANALYSIS, 2025–2034, (USD MILLION)
FIGURE 59 CZECH REPUBLIC GAS CYLINDER SYSTEM CURRENT AND FUTURE END USER ANALYSIS, 2025–2034, (USD MILLION)
FIGURE 60 ROMANIA GAS CYLINDER SYSTEM CURRENT AND FUTURE TYPE ANALYSIS, 2025–2034, (USD MILLION)
FIGURE 61 ROMANIA GAS CYLINDER SYSTEM CURRENT AND FUTURE END USER ANALYSIS, 2025–2034, (USD MILLION)
FIGURE 62 REST OF EASTERN EUROPE GAS CYLINDER SYSTEM CURRENT AND FUTURE TYPE ANALYSIS, 2025–2034, (USD MILLION)
FIGURE 63 REST OF EASTERN EUROPE GAS CYLINDER SYSTEM CURRENT AND FUTURE END USER ANALYSIS, 2025–2034, (USD MILLION)
FIGURE 64 WESTERN EUROPE GAS CYLINDER SYSTEM CURRENT AND FUTURE MARKET VOLUME SHARE REGIONAL ANALYSIS, 2025–2034, (USD MILLION)
FIGURE 65 GERMANY GAS CYLINDER SYSTEM CURRENT AND FUTURE TYPE ANALYSIS, 2025–2034, (USD MILLION)
FIGURE 66 GERMANY GAS CYLINDER SYSTEM CURRENT AND FUTURE END USER ANALYSIS, 2025–2034, (USD MILLION)
FIGURE 67 FRANCE GAS CYLINDER SYSTEM CURRENT AND FUTURE TYPE ANALYSIS, 2025–2034, (USD MILLION)
FIGURE 68 FRANCE GAS CYLINDER SYSTEM CURRENT AND FUTURE END USER ANALYSIS, 2025–2034, (USD MILLION)
FIGURE 69 UK GAS CYLINDER SYSTEM CURRENT AND FUTURE TYPE ANALYSIS, 2025–2034, (USD MILLION)
FIGURE 70 UK GAS CYLINDER SYSTEM CURRENT AND FUTURE END USER ANALYSIS, 2025–2034, (USD MILLION)
FIGURE 71 SPAIN GAS CYLINDER SYSTEM CURRENT AND FUTURE TYPE ANALYSIS, 2025–2034, (USD MILLION)
FIGURE 72 SPAIN GAS CYLINDER SYSTEM CURRENT AND FUTURE END USER ANALYSIS, 2025–2034, (USD MILLION)
FIGURE 73 ITALY GAS CYLINDER SYSTEM CURRENT AND FUTURE TYPE ANALYSIS, 2025–2034, (USD MILLION)
FIGURE 74 ITALY GAS CYLINDER SYSTEM CURRENT AND FUTURE END USER ANALYSIS, 2025–2034, (USD MILLION)
FIGURE 75 REST OF WESTERN EUROPE GAS CYLINDER SYSTEM CURRENT AND FUTURE TYPE ANALYSIS, 2025–2034, (USD MILLION)
FIGURE 76 REST OF WESTERN EUROPE GAS CYLINDER SYSTEM CURRENT AND FUTURE END USER ANALYSIS, 2025–2034, (USD MILLION)
FIGURE 77 EAST ASIA AND PACIFIC GAS CYLINDER SYSTEM CURRENT AND FUTURE MARKET VOLUME SHARE REGIONAL ANALYSIS, 2025–2034, (USD MILLION)
FIGURE 78 CHINA GAS CYLINDER SYSTEM CURRENT AND FUTURE TYPE ANALYSIS, 2025–2034, (USD MILLION)
FIGURE 79 CHINA GAS CYLINDER SYSTEM CURRENT AND FUTURE END USER ANALYSIS, 2025–2034, (USD MILLION)
FIGURE 80 JAPAN GAS CYLINDER SYSTEM CURRENT AND FUTURE TYPE ANALYSIS, 2025–2034, (USD MILLION)
FIGURE 81 JAPAN GAS CYLINDER SYSTEM CURRENT AND FUTURE END USER ANALYSIS, 2025–2034, (USD MILLION)
FIGURE 82 AUSTRALIA GAS CYLINDER SYSTEM CURRENT AND FUTURE TYPE ANALYSIS, 2025–2034, (USD MILLION)
FIGURE 83 AUSTRALIA GAS CYLINDER SYSTEM CURRENT AND FUTURE END USER ANALYSIS, 2025–2034, (USD MILLION)
FIGURE 84 CAMBODIA GAS CYLINDER SYSTEM CURRENT AND FUTURE TYPE ANALYSIS, 2025–2034, (USD MILLION)
FIGURE 85 CAMBODIA GAS CYLINDER SYSTEM CURRENT AND FUTURE END USER ANALYSIS, 2025–2034, (USD MILLION)
FIGURE 86 FIJI GAS CYLINDER SYSTEM CURRENT AND FUTURE TYPE ANALYSIS, 2025–2034, (USD MILLION)
FIGURE 87 FIJI GAS CYLINDER SYSTEM CURRENT AND FUTURE END USER ANALYSIS, 2025–2034, (USD MILLION)
FIGURE 88 INDONESIA GAS CYLINDER SYSTEM CURRENT AND FUTURE TYPE ANALYSIS, 2025–2034, (USD MILLION)
FIGURE 89 INDONESIA GAS CYLINDER SYSTEM CURRENT AND FUTURE END USER ANALYSIS, 2025–2034, (USD MILLION)
FIGURE 90 SOUTH KOREA GAS CYLINDER SYSTEM CURRENT AND FUTURE TYPE ANALYSIS, 2025–2034, (USD MILLION)
FIGURE 91 SOUTH KOREA GAS CYLINDER SYSTEM CURRENT AND FUTURE END USER ANALYSIS, 2025–2034, (USD MILLION)
FIGURE 92 REST OF EAST ASIA AND PACIFIC GAS CYLINDER SYSTEM CURRENT AND FUTURE TYPE ANALYSIS, 2025–2034, (USD MILLION)
FIGURE 93 REST OF EAST ASIA AND PACIFIC GAS CYLINDER SYSTEM CURRENT AND FUTURE END USER ANALYSIS, 2025–2034, (USD MILLION)
FIGURE 94 SEA AND SOUTH ASIA GAS CYLINDER SYSTEM CURRENT AND FUTURE MARKET VOLUME SHARE REGIONAL ANALYSIS, 2025–2034, (USD MILLION)
FIGURE 95 BANGLADESH GAS CYLINDER SYSTEM CURRENT AND FUTURE TYPE ANALYSIS, 2025–2034, (USD MILLION)
FIGURE 96 BANGLADESH GAS CYLINDER SYSTEM CURRENT AND FUTURE END USER ANALYSIS, 2025–2034, (USD MILLION)
FIGURE 97 NEW ZEALAND GAS CYLINDER SYSTEM CURRENT AND FUTURE TYPE ANALYSIS, 2025–2034, (USD MILLION)
FIGURE 98 NEW ZEALAND GAS CYLINDER SYSTEM CURRENT AND FUTURE END USER ANALYSIS, 2025–2034, (USD MILLION)
FIGURE 99 INDIA GAS CYLINDER SYSTEM CURRENT AND FUTURE TYPE ANALYSIS, 2025–2034, (USD MILLION)
FIGURE 100 INDIA GAS CYLINDER SYSTEM CURRENT AND FUTURE END USER ANALYSIS, 2025–2034, (USD MILLION)
FIGURE 101 SINGAPORE GAS CYLINDER SYSTEM CURRENT AND FUTURE TYPE ANALYSIS, 2025–2034, (USD MILLION)
FIGURE 102 SINGAPORE GAS CYLINDER SYSTEM CURRENT AND FUTURE END USER ANALYSIS, 2025–2034, (USD MILLION)
FIGURE 103 THAILAND GAS CYLINDER SYSTEM CURRENT AND FUTURE TYPE ANALYSIS, 2025–2034, (USD MILLION)
FIGURE 104 THAILAND GAS CYLINDER SYSTEM CURRENT AND FUTURE END USER ANALYSIS, 2025–2034, (USD MILLION)
FIGURE 105 TAIWAN GAS CYLINDER SYSTEM CURRENT AND FUTURE TYPE ANALYSIS, 2025–2034, (USD MILLION)
FIGURE 106 TAIWAN GAS CYLINDER SYSTEM CURRENT AND FUTURE END USER ANALYSIS, 2025–2034, (USD MILLION)
FIGURE 107 MALAYSIA GAS CYLINDER SYSTEM CURRENT AND FUTURE TYPE ANALYSIS, 2025–2034, (USD MILLION)
FIGURE 108 MALAYSIA GAS CYLINDER SYSTEM CURRENT AND FUTURE END USER ANALYSIS, 2025–2034, (USD MILLION)
FIGURE 109 REST OF SEA AND SOUTH ASIA GAS CYLINDER SYSTEM CURRENT AND FUTURE TYPE ANALYSIS, 2025–2034, (USD MILLION)
FIGURE 110 REST OF SEA AND SOUTH ASIA GAS CYLINDER SYSTEM CURRENT AND FUTURE END USER ANALYSIS, 2025–2034, (USD MILLION)
FIGURE 111 MIDDLE EAST AND AFRICA GAS CYLINDER SYSTEM CURRENT AND FUTURE MARKET VOLUME SHARE REGIONAL ANALYSIS, 2025–2034, (USD MILLION)
FIGURE 112 GCC COUNTRIES GAS CYLINDER SYSTEM CURRENT AND FUTURE TYPE ANALYSIS, 2025–2034, (USD MILLION)
FIGURE 113 GCC COUNTRIES GAS CYLINDER SYSTEM CURRENT AND FUTURE END USER ANALYSIS, 2025–2034, (USD MILLION)
FIGURE 114 SAUDI ARABIA GAS CYLINDER SYSTEM CURRENT AND FUTURE TYPE ANALYSIS, 2025–2034, (USD MILLION)
FIGURE 115 SAUDI ARABIA GAS CYLINDER SYSTEM CURRENT AND FUTURE END USER ANALYSIS, 2025–2034, (USD MILLION)
FIGURE 116 UAE GAS CYLINDER SYSTEM CURRENT AND FUTURE TYPE ANALYSIS, 2025–2034, (USD MILLION)
FIGURE 117 UAE GAS CYLINDER SYSTEM CURRENT AND FUTURE END USER ANALYSIS, 2025–2034, (USD MILLION)
FIGURE 118 BAHRAIN GAS CYLINDER SYSTEM CURRENT AND FUTURE TYPE ANALYSIS, 2025–2034, (USD MILLION)
FIGURE 119 BAHRAIN GAS CYLINDER SYSTEM CURRENT AND FUTURE END USER ANALYSIS, 2025–2034, (USD MILLION)
FIGURE 120 KUWAIT GAS CYLINDER SYSTEM CURRENT AND FUTURE TYPE ANALYSIS, 2025–2034, (USD MILLION)
FIGURE 121 KUWAIT GAS CYLINDER SYSTEM CURRENT AND FUTURE END USER ANALYSIS, 2025–2034, (USD MILLION)
FIGURE 122 OMAN GAS CYLINDER SYSTEM CURRENT AND FUTURE TYPE ANALYSIS, 2025–2034, (USD MILLION)
FIGURE 123 OMAN GAS CYLINDER SYSTEM CURRENT AND FUTURE END USER ANALYSIS, 2025–2034, (USD MILLION)
FIGURE 124 QATAR GAS CYLINDER SYSTEM CURRENT AND FUTURE TYPE ANALYSIS, 2025–2034, (USD MILLION)
FIGURE 125 QATAR GAS CYLINDER SYSTEM CURRENT AND FUTURE END USER ANALYSIS, 2025–2034, (USD MILLION)
FIGURE 126 EGYPT GAS CYLINDER SYSTEM CURRENT AND FUTURE TYPE ANALYSIS, 2025–2034, (USD MILLION)
FIGURE 127 EGYPT GAS CYLINDER SYSTEM CURRENT AND FUTURE END USER ANALYSIS, 2025–2034, (USD MILLION)
FIGURE 128 NIGERIA GAS CYLINDER SYSTEM CURRENT AND FUTURE TYPE ANALYSIS, 2025–2034, (USD MILLION)
FIGURE 129 NIGERIA GAS CYLINDER SYSTEM CURRENT AND FUTURE END USER ANALYSIS, 2025–2034, (USD MILLION)
FIGURE 130 SOUTH AFRICA GAS CYLINDER SYSTEM CURRENT AND FUTURE TYPE ANALYSIS, 2025–2034, (USD MILLION)
FIGURE 131 SOUTH AFRICA GAS CYLINDER SYSTEM CURRENT AND FUTURE END USER ANALYSIS, 2025–2034, (USD MILLION)
FIGURE 132 ISRAEL GAS CYLINDER SYSTEM CURRENT AND FUTURE TYPE ANALYSIS, 2025–2034, (USD MILLION)
FIGURE 133 ISRAEL GAS CYLINDER SYSTEM CURRENT AND FUTURE END USER ANALYSIS, 2025–2034, (USD MILLION)
FIGURE 134 REST OF MEA GAS CYLINDER SYSTEM CURRENT AND FUTURE TYPE ANALYSIS, 2025–2034, (USD MILLION)
FIGURE 135 REST OF MEA GAS CYLINDER SYSTEM CURRENT AND FUTURE END USER ANALYSIS, 2025–2034, (USD MILLION)
FIGURE 136 U. S. MARKET SHARE ANALYSIS BY TYPE (2024)
FIGURE 137 U. S. MARKET SHARE ANALYSIS BY END USER (2024)
FIGURE 138 CANADA MARKET SHARE ANALYSIS BY TYPE (2024)
FIGURE 139 CANADA MARKET SHARE ANALYSIS BY END USER (2024)
FIGURE 140 MEXICO MARKET SHARE ANALYSIS BY TYPE (2024)
FIGURE 141 MEXICO MARKET SHARE ANALYSIS BY END USER (2024)
FIGURE 142 CHINA MARKET SHARE ANALYSIS BY TYPE (2024)
FIGURE 143 CHINA MARKET SHARE ANALYSIS BY END USER (2024)
FIGURE 144 JAPAN MARKET SHARE ANALYSIS BY TYPE (2024)
FIGURE 145 JAPAN MARKET SHARE ANALYSIS BY END USER (2024)
FIGURE 146 INDIA MARKET SHARE ANALYSIS BY TYPE (2024)
FIGURE 147 INDIA MARKET SHARE ANALYSIS BY END USER (2024)
FIGURE 148 SOUTH KOREA MARKET SHARE ANALYSIS BY TYPE (2024)
FIGURE 149 SOUTH KOREA MARKET SHARE ANALYSIS BY END USER (2024)
FIGURE 150 SAUDI ARABIA MARKET SHARE ANALYSIS BY TYPE (2024)
FIGURE 151 SAUDI ARABIA MARKET SHARE ANALYSIS BY END USER (2024)
FIGURE 152 UAE MARKET SHARE ANALYSIS BY TYPE (2024)
FIGURE 153 UAE MARKET SHARE ANALYSIS BY END USER (2024)
FIGURE 154 EGYPT MARKET SHARE ANALYSIS BY TYPE (2024)
FIGURE 155 EGYPT MARKET SHARE ANALYSIS BY END USER (2024)
FIGURE 156 NIGERIA MARKET SHARE ANALYSIS BY TYPE (2024)
FIGURE 157 NIGERIA MARKET SHARE ANALYSIS BY END USER (2024)
FIGURE 158 SOUTH AFRICA MARKET SHARE ANALYSIS BY TYPE (2024)
FIGURE 159 SOUTH AFRICA MARKET SHARE ANALYSIS BY END USER (2024)
FIGURE 160 GERMANY MARKET SHARE ANALYSIS BY TYPE (2024)
FIGURE 161 GERMANY MARKET SHARE ANALYSIS BY END USER (2024)
FIGURE 162 FRANCE MARKET SHARE ANALYSIS BY TYPE (2024)
FIGURE 163 FRANCE MARKET SHARE ANALYSIS BY END USER (2024)
FIGURE 164 UK MARKET SHARE ANALYSIS BY TYPE (2024)
FIGURE 165 UK MARKET SHARE ANALYSIS BY END USER (2024)
FIGURE 166 SPAIN MARKET SHARE ANALYSIS BY TYPE (2024)
FIGURE 167 SPAIN MARKET SHARE ANALYSIS BY END USER (2024)
FIGURE 168 ITALY MARKET SHARE ANALYSIS BY TYPE (2024)
FIGURE 169 ITALY MARKET SHARE ANALYSIS BY END USER (2024)
FIGURE 170 BRAZIL MARKET SHARE ANALYSIS BY TYPE (2024)
FIGURE 171 BRAZIL MARKET SHARE ANALYSIS BY END USER (2024)
FIGURE 172 ARGENTINA MARKET SHARE ANALYSIS BY TYPE (2024)
FIGURE 173 ARGENTINA MARKET SHARE ANALYSIS BY END USER (2024)
FIGURE 174 COLUMBIA MARKET SHARE ANALYSIS BY TYPE (2024)
FIGURE 175 COLUMBIA MARKET SHARE ANALYSIS BY END USER (2024)
FIGURE 176 GLOBAL GAS CYLINDER SYSTEM CURRENT AND FUTURE MARKET KEY COUNTRY LEVEL ANALYSIS, 2024–2034, (USD MILLION)
FIGURE 177 FINANCIAL OVERVIEW:
Key Player Analysis
3M Company: 3M’s Scott™ Fire & Safety business anchors the company’s relevance in the gas cylinder ecosystem through high-pressure SCBA cylinders used by fire services, defense, and industrial emergency teams. Its portfolio spans aluminum to carbon-wrapped cylinders, including 5,500 psig options and a 30-year service-life model in the U.S., targeting lower total cost of ownership in long-cycle fleets. The product roadmap emphasizes lighter profiles and user-centric ergonomics, aligning with stricter occupational safety standards and rising demand for high-reliability breathing air systems across North America and Europe.
Strategically, 3M is layering digital capabilities—device telemetry, inspection workflows, and documentation—around its SCBA platforms to improve uptime and compliance. Differentiation rests on integration (mask, regulator, and cylinder ecosystem), multi-duration options (30/45/60/75-minute), and extensive after-sales service networks. As municipalities upgrade fleets, 3M’s premium positioning and validated performance create pricing resilience despite steel and composite cost swings.
Hexagon Composites: In 2024, Hexagon divested Hexagon Ragasco (the world-scale LPG composite cylinder unit) to Worthington Enterprises, sharpening focus on alternative fuel mobility (CNG/RNG/H₂) and testing/analytics businesses. The shift concentrates capital on high-growth hydrogen and commercial vehicle platforms via Hexagon Agility and related units, with management guidance highlighting mix upgrade potential and a more focused asset base into 2025.
Post-divestiture, Hexagon’s edge is end-to-end know-how in Type IV storage integrated with vehicle systems and fleet telematics—positioning it to benefit from zero-emission truck and bus orders and early hydrogen refueling corridors. While Ragasco’s installed base exceeds 20–25 million composite LPG cylinders globally (now under Worthington), Hexagon’s retained businesses skew toward higher-value mobility applications, supporting margin expansion as hydrogen trials scale through the decade.
Supreme Industries Limited: Supreme has entered the cylinder market with Type IV composite LPG products under the KAVACH brand, backed by a highly automated facility in Halol, Gujarat. The Kautex-engineered line is designed for up to ~400,000 cylinders annually across six sizes, targeting India’s expanding LPG base and export opportunities in safety- and weight-sensitive segments. Robotics-enabled molding and finishing, combined with polymer expertise, underpin cost and quality control as the market shifts toward lighter SKUs.
Luxfer Gas Cylinders: Luxfer’s L7X® high-strength aluminum portfolio is a mainstay in medical oxygen and life-support, complemented by widespread global adoption—over 15 million Luxfer medical cylinders are in use worldwide. In alternative fuels, Luxfer’s G-Stor® Go H₂ Type IV cylinders and the G-Stor® Hydrosphere MEGC platform target hydrogen mobility and virtual pipeline logistics, launched and showcased across 2024 industry forums. This dual exposure to healthcare resilience and the energy transition provides balanced growth vectors into 2025–2027.
Differentiation stems from metallurgy (proprietary L7X alloy enabling higher fill pressures and lighter weight), broad certifications, and active H₂ R&D—including a 700-bar Type IV development program supported by public innovation grants. With specification tables spanning medical, SCBA, beverage, aerospace, and hydrogen, Luxfer competes on performance and lifecycle economics, and is positioned to benefit from elevated post-pandemic medical oxygen baselines and the step-up in hydrogen transport assets through the late 2020s.
Market Key Players
Worthington Industries
Faber Industrie
3M Company
Luxfer Gas Cylinders
Jiangsu Minsheng Heavy Industries Co., Ltd.
Quantum Fuel Systems LLC.
Al Aman Gas Cylinders Manufacturing
Manchester Tank
Beijing Tianhai Industrial Co., Ltd.
Supreme Industries Limited
Aygaz A.Ş
Hexagon Composites
Everest Kanto Cylinder Ltd.
BINA (SHANGHAI) GAS CYLINDER CO., LTD.
Confidence Group
Other Key Players
Driver:
Industrial Expansion and Clean-Energy Programs Driving Cylinder Market Growth
As of 2025, demand is being led by an upswing in manufacturing activity, sustained healthcare oxygen needs, and policy-backed clean-cooking initiatives. Industrial end use accounts for roughly 42.2% of consumption, while liquefied gases—including LPG for household and commercial energy—represent about 52.4% of application demand. With Asia Pacific holding ~46% of global revenue and serving as the center of incremental volumes, the market is positioned to expand at ~5.0% CAGR through 2034 as fabrication, chemicals, and food & beverage plants standardize gas-intensive processes and refill cycles.
The strategic impact is twofold: stable base-load consumption from industrial gases raises asset utilization for distributors, and subsidy-supported LPG programs accelerate cylinder turns in the 10–50 kg band (≈37.1% share). Suppliers with certified product portfolios and broad last-mile networks can capture higher wallet share via multi-gas contracts, bundled maintenance, and guaranteed turnaround times.
Restraint:
Cost Volatility and Safety Compliance Challenges Restricting Profitability
Margin pressure stems from input-material volatility and tightening compliance. Steel—still ~64.5% of installed cylinder revenues—exposes producers to commodity swings that can elevate cylinder ASPs and lengthen payback periods for fleet renewals. Mandatory hydrostatic testing and periodic inspection (commonly every five years) add recurring opex and downtime; industry estimates suggest safety and recertification costs can trim 80–150 bps from distributor EBITDA if not offset by pricing or route efficiency gains.
Safety risk remains a parallel constraint. High-pressure handling, counterfeit cylinders in informal channels, and leak incidents raise insurance and training outlays. Lost or pilfered assets—often 2–4% of fleets in under-digitized markets—erode returns and deter smaller operators from scaling without clear traceability and deposit frameworks.
Opportunity:
Lightweight Composites and Emerging Regions Unlocking High-Value Opportunities
Lightweight and specialty formats present the clearest upside. If composites gain even +5 percentage points of share from steel by 2030–2034, roughly USD 600–650 million of annual revenue could shift toward higher-value designs, supported by double-digit adoption in medical home-care oxygen, retail LPG, and mobility pilots. Africa, South Asia, and parts of Latin America are poised for above-market growth as clean-cooking programs and industrial parks expand—collectively representing a multiyear, USD ~4.8 billion incremental pool through 2034 under a 5% global CAGR baseline.
Vendors that localize manufacturing, offer cylinder-as-a-service (CaaS) models, and integrate telemetry can monetize premium features (integrated regulators, excess-flow valves, IoT tags) while lowering lifecycle costs for end users. Strategic partnerships with oil & gas marketers and hospital networks can accelerate channel penetration and lock in refill volumes.
Trend:
Digital Tracking and Safety-Focused Innovation Transforming Cylinder Operations
Digitization and safety-by-design are moving from pilots to scale. RFID/IoT-tagged cylinders, smart valves, and telemetry-enabled regulators are improving asset traceability, reducing losses, and enabling predictive maintenance; fleets with basic tagging report 10–15% faster turnaround and fewer stockouts. AI-assisted route optimization and automated filling lines are cutting delivery costs and enhancing compliance documentation—now a differentiator in tenders across healthcare and industrial accounts.
Concurrently, product architecture is shifting to lighter, hydrogen-ready and specialty-gas-compatible cylinders. Type III/IV composites—typically 30–50% lighter than steel—are penetrating weight-sensitive use cases, while enhanced liners and permeation barriers support high-purity gases for electronics and pharma. Together, these trends are redefining procurement criteria from upfront capex to total cost of ownership, favoring suppliers with integrated digital, safety, and service capabilities.
Recent Developments
Dec 2024 – Luxfer Holdings (Luxfer Gas Cylinders): Released its 2024 Sustainability Report, reporting a 48% reduction in Scope 1 & 2 emissions vs. 2019 and meeting its 34% waste-to-landfill reduction goal ahead of the 2025 target. This elevates Luxfer’s ESG credentials in public tenders and large enterprise procurements for medical, industrial, and hydrogen storage cylinders.
Feb 2025 – Hexagon Purus: Renewed a multi-year supply agreement (through 2028) with a leading European bus OEM for hydrogen fuel storage systems (Type IV); deal value undisclosed (industry estimates: USD 25–40 million over the term, depending on fleet awards). The extension secures backlog in zero-emission transit and reinforces Hexagon Purus’ leadership in high-pressure on-vehicle storage.
Mar 2025 – Worthington Enterprises (Ragasco): Rebranded the Viking Cylinders portfolio to Ragasco across North America, aligning the acquired Norwegian composite LPG leader with its regional go-to-market. The unified brand accelerates composite cylinder adoption and strengthens pricing power and channel leverage in the propane value chain.
Jun 2025 – Luxfer Gas Cylinders: Launched Luxfer Care, a Europe-wide aftercare and technical support program for hydrogen and CNG systems, already assisting ~25 operators across bus, rail, marine and industrial projects. The service layer creates sticky, recurring revenues while de-risking deployments with on-site diagnostics, warranty management, and spares. (
Jun 2025 – Worthington Enterprises (Ragasco): Announced a 5% list-price increase on Ragasco composite cylinders for the North American market, effective July 15, 2025 (or as contracts allow). The move protects margins amid input-cost volatility and tests elasticity as composite penetration rises in residential and commercial propane segments.
Jul 2025 – Supreme Industries: Secured a Letter of Acceptance for 200,000 10-kg composite LPG cylinders from BPCL and a repeat order for 231,000 cylinders from IOCL; management guided to >INR 1,000 crore FY26 revenue with improved capacity utilization. The wins position Supreme as a scale challenger in India’s fast-growing composite LPG category.
Sep 2025 – Luxfer Gas Cylinders: Partnered with Reynolds Logistics to deploy 40-ft G-Stor® Hydrosphere MEGCs for the UK’s first dedicated HyHaul hydrogen mobility corridor (M4). This strengthens Luxfer’s role in hydrogen logistics and underpins corridor economics with high-capacity mobile storage.