Gas Turbine MRO Market 2024–2034 | Growth Outlook & 6.1% CAGR
Global Gas Turbine MRO Market Size, Share & Analysis By Gas Turbine Type (Aero-Derivative Gas Turbines, Heavy-Duty Gas Turbines), By Service Type (Maintenance, Repair, Overhaul), By Application (Power Generation, Aviation), By End-User Industry Outlook, Digital Diagnostics Trends & Forecast 2025–2034
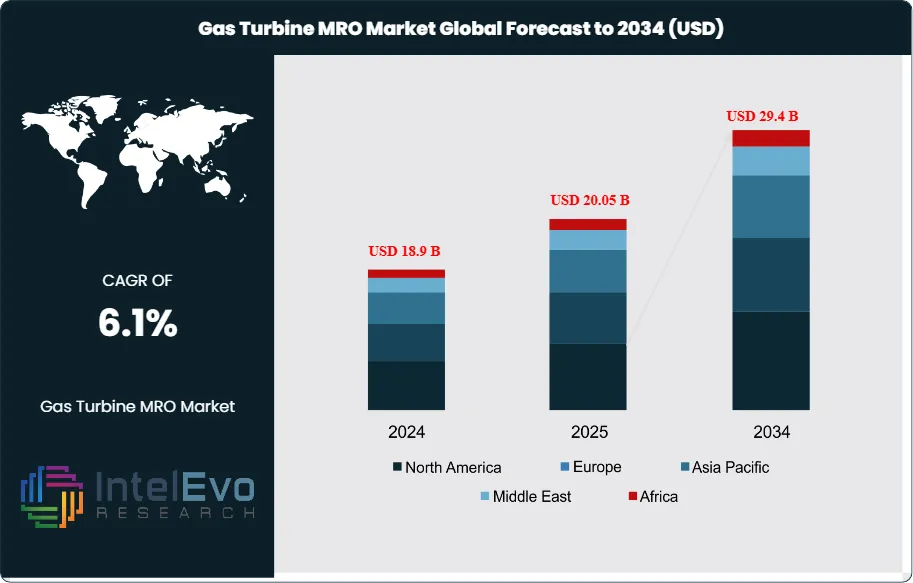
The Gas Turbine MRO Market is valued at approximately USD 18.9 billion in 2024 and is projected to reach nearly USD 29.4 billion by 2034, reflecting a steady CAGR of about 6.1% over 2025–2034. This growth is supported by surging demand for reliability-centered maintenance, rising refurbishment cycles for aging turbine fleets, and accelerated adoption of predictive analytics in power generation. As global energy systems transition toward hybrid and flexible generation models, MRO providers with digital, fast-response capabilities are expected to capture significant competitive advantage across industrial and utility sectors.
The market has moved from routine overhaul work toward integrated lifecycle services by 2025. Operators now prioritize digital inspection, condition-based maintenance, and parts remanufacture to preserve asset value as thermal fleets age. Demand for MRO rises where plants remain central to grid stability; gas turbines still provide flexible capacity as renewable penetration grows. Solar capacity recorded a 43% increase in 2023 and wind capacity has been expanding at roughly 5% annually into 2025; these shifts change utilization patterns but maintain steady demand for fast-start, well-maintained gas units that balance intermittent supply.
You should expect three revenue streams to dominate the market. First, scheduled inspections and hot-gas-path repairs will continue to represent the bulk of spend because they directly extend run hours and reliability. Second, retrofits and efficiency upgrades will capture more budget as operators seek to cut heat rates and emissions; regulatory pressure and carbon pricing in key markets are driving higher uptake of turbine uprates and combustion optimization. Third, services tied to digitalization will grow fastest; remote monitoring contracts, predictive analytics subscriptions, and digital-twin deployments now account for an increasing share of multi-year service agreements. The sector faces clear constraints. Regulatory tightening on emissions raises compliance costs for MRO providers and can shorten asset life economics in some regions; supply-chain bottlenecks for critical forgings and specialized turbine alloys create lead times that can exceed 24 weeks for major components; and energy-intensive testing and overhaul operations draw scrutiny for their operational carbon footprints.
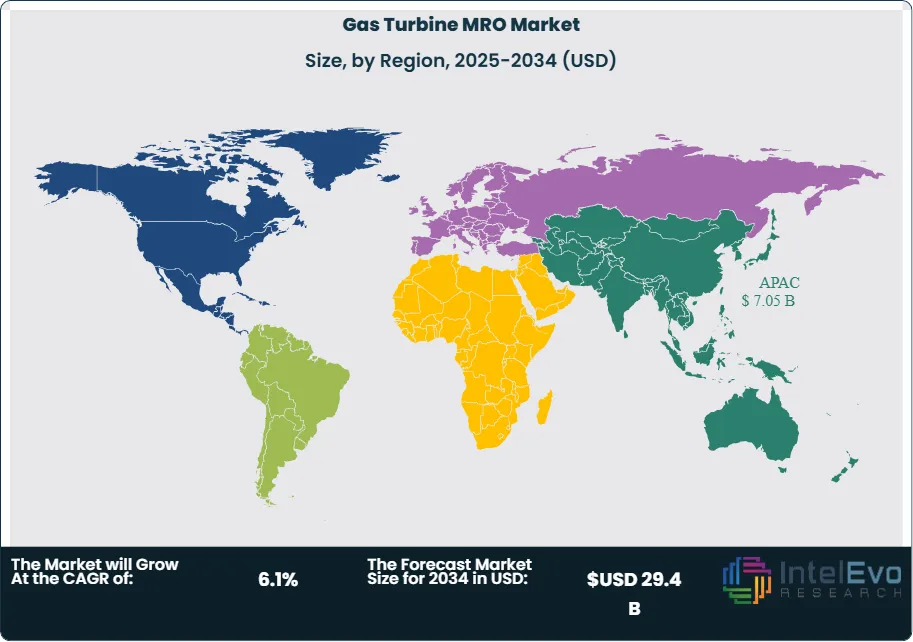
Technological advances shape competitive positioning. You will see more vendors offering bundled hardware, software, and financing to accelerate sales; model-based diagnostics and AI-driven anomaly detection reduce unplanned downtime by improving root-cause identification. Regionally, North America and the Middle East remain investment hotspots due to large installed bases and replacement cycles; Asia Pacific shows the fastest service growth as new combined-cycle capacity and industrial demand expand. For strategic investors, opportunities exist in aftermarket parts remanufacturing, cloud-based service platforms, and retrofit solutions that improve fuel flexibility and reduce emissions; these areas will capture the majority of MRO spend through 2034
Key Takeaways
Market Growth: The Global Gas Turbine MRO market was USD 18.9 billion in 2024 and is projected at USD 29.4 billion by 2034, reflecting a 6.1% CAGR; growth is driven by lifecycle extensions, retrofit spending, and steady demand for flexible generation as renewables expand.
By Turbine Type:Heavy-duty turbines lead with 58.4% market share in 2023; their prevalence in baseload and combined-cycle plants drives higher overhaul frequency and larger-value repair contracts.
By Service Type:Maintenance services account for 48.3% of market activity; routine inspections and hot-gas-path repairs form the largest recurring revenue stream and attract multi-year service agreements.
Driver: Aging fleets and shifting dispatch patterns increase MRO demand; as renewable capacity rises and gas units operate in flexible modes, operators allocate more to retrofits and uprates, supporting a measurable uplift in mid-life refurbishment spending.
Restraint: Supply-chain and compliance pressures constrain growth; lead times for critical forgings and turbine alloys can exceed 24 weeks, and tightening emissions rules add measurable compliance costs that compress margins on some overhaul contracts.
Opportunity: Digital services and parts remanufacturing present high-growth upside; remote monitoring, predictive analytics, and digital-twin offerings could expand at an estimated mid-single-digit to low-double-digit CAGR through 2033 and capture outsized aftermarket share.
Trend: Providers bundle hardware, software, and financing to win deals; OEMs have increased service offerings and warranty-linked upgrades, while AI-based diagnostics are reducing unplanned downtime by notable margins, improving asset availability and contract value.
Regional Analysis: Asia Pacific leads with 37.3% share, valued at about USD 5.5 billion in 2023 and showing the fastest service growth; North America remains a deep aftermarket market driven by large installed capacity and replacement cycles; the Middle East posts high per-unit spend due to oil and gas demand, while Europe focuses on emissions-driven retrofits and longer procurement cycles.
Type Analysis
Heavy-duty gas turbines command the largest share of MRO activity. They represented 58.4% of the market in the latest measure; their prevalence in combined-cycle and baseload plants makes them the primary source of large-value overhauls and parts demand. You will find the largest single-component expenditures tied to hot-gas-path repairs and major rotor work on these machines. Expect heavy-duty units to continue driving aftermarket revenue as operators pursue uprates and emissions retrofits; regulatory pressure and carbon pricing in some markets make efficiency upgrades commercially attractive. Aero-derivative units account for the remainder of type demand and play a critical role in peaking, marine, and fast-response applications where rapid start capability and lower mass matter. Their MRO cycles are shorter but more frequent, creating steady service opportunity in niche segments such as offshore platforms and fast-deployment power systems.
Service Analysis
Maintenance leads service mix and cash flow. Routine inspections, condition-based servicing, and planned maintenance captured roughly 48.3% of spend; these activities generate recurring revenue and support multi-year service contracts. You should treat maintenance as the foundation of aftermarket business models because it stabilizes utilization and enables upsell of analytics and parts. Repair and overhaul work provide episodic but high-ticket revenue. Repairs address component failures and typically support near-term availability, while overhauls restore life and output and command the largest single-job values. Providers that combine predictable maintenance contracts with capacity for major overhauls will win larger share and improve margin capture over typical spot-service players.
Provider Analysis
OEMs hold a majority position with about 54.4% market share; their proprietary parts, certified procedures, and warranty-linked offerings give them a pricing edge on high-complexity work. You should expect OEMs to maintain leadership in large overhauls and performance upgrades where certification and parts traceability matter most. Independent service providers compete on cost and multi-brand flexibility. ISPs win retrofit work and rapid-response contracts where you need cross-platform capability; in-house teams remain common among large utilities that prioritize control and schedule alignment. The competitive mix between OEM, ISP, and in-house models will vary by region and asset ownership structure.
End-Use Analysis
Power utilities are the dominant end market, accounting for about 52.4% of MRO demand; combined-cycle plants and peaking units drive the bulk of recurring work. You should expect utility procurement to favor long-term service agreements that bundle predictive maintenance, spare parts, and performance guarantees. Oil and gas, manufacturing, and aviation present complementary demand streams. Oil and gas uses turbines for compression and offshore power and requires robust corrosion- and vibration-focused services. Manufacturing relies on CHP installations and steady uptime. Aviation and other specialty sectors demand the highest safety and traceability standards, which supports premium-priced MRO offerings.
Regional Analysis
Asia Pacific leads in market share and growth, holding approximately 37.3% of the market and around USD 5.5 billion in regional value; rapid capacity additions and industrial expansion underpin that position. You should watch China, India, and Southeast Asia for sustained service volume and local ISP growth. North America remains a deep aftermarket with an aging fleet and high per-unit spend; Europe focuses on retrofit and emissions-compliance work driven by stricter regulations. The Middle East commands high per-unit expenditures tied to oil and gas projects. Latin America shows gradual modernization demand and selective investment opportunities for parts remanufacturing and mobile service teams.
By Gas Turbine Type (Aero-Derivative Gas Turbines, Heavy-Duty Gas Turbines), By Service Type (Maintenance, Repair, Overhaul), By Provider Type (OEM, Independent Service Providers, In-house), By End-Use (Power Utilities, Oil & Gas, Manufacturing, Aviation, Others)
Research Methodology
Primary Research- 100 Interviews of Stakeholders
Secondary Research
Desk Research
Regional scope
North America (United States, Canada, Mexico)
Latin America (Brazil, Argentina, Columbia)
East Asia And Pacific (China, Japan, South Korea, Australia, Cambodia, Fiji, Indonesia)
Sea And South Asia (India, Singapore, Thailand, Taiwan, Malaysia)
Eastern Europe (Poland, Russia, Czech Republic, Romania)
Western Europe (Germany, U.K., France, Spain, Itlay)
Middle East & Africa (GCC Countries, Egypt, Nigeria, South Africa, Israel)
Competitive Landscape
Sulzer Ltd, Doosan Heavy Industries and Construction, Ebara Corporation, Ansaldo Energia S.p.A., Metalock Engineering Group, Mitsubishi Heavy Industries Ltd, Caterpillar Inc., Siemens Energy AG, General Electric Company, Solar Turbines Incorporated, Ethos Energy LLC, Kawasaki Heavy Industries, Ltd., Goltens Worldwide Management Corporation
Customization Scope
Customization for segments, region/country-level will be provided. Moreover, additional customization can be done based on the requirements.
Pricing and Purchase Options
Avail customized purchase options to meet your exact research needs. We have three licenses to opt for: Single User License, Multi-User License (Up to 5 Users), Corporate Use License (Unlimited User and Printable PDF).
TABLE OF CONTENTS
1. EXECUTIVE SUMMARY
1.1. MARKET SNAPSHOT
1.2. KEY FINDINGS & INSIGHTS
1.3. ANALYST RECOMMENDATIONS
1.4. FUTURE OUTLOOK
2. RESEARCH METHODOLOGY
2.1. MARKET DEFINITION & SCOPE
2.2. RESEARCH OBJECTIVES: PRIMARY & SECONDARY DATA SOURCES
2.3. DATA COLLECTION SOURCES
2.3.1. COVERAGE OF 100+ PRIMARY RESEARCH/CONSULTATION CALLS WITH INDUSTRY STAKEHOLDERS
FIGURE 17 NORTH AMERICA GAS TURBINE MRO CURRENT AND FUTURE TYPE ANALYSIS, 2025–2034, (USD MILLION)
FIGURE 18 NORTH AMERICA GAS TURBINE MRO CURRENT AND FUTURE END USER ANALYSIS, 2025–2034, (USD MILLION)
FIGURE 19 MARKET SHARE BY COUNTRY
FIGURE 20 LATIN AMERICA GAS TURBINE MRO CURRENT AND FUTURE TYPE ANALYSIS, 2025–2034, (USD MILLION)
FIGURE 21 LATIN AMERICA GAS TURBINE MRO CURRENT AND FUTURE END USER ANALYSIS, 2025–2034, (USD MILLION)
FIGURE 22 MARKET SHARE BY COUNTRY
FIGURE 23 EASTERN EUROPE GAS TURBINE MRO CURRENT AND FUTURE TYPE ANALYSIS, 2025–2034, (USD MILLION)
FIGURE 24 EASTERN EUROPE GAS TURBINE MRO CURRENT AND FUTURE END USER ANALYSIS, 2025–2034, (USD MILLION)
FIGURE 25 MARKET SHARE BY COUNTRY
FIGURE 26 WESTERN EUROPE GAS TURBINE MRO CURRENT AND FUTURE TYPE ANALYSIS, 2025–2034, (USD MILLION)
FIGURE 27 WESTERN EUROPE GAS TURBINE MRO CURRENT AND FUTURE END USER ANALYSIS, 2025–2034, (USD MILLION)
FIGURE 28 MARKET SHARE BY COUNTRY
FIGURE 29 EAST ASIA AND PACIFIC GAS TURBINE MRO CURRENT AND FUTURE TYPE ANALYSIS, 2025–2034, (USD MILLION)
FIGURE 30 EAST ASIA AND PACIFIC GAS TURBINE MRO CURRENT AND FUTURE END USER ANALYSIS, 2025–2034, (USD MILLION)
FIGURE 31 MARKET SHARE BY COUNTRY
FIGURE 32 SEA AND SOUTH ASIA GAS TURBINE MRO CURRENT AND FUTURE TYPE ANALYSIS, 2025–2034, (USD MILLION)
FIGURE 33 SEA AND SOUTH ASIA GAS TURBINE MRO CURRENT AND FUTURE END USER ANALYSIS, 2025–2034, (USD MILLION)
FIGURE 34 MARKET SHARE BY COUNTRY
FIGURE 35 MIDDLE EAST AND AFRICA GAS TURBINE MRO CURRENT AND FUTURE TYPE ANALYSIS, 2025–2034, (USD MILLION)
FIGURE 36 MIDDLE EAST AND AFRICA GAS TURBINE MRO CURRENT AND FUTURE END USER ANALYSIS, 2025–2034, (USD MILLION)
FIGURE 37 NORTH AMERICA GAS TURBINE MRO CURRENT AND FUTURE MARKET VOLUME SHARE REGIONAL ANALYSIS, 2025–2034, (USD MILLION)
FIGURE 38 U.S. GAS TURBINE MRO CURRENT AND FUTURE TYPE ANALYSIS, 2025–2034, (USD MILLION)
FIGURE 39 U.S. GAS TURBINE MRO CURRENT AND FUTURE END USER ANALYSIS, 2025–2034, (USD MILLION)
FIGURE 40 CANADA GAS TURBINE MRO CURRENT AND FUTURE TYPE ANALYSIS, 2025–2034, (USD MILLION)
FIGURE 41 CANADA GAS TURBINE MRO CURRENT AND FUTURE END USER ANALYSIS, 2025–2034, (USD MILLION)
FIGURE 42 LATIN AMERICA GAS TURBINE MRO CURRENT AND FUTURE MARKET VOLUME SHARE REGIONAL ANALYSIS, 2025–2034, (USD MILLION)
FIGURE 43 MEXICO GAS TURBINE MRO CURRENT AND FUTURE TYPE ANALYSIS, 2025–2034, (USD MILLION)
FIGURE 44 MEXICO GAS TURBINE MRO CURRENT AND FUTURE END USER ANALYSIS, 2025–2034, (USD MILLION)
FIGURE 45 BRAZIL GAS TURBINE MRO CURRENT AND FUTURE TYPE ANALYSIS, 2025–2034, (USD MILLION)
FIGURE 46 BRAZIL GAS TURBINE MRO CURRENT AND FUTURE END USER ANALYSIS, 2025–2034, (USD MILLION)
FIGURE 47 ARGENTINA GAS TURBINE MRO CURRENT AND FUTURE TYPE ANALYSIS, 2025–2034, (USD MILLION)
FIGURE 48 ARGENTINA GAS TURBINE MRO CURRENT AND FUTURE END USER ANALYSIS, 2025–2034, (USD MILLION)
FIGURE 49 COLUMBIA GAS TURBINE MRO CURRENT AND FUTURE TYPE ANALYSIS, 2025–2034, (USD MILLION)
FIGURE 50 COLUMBIA GAS TURBINE MRO CURRENT AND FUTURE END USER ANALYSIS, 2025–2034, (USD MILLION)
FIGURE 51 REST OF LATIN AMERICA GAS TURBINE MRO CURRENT AND FUTURE TYPE ANALYSIS, 2025–2034, (USD MILLION)
FIGURE 52 REST OF LATIN AMERICA GAS TURBINE MRO CURRENT AND FUTURE END USER ANALYSIS, 2025–2034, (USD MILLION)
FIGURE 53 EASTERN EUROPE GAS TURBINE MRO CURRENT AND FUTURE MARKET VOLUME SHARE REGIONAL ANALYSIS, 2025–2034, (USD MILLION)
FIGURE 54 POLAND GAS TURBINE MRO CURRENT AND FUTURE TYPE ANALYSIS, 2025–2034, (USD MILLION)
FIGURE 55 POLAND GAS TURBINE MRO CURRENT AND FUTURE END USER ANALYSIS, 2025–2034, (USD MILLION)
FIGURE 56 RUSSIA GAS TURBINE MRO CURRENT AND FUTURE TYPE ANALYSIS, 2025–2034, (USD MILLION)
FIGURE 57 RUSSIA GAS TURBINE MRO CURRENT AND FUTURE END USER ANALYSIS, 2025–2034, (USD MILLION)
FIGURE 58 CZECH REPUBLIC GAS TURBINE MRO CURRENT AND FUTURE TYPE ANALYSIS, 2025–2034, (USD MILLION)
FIGURE 59 CZECH REPUBLIC GAS TURBINE MRO CURRENT AND FUTURE END USER ANALYSIS, 2025–2034, (USD MILLION)
FIGURE 60 ROMANIA GAS TURBINE MRO CURRENT AND FUTURE TYPE ANALYSIS, 2025–2034, (USD MILLION)
FIGURE 61 ROMANIA GAS TURBINE MRO CURRENT AND FUTURE END USER ANALYSIS, 2025–2034, (USD MILLION)
FIGURE 62 REST OF EASTERN EUROPE GAS TURBINE MRO CURRENT AND FUTURE TYPE ANALYSIS, 2025–2034, (USD MILLION)
FIGURE 63 REST OF EASTERN EUROPE GAS TURBINE MRO CURRENT AND FUTURE END USER ANALYSIS, 2025–2034, (USD MILLION)
FIGURE 64 WESTERN EUROPE GAS TURBINE MRO CURRENT AND FUTURE MARKET VOLUME SHARE REGIONAL ANALYSIS, 2025–2034, (USD MILLION)
FIGURE 65 GERMANY GAS TURBINE MRO CURRENT AND FUTURE TYPE ANALYSIS, 2025–2034, (USD MILLION)
FIGURE 66 GERMANY GAS TURBINE MRO CURRENT AND FUTURE END USER ANALYSIS, 2025–2034, (USD MILLION)
FIGURE 67 FRANCE GAS TURBINE MRO CURRENT AND FUTURE TYPE ANALYSIS, 2025–2034, (USD MILLION)
FIGURE 68 FRANCE GAS TURBINE MRO CURRENT AND FUTURE END USER ANALYSIS, 2025–2034, (USD MILLION)
FIGURE 69 UK GAS TURBINE MRO CURRENT AND FUTURE TYPE ANALYSIS, 2025–2034, (USD MILLION)
FIGURE 70 UK GAS TURBINE MRO CURRENT AND FUTURE END USER ANALYSIS, 2025–2034, (USD MILLION)
FIGURE 71 SPAIN GAS TURBINE MRO CURRENT AND FUTURE TYPE ANALYSIS, 2025–2034, (USD MILLION)
FIGURE 72 SPAIN GAS TURBINE MRO CURRENT AND FUTURE END USER ANALYSIS, 2025–2034, (USD MILLION)
FIGURE 73 ITALY GAS TURBINE MRO CURRENT AND FUTURE TYPE ANALYSIS, 2025–2034, (USD MILLION)
FIGURE 74 ITALY GAS TURBINE MRO CURRENT AND FUTURE END USER ANALYSIS, 2025–2034, (USD MILLION)
FIGURE 75 REST OF WESTERN EUROPE GAS TURBINE MRO CURRENT AND FUTURE TYPE ANALYSIS, 2025–2034, (USD MILLION)
FIGURE 76 REST OF WESTERN EUROPE GAS TURBINE MRO CURRENT AND FUTURE END USER ANALYSIS, 2025–2034, (USD MILLION)
FIGURE 77 EAST ASIA AND PACIFIC GAS TURBINE MRO CURRENT AND FUTURE MARKET VOLUME SHARE REGIONAL ANALYSIS, 2025–2034, (USD MILLION)
FIGURE 78 CHINA GAS TURBINE MRO CURRENT AND FUTURE TYPE ANALYSIS, 2025–2034, (USD MILLION)
FIGURE 79 CHINA GAS TURBINE MRO CURRENT AND FUTURE END USER ANALYSIS, 2025–2034, (USD MILLION)
FIGURE 80 JAPAN GAS TURBINE MRO CURRENT AND FUTURE TYPE ANALYSIS, 2025–2034, (USD MILLION)
FIGURE 81 JAPAN GAS TURBINE MRO CURRENT AND FUTURE END USER ANALYSIS, 2025–2034, (USD MILLION)
FIGURE 82 AUSTRALIA GAS TURBINE MRO CURRENT AND FUTURE TYPE ANALYSIS, 2025–2034, (USD MILLION)
FIGURE 83 AUSTRALIA GAS TURBINE MRO CURRENT AND FUTURE END USER ANALYSIS, 2025–2034, (USD MILLION)
FIGURE 84 CAMBODIA GAS TURBINE MRO CURRENT AND FUTURE TYPE ANALYSIS, 2025–2034, (USD MILLION)
FIGURE 85 CAMBODIA GAS TURBINE MRO CURRENT AND FUTURE END USER ANALYSIS, 2025–2034, (USD MILLION)
FIGURE 86 FIJI GAS TURBINE MRO CURRENT AND FUTURE TYPE ANALYSIS, 2025–2034, (USD MILLION)
FIGURE 87 FIJI GAS TURBINE MRO CURRENT AND FUTURE END USER ANALYSIS, 2025–2034, (USD MILLION)
FIGURE 88 INDONESIA GAS TURBINE MRO CURRENT AND FUTURE TYPE ANALYSIS, 2025–2034, (USD MILLION)
FIGURE 89 INDONESIA GAS TURBINE MRO CURRENT AND FUTURE END USER ANALYSIS, 2025–2034, (USD MILLION)
FIGURE 90 SOUTH KOREA GAS TURBINE MRO CURRENT AND FUTURE TYPE ANALYSIS, 2025–2034, (USD MILLION)
FIGURE 91 SOUTH KOREA GAS TURBINE MRO CURRENT AND FUTURE END USER ANALYSIS, 2025–2034, (USD MILLION)
FIGURE 92 REST OF EAST ASIA AND PACIFIC GAS TURBINE MRO CURRENT AND FUTURE TYPE ANALYSIS, 2025–2034, (USD MILLION)
FIGURE 93 REST OF EAST ASIA AND PACIFIC GAS TURBINE MRO CURRENT AND FUTURE END USER ANALYSIS, 2025–2034, (USD MILLION)
FIGURE 94 SEA AND SOUTH ASIA GAS TURBINE MRO CURRENT AND FUTURE MARKET VOLUME SHARE REGIONAL ANALYSIS, 2025–2034, (USD MILLION)
FIGURE 95 BANGLADESH GAS TURBINE MRO CURRENT AND FUTURE TYPE ANALYSIS, 2025–2034, (USD MILLION)
FIGURE 96 BANGLADESH GAS TURBINE MRO CURRENT AND FUTURE END USER ANALYSIS, 2025–2034, (USD MILLION)
FIGURE 97 NEW ZEALAND GAS TURBINE MRO CURRENT AND FUTURE TYPE ANALYSIS, 2025–2034, (USD MILLION)
FIGURE 98 NEW ZEALAND GAS TURBINE MRO CURRENT AND FUTURE END USER ANALYSIS, 2025–2034, (USD MILLION)
FIGURE 99 INDIA GAS TURBINE MRO CURRENT AND FUTURE TYPE ANALYSIS, 2025–2034, (USD MILLION)
FIGURE 100 INDIA GAS TURBINE MRO CURRENT AND FUTURE END USER ANALYSIS, 2025–2034, (USD MILLION)
FIGURE 101 SINGAPORE GAS TURBINE MRO CURRENT AND FUTURE TYPE ANALYSIS, 2025–2034, (USD MILLION)
FIGURE 102 SINGAPORE GAS TURBINE MRO CURRENT AND FUTURE END USER ANALYSIS, 2025–2034, (USD MILLION)
FIGURE 103 THAILAND GAS TURBINE MRO CURRENT AND FUTURE TYPE ANALYSIS, 2025–2034, (USD MILLION)
FIGURE 104 THAILAND GAS TURBINE MRO CURRENT AND FUTURE END USER ANALYSIS, 2025–2034, (USD MILLION)
FIGURE 105 TAIWAN GAS TURBINE MRO CURRENT AND FUTURE TYPE ANALYSIS, 2025–2034, (USD MILLION)
FIGURE 106 TAIWAN GAS TURBINE MRO CURRENT AND FUTURE END USER ANALYSIS, 2025–2034, (USD MILLION)
FIGURE 107 MALAYSIA GAS TURBINE MRO CURRENT AND FUTURE TYPE ANALYSIS, 2025–2034, (USD MILLION)
FIGURE 108 MALAYSIA GAS TURBINE MRO CURRENT AND FUTURE END USER ANALYSIS, 2025–2034, (USD MILLION)
FIGURE 109 REST OF SEA AND SOUTH ASIA GAS TURBINE MRO CURRENT AND FUTURE TYPE ANALYSIS, 2025–2034, (USD MILLION)
FIGURE 110 REST OF SEA AND SOUTH ASIA GAS TURBINE MRO CURRENT AND FUTURE END USER ANALYSIS, 2025–2034, (USD MILLION)
FIGURE 111 MIDDLE EAST AND AFRICA GAS TURBINE MRO CURRENT AND FUTURE MARKET VOLUME SHARE REGIONAL ANALYSIS, 2025–2034, (USD MILLION)
FIGURE 112 GCC COUNTRIES GAS TURBINE MRO CURRENT AND FUTURE TYPE ANALYSIS, 2025–2034, (USD MILLION)
FIGURE 113 GCC COUNTRIES GAS TURBINE MRO CURRENT AND FUTURE END USER ANALYSIS, 2025–2034, (USD MILLION)
FIGURE 114 SAUDI ARABIA GAS TURBINE MRO CURRENT AND FUTURE TYPE ANALYSIS, 2025–2034, (USD MILLION)
FIGURE 115 SAUDI ARABIA GAS TURBINE MRO CURRENT AND FUTURE END USER ANALYSIS, 2025–2034, (USD MILLION)
FIGURE 116 UAE GAS TURBINE MRO CURRENT AND FUTURE TYPE ANALYSIS, 2025–2034, (USD MILLION)
FIGURE 117 UAE GAS TURBINE MRO CURRENT AND FUTURE END USER ANALYSIS, 2025–2034, (USD MILLION)
FIGURE 118 BAHRAIN GAS TURBINE MRO CURRENT AND FUTURE TYPE ANALYSIS, 2025–2034, (USD MILLION)
FIGURE 119 BAHRAIN GAS TURBINE MRO CURRENT AND FUTURE END USER ANALYSIS, 2025–2034, (USD MILLION)
FIGURE 120 KUWAIT GAS TURBINE MRO CURRENT AND FUTURE TYPE ANALYSIS, 2025–2034, (USD MILLION)
FIGURE 121 KUWAIT GAS TURBINE MRO CURRENT AND FUTURE END USER ANALYSIS, 2025–2034, (USD MILLION)
FIGURE 122 OMAN GAS TURBINE MRO CURRENT AND FUTURE TYPE ANALYSIS, 2025–2034, (USD MILLION)
FIGURE 123 OMAN GAS TURBINE MRO CURRENT AND FUTURE END USER ANALYSIS, 2025–2034, (USD MILLION)
FIGURE 124 QATAR GAS TURBINE MRO CURRENT AND FUTURE TYPE ANALYSIS, 2025–2034, (USD MILLION)
FIGURE 125 QATAR GAS TURBINE MRO CURRENT AND FUTURE END USER ANALYSIS, 2025–2034, (USD MILLION)
FIGURE 126 EGYPT GAS TURBINE MRO CURRENT AND FUTURE TYPE ANALYSIS, 2025–2034, (USD MILLION)
FIGURE 127 EGYPT GAS TURBINE MRO CURRENT AND FUTURE END USER ANALYSIS, 2025–2034, (USD MILLION)
FIGURE 128 NIGERIA GAS TURBINE MRO CURRENT AND FUTURE TYPE ANALYSIS, 2025–2034, (USD MILLION)
FIGURE 129 NIGERIA GAS TURBINE MRO CURRENT AND FUTURE END USER ANALYSIS, 2025–2034, (USD MILLION)
FIGURE 130 SOUTH AFRICA GAS TURBINE MRO CURRENT AND FUTURE TYPE ANALYSIS, 2025–2034, (USD MILLION)
FIGURE 131 SOUTH AFRICA GAS TURBINE MRO CURRENT AND FUTURE END USER ANALYSIS, 2025–2034, (USD MILLION)
FIGURE 132 ISRAEL GAS TURBINE MRO CURRENT AND FUTURE TYPE ANALYSIS, 2025–2034, (USD MILLION)
FIGURE 133 ISRAEL GAS TURBINE MRO CURRENT AND FUTURE END USER ANALYSIS, 2025–2034, (USD MILLION)
FIGURE 134 REST OF MEA GAS TURBINE MRO CURRENT AND FUTURE TYPE ANALYSIS, 2025–2034, (USD MILLION)
FIGURE 135 REST OF MEA GAS TURBINE MRO CURRENT AND FUTURE END USER ANALYSIS, 2025–2034, (USD MILLION)
FIGURE 136 U. S. MARKET SHARE ANALYSIS BY TYPE (2024)
FIGURE 137 U. S. MARKET SHARE ANALYSIS BY END USER (2024)
FIGURE 138 CANADA MARKET SHARE ANALYSIS BY TYPE (2024)
FIGURE 139 CANADA MARKET SHARE ANALYSIS BY END USER (2024)
FIGURE 140 MEXICO MARKET SHARE ANALYSIS BY TYPE (2024)
FIGURE 141 MEXICO MARKET SHARE ANALYSIS BY END USER (2024)
FIGURE 142 CHINA MARKET SHARE ANALYSIS BY TYPE (2024)
FIGURE 143 CHINA MARKET SHARE ANALYSIS BY END USER (2024)
FIGURE 144 JAPAN MARKET SHARE ANALYSIS BY TYPE (2024)
FIGURE 145 JAPAN MARKET SHARE ANALYSIS BY END USER (2024)
FIGURE 146 INDIA MARKET SHARE ANALYSIS BY TYPE (2024)
FIGURE 147 INDIA MARKET SHARE ANALYSIS BY END USER (2024)
FIGURE 148 SOUTH KOREA MARKET SHARE ANALYSIS BY TYPE (2024)
FIGURE 149 SOUTH KOREA MARKET SHARE ANALYSIS BY END USER (2024)
FIGURE 150 SAUDI ARABIA MARKET SHARE ANALYSIS BY TYPE (2024)
FIGURE 151 SAUDI ARABIA MARKET SHARE ANALYSIS BY END USER (2024)
FIGURE 152 UAE MARKET SHARE ANALYSIS BY TYPE (2024)
FIGURE 153 UAE MARKET SHARE ANALYSIS BY END USER (2024)
FIGURE 154 EGYPT MARKET SHARE ANALYSIS BY TYPE (2024)
FIGURE 155 EGYPT MARKET SHARE ANALYSIS BY END USER (2024)
FIGURE 156 NIGERIA MARKET SHARE ANALYSIS BY TYPE (2024)
FIGURE 157 NIGERIA MARKET SHARE ANALYSIS BY END USER (2024)
FIGURE 158 SOUTH AFRICA MARKET SHARE ANALYSIS BY TYPE (2024)
FIGURE 159 SOUTH AFRICA MARKET SHARE ANALYSIS BY END USER (2024)
FIGURE 160 GERMANY MARKET SHARE ANALYSIS BY TYPE (2024)
FIGURE 161 GERMANY MARKET SHARE ANALYSIS BY END USER (2024)
FIGURE 162 FRANCE MARKET SHARE ANALYSIS BY TYPE (2024)
FIGURE 163 FRANCE MARKET SHARE ANALYSIS BY END USER (2024)
FIGURE 164 UK MARKET SHARE ANALYSIS BY TYPE (2024)
FIGURE 165 UK MARKET SHARE ANALYSIS BY END USER (2024)
FIGURE 166 SPAIN MARKET SHARE ANALYSIS BY TYPE (2024)
FIGURE 167 SPAIN MARKET SHARE ANALYSIS BY END USER (2024)
FIGURE 168 ITALY MARKET SHARE ANALYSIS BY TYPE (2024)
FIGURE 169 ITALY MARKET SHARE ANALYSIS BY END USER (2024)
FIGURE 170 BRAZIL MARKET SHARE ANALYSIS BY TYPE (2024)
FIGURE 171 BRAZIL MARKET SHARE ANALYSIS BY END USER (2024)
FIGURE 172 ARGENTINA MARKET SHARE ANALYSIS BY TYPE (2024)
FIGURE 173 ARGENTINA MARKET SHARE ANALYSIS BY END USER (2024)
FIGURE 174 COLUMBIA MARKET SHARE ANALYSIS BY TYPE (2024)
FIGURE 175 COLUMBIA MARKET SHARE ANALYSIS BY END USER (2024)
FIGURE 176 GLOBAL GAS TURBINE MRO CURRENT AND FUTURE MARKET KEY COUNTRY LEVEL ANALYSIS, 2024–2034, (USD MILLION)
FIGURE 177 FINANCIAL OVERVIEW:
Key Player Analysis
General Electric Company: GE, through its energy business, holds a leader position in gas turbine MRO with a broad installed base across F- and H-class fleets and multi-year service agreements that anchor recurring revenue. Core offerings include long-term service agreements, hot-gas-path component refurbishment, advanced combustor upgrades, and fleetwide remote monitoring with analytics. In 2025 GE’s strategy centers on life-extension and efficiency packages that target heat-rate improvements and lower NOx, paired with digital diagnostics to reduce forced-outage rates. The company’s strength lies in OEM parts availability, certified repair routes, and global field teams that shorten outage windows. Expect GE to defend share in heavy-duty turbines, which represent 58.4% of the MRO opportunity, while using outcome-based contracts to lift margin per unit.
Siemens Energy AG: Siemens Energy is a leader with deep penetration in Europe and the Middle East and a growing digital services portfolio. The company’s Omnivise suite supports condition monitoring, anomaly detection, and outage planning, while OEM services cover major overhauls, rotor life assessments, and combustion tuning across SGT-class machines. In 2025 Siemens Energy emphasizes hydrogen-ready retrofits and emissions compliance work, aligned with tightening EU rules and utility decarbonization plans. The firm differentiates through integrated offerings that bundle controls upgrades, remote diagnostics, and warranty-linked maintenance, positioning it to capture maintenance spend, which accounts for roughly 48.3% of service mix, and to upsell retrofits in regions prioritizing lower CO₂ intensity.
Mitsubishi Heavy Industries Ltd: MHI stands as a challenger-leader hybrid with strong traction in Asia Pacific, the fastest-growing MRO region at ~37.3% share by recent measures. Its core MRO scope spans J-/G-series hot-section repairs, compressor and turbine module overhauls, and controls modernization, complemented by long-term service programs for utility customers. In 2025 MHI focuses on fuel-flexibility upgrades and hydrogen co-firing pathways, targeting customers seeking emissions reductions without full asset replacement. The differentiator is high-efficiency heavy-duty turbine know-how anchored by factory test facilities and regional service hubs, which reduce logistics time and help win contracts in combined-cycle plants undergoing uprates and lifetime extensions.
Sulzer Ltd: Sulzer is an independent service provider positioned as an innovator in component repair and life-extension solutions for multi-OEM fleets. The company’s offering includes hot-section coating, additive manufacturing for critical parts, advanced blade repair, and field services across aero-derivative and heavy-duty units. In 2025 Sulzer’s strategy targets customers seeking cost certainty outside OEM channels, using reverse-engineered parts, rapid-turnaround shops, and performance guarantees to compete on total cost of ownership. The firm benefits from procurement shifts toward dual-sourcing as operators manage high overhaul costs and supply-chain lead times that can exceed 20 weeks; this creates share-gain potential in repair and mid-scope projects while OEMs retain the largest overhauls.
Market Key Players
• Sulzer Ltd • Doosan Heavy Industries and Construction • Ebara Corporation • Ansaldo Energia S.p.A. • Metalock Engineering Group • Mitsubishi Heavy Industries Ltd • Caterpillar Inc. • Siemens Energy AG • General Electric Company • Solar Turbines Incorporated • Ethos Energy LLC • Kawasaki Heavy Industries, Ltd. • Goltens Worldwide Management Corporation
By 2025, gas turbine owners will focus sharply on gaining efficiency and controlling costs as renewable energy increases dispatch volatility in global power markets. The Gas Turbine MRO market was valued at USD 14.8 billion in 2023 and is expected to grow to USD 21.7 billion by 2033, which is a 3.9% CAGR. Maintenance services already make up 48.3% of total spending. Operators are increasing hot-gas-path interventions, combustor tuning, and modernizing controls to stay competitive. These upgrades can lead to significant performance improvements, such as 1–2% better heat rates and lower NOx emissions.
Predictive Maintenance Becomes Core to Risk and Margin Protection
Fleet operators are adopting predictive and condition-based maintenance programs to deal with dispatch variability and reduce forced outages. By using vibration analysis, remote monitoring, and unit-specific degradation models, asset owners can extend the life of parts and optimize overhaul cycles. This shift is vital for preserving profit margins, especially since mid-merit units face short-term fluctuations in capacity. Digital diagnostics support more stable performance and change MRO procurement to long-term strategies based on analytics.
Restraint
Reduced Baseload Operation Pressures MRO Cycles and Spending
Fewer baseload run hours are hindering short-term MRO growth, especially in markets with high renewable generation where gas turbine operating hours have dropped significantly. As units cycle more often and operate in mid-merit or peaking roles, operators are deferring noncritical work into longer cycles. This maintenance delay shifts spending from comprehensive overhauls to smaller, lower-value interventions, slowing the near-term growth of the global MRO market.
High Overhaul Costs and Long Lead Times Slow Full-Scope Commitments
Major overhauls are economically challenging, costing between USD 3–10 million per unit. Supply chain issues, particularly with forged components, are extending lead times to 20–24 weeks, complicating planning. This economic pressure is pushing buyers to opt for patch repairs, reduce the scope of work, and negotiate better terms such as financing options, parts pooling, and guarantees. Operators are unlikely to commit to full-scope work without risk-sharing strategies to ease financial burdens.
Opportunity
Digitalization Unlocks Performance Gains and New Revenue Streams
Digital retrofits are among the most scalable opportunities in the Gas Turbine MRO market. Remote diagnostics, AI-enabled anomaly detection, edge analytics, and digital twin technologies are being adopted quickly. Their penetration is expected to approach 50% of large units by 2025. These technologies provide clear improvements in availability, fuel usage, and emissions, speeding up the shift toward software-based maintenance models. The market is growing at mid- to high-single-digit rates, creating ongoing revenue opportunities for service providers that integrate technology.
Fuel Flexibility and Regional Capacity Additions Drive New Retrofit Pipelines
Hydrogen-ready combustors, low-NOx firing systems, and fuel-flexibility upgrades are emerging as key retrofit categories due to stricter emissions regulations. Regions like Asia Pacific, which holds about 37.3% of total MRO value, continue to add combined-cycle capacity, leading to multi-year upgrade pipelines and renewals of long-term service agreements (LTSAs). Providers that can combine OEM-grade parts, advanced analytics, and performance guarantees are likely to capture more revenue as operators modernize assets for the coming decade.
Trend
Shift Toward Outcome-Based Contracts and Software-Linked MRO Models
The Gas Turbine MRO industry is moving from traditional time-and-materials contracts to outcome-based service models. OEMs and independent service providers are connecting fees to measurable performance metrics such as availability, heat-rate stabilization, and emissions reduction. Model-based diagnostics included in these agreements show 5–8% improvements in asset availability, reinforcing confidence in data-driven service models and strengthening recurring revenue throughout the MRO value chain.
Integrated Lifecycle Approaches Align Cost, Compliance, and Performance
Operators are increasingly using lifecycle-based strategies that merge maintenance, repair, overhaul, and upgrade programs into one planning framework. This approach reduces total ownership costs, supports compliance with tighter emissions standards, and enables more predictable long-term budgets. Suppliers with global field service capabilities, certified repair shops, and scalable digital platforms are well positioned to benefit as buyers seek partners that can deliver verified performance improvements across the entire asset lifecycle.
Recent Developments
Dec 2024 – Siemens Energy: Reached a settlement with the U.S. Department of Justice valued at USD 104 million related to historical conduct on gas turbine bids. The resolution removes a legal overhang going into 2025 and allows management to focus on service growth and order execution.
Feb 2025 – Siemens Energy: Signed a contract to supply two gas turbines for Taiwan’s Kuo Kuang 2 combined-cycle plant, adding 1.2 GW of capacity to the island’s grid. The win expands Siemens Energy’s installed base in Taiwan and supports future aftermarket service opportunities tied to utilization and reliability needs.
Mar 2025 – Siemens Energy: Awarded a USD 1.6 billion package for two gas-fired power plants in Saudi Arabia that will add 3.6 GW; the scope includes long-term maintenance agreements extending up to 25 years. The deal secures multi-decade service revenue and deepens exposure to a high-spend MRO region.
Apr 2025 – GE Aerospace and MTU Maintenance: Executed a long-term agreement authorizing MTU Maintenance Dallas as a service provider for GEnx engines, with access to GE training and proprietary overhaul technologies. The partnership adds shop capacity for a fast-growing widebody fleet and broadens aftermarket choice for operators.
Jul 2025 – Sulzer: Reported a multi-year contract with Eskom to overhaul five open-cycle gas turbines in South Africa, to be delivered via local teams and Sulzer’s Netherlands center of excellence. The award strengthens Sulzer’s position as an independent service provider on critical infrastructure and diversifies its regional MRO backlog.
Sep 2025 – Mitsubishi Power: Announced major gas turbine supply awards in Asia, including a 2,800 MW GTCC project in Taiwan and two JAC units for Vietnam’s O Mon 4. These projects expand the installed base for future MRO work and position the company for long-term service contracts as the assets enter operation.

 Aerospace And Defence
 Agriculture
 Automotive And Transportation
 Banking And Finance
 Business
 Chemicals And Materials
 Consumer And Retail
 Electronics And Semiconductors
 Food And Beverages
 Machinery & Equipments
 Manufacturing And Construction
 Medical Devices
 Others
 Pharmaceuticals And Healthcare
 Power And Energy
 Sports
 Technology

, By Service Type (Maintenance, Repair, Overhaul), By Application (Power Generation, Aviation), By End-User Industry Outlook, Digital Diagnostics Trends & Forecast 2025–2034")
, By Service Type (Maintenance, Repair, Overhaul), By Application (Power Generation, Aviation), By End-User Industry Outlook, Digital Diagnostics Trends & Forecast 2025–2034")
, By Service Type (Maintenance, Repair, Overhaul), By Application (Power Generation, Aviation), By End-User Industry Outlook, Digital Diagnostics Trends & Forecast 2025–2034")
, By Service Type (Maintenance, Repair, Overhaul), By Application (Power Generation, Aviation), By End-User Industry Outlook, Digital Diagnostics Trends & Forecast 2025–2034")

