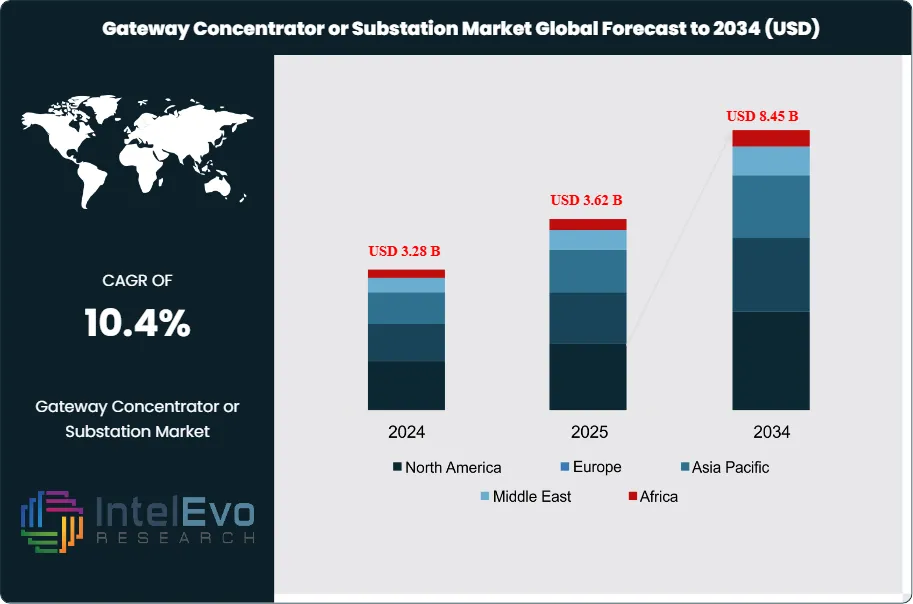
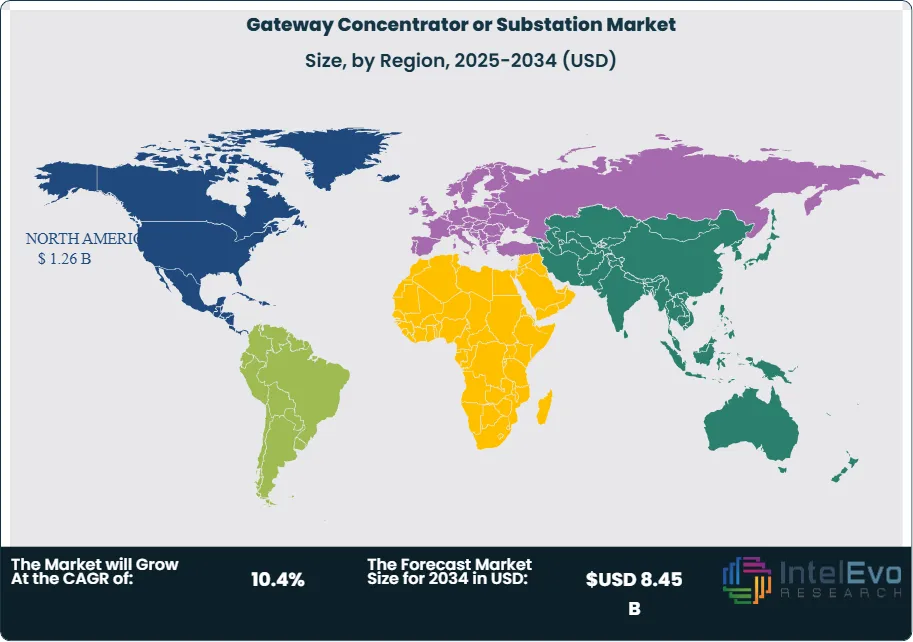
The Global Gateway Concentrator or Substation Market valued at around USD 3.28 billion in 2024, is expected to reach USD 8.45 billion by 2034, with a CAGR of 10.4% from 2025 to 2034. The market, is growing quickly due to a rising need for smarter, more reliable, and integrated power distribution systems. Gateway concentrators act as communication and data processing hubs in substations. They enable real-time monitoring, control, and automation of electrical power networks. These devices are crucial for Supervisory Control and Data Acquisition (SCADA) systems and facilitate real-time data exchange between substations and control centers.
This market features various products, including RTUs (Remote Terminal Units), Data Concentrator Units (DCUs), Protocol Gateways, and IED (Intelligent Electronic Device) Communication Hubs. Adoption of these products is on the rise, especially in transmission and distribution (T&D) modernization projects, smart grid infrastructure, and industrial substations. Updates to IEC standards, improvements in cybersecurity, and advances in edge computing are changing substation automation strategies and driving innovation.
During the forecast period from 2024 to 2034, we expect faster adoption of gateway concentrator and substation solutions. This growth will be driven by global efforts towards decarbonization, the increasing use of smart grid technologies, and the need for real-time data analytics to enhance grid performance and ensure energy security. The market is moving towards more digital, automated, and interconnected systems that incorporate new technologies like IoT, AI, and modern communication protocols.
COVID-19 Impact: The COVID-19 pandemic initially caused disruptions in the industrial substation market due to supply chain issues, labor shortages, and a temporary drop in electricity demand from industrial and commercial sectors. However, the crisis emphasized the need for infrastructure that is resilient and can be managed remotely. This led to increased investments in digitalization and automation in substations, speeding up the adoption of solutions that enable remote monitoring and control. While some projects were delayed, the long-term effect has been a stronger focus on grid modernization and digital transformation, which ultimately supports market growth.
Regional Conflicts and Trade Tensions: Regional conflicts and trade tensions can greatly affect the Global Gateway Concentrator and Substation Market. These geopolitical issues can disrupt global supply chains for essential components, such as semiconductors and specialized sensors, increase the costs of raw materials, and create uncertainty around investments. Export controls, sanctions, and protectionist measures may limit market access for certain technologies or companies, pushing businesses to diversify their supply chains and possibly encouraging regional self-sufficiency in manufacturing. On the other hand, increased defense spending in conflict-prone areas might raise demand for secure communication and control systems within critical infrastructure.
Key Takeaways
Market Growth: The Global Gateway Concentrator and Substation Market is poised for substantial growth, driven by grid modernization, renewable energy integration, and increasing demand for reliable power.
Product Type Dominance: Hardware components (e.g., transformers, switchgear, relays) are fundamental, but software and communication networks are increasingly critical for digital substations.
Technology/Component Dominance: Digital substation technologies, including substation automation systems and communication networks, are gaining prominence due to enhanced efficiency and reliability.
Application Dominance: Transmission and Distribution applications are the primary drivers, with a growing focus on integrating renewable energy sources.
End-User Dominance: Utilities remain the largest end-user, with increasing adoption in industrial sectors and data centers.
Driver: The increasing need for efficient and reliable power distribution, coupled with the integration of renewable energy sources, are key market drivers.
Restraint: High initial investment costs and the complexity of integrating new digital systems with legacy infrastructure pose significant restraints.
Opportunity: The development of advanced communication protocols (e.g., IEC 61850), integration with IoT/AI, and the expansion of smart grid initiatives present significant opportunities.
Trend: A prominent trend is the shift towards digital substations, emphasizing real-time data analytics, remote monitoring, and enhanced cybersecurity.
Regional Analysis: North America and Europe are leading the market in terms of adoption, while Asia-Pacific is expected to be the fastest-growing region due to rapid infrastructure development.
Product Type:
The Substation Equipment segment, especially power transformers and switchgear, continues to have a large market share because of their essential role in power grids. However, the Software & Services segment, which includes SAS software, SCADA, and HMI, is growing quickly as utilities invest in digital technology for better grid management and predictive maintenance. Gateway concentrators, vital for data collection in smart grids, are also becoming more popular. This increase is driven by the rise of IoT devices in the grid.
Technology:
The Digital Substation Technology segment is the fastest-growing part, driven by the need for real-time data, better operational efficiency, and improved cybersecurity. This includes more Intelligent Electronic Devices (IEDs) and advanced communication networks, such as IEC 61850 compliant systems. While Conventional Substation Technology still has a larger installed base, the trend is clearly moving towards digital changes to support smart grid functions and renewable energy integration. In the industrial substation market, the communication network segment had a market share of 19.4% in 2024, thanks to the adoption of IIoT and advanced communication protocols.
Application:
Transmission and Distribution applications together lead the market, as these are the main functions of power delivery. The integration of Renewable Energy Sources into the grid is a rapidly growing application. It requires specialized collector substations and advanced control systems to manage inconsistent power flows. Industrial substations are also an important application, driven by the need for a reliable power supply in manufacturing and process industries.
End-User:
Utilities, both public and private, remain the largest end-user segment because they manage most of the power generation, transmission, and distribution infrastructure. The Industrial sector is a growing end-user, with strong demand for reliable and automated substations to ensure continuous production. The increasing number of large commercial buildings and data centers also boosts the need for dependable substation infrastructure.
Distribution Channel:
Direct Sales to utilities and large industrial clients, often involving complex project contracts, remain a main distribution channel. However, System Integrators are becoming more important, providing customized solutions that combine hardware, software, and services from various vendors. The complexity of modern substation and gateway deployments requires specialized integration skills.
Regional:
North America was the largest region in the substation automation market in 2024, fueled by significant investments in upgrading grids and adopting smart grid technologies. Asia-Pacific is expected to be the fastest-growing region, driven by rapid industrial growth, urban development, and huge investments in new power infrastructure and renewable energy efforts in countries like China and India. Europe also has a large market share, supported by strict energy efficiency rules and smart grid projects.
Product Type (Gateway Concentrators, Substation Equipment, Software & Services) Technology (SAS, Digital Substation Technology, Conventional Substation Technology) Application (Transmission Substations, Distribution Substations, Collector Substations, Industrial Substations, Railway Substations) End-User (Utilities, Power Generation Companies, Industrial, Commercial, Transportation, Original Equipment Manufacturers) Distribution Channel (Direct Sales, System Integrators, Channel Partners, EPC Contractors)
Research Methodology
Primary Research- 100 Interviews of Stakeholders
Secondary Research
Desk Research
Regional scope
North America (United States, Canada, Mexico)
Latin America (Brazil, Argentina, Columbia)
East Asia And Pacific (China, Japan, South Korea, Australia, Cambodia, Fiji, Indonesia)
Sea And South Asia (India, Singapore, Thailand, Taiwan, Malaysia)
Eastern Europe (Poland, Russia, Czech Republic, Romania)
Western Europe (Germany, U.K., France, Spain, Itlay)
Middle East & Africa (GCC Countries, Egypt, Nigeria, South Africa, Israel)
Competitive Landscape
ABB Ltd., Siemens AG, Schneider Electric SE, General Electric (GE) Vernova, Hitachi Energy, Eaton Corporation plc, Honeywell International Inc., Schweitzer Engineering Laboratories (SEL), Mitsubishi Electric Corporation, Larsen & Toubro Limited (L&T), Itron Inc., Trilliant Networks, RAKwireless, Lucy Electric, Arteche, CG Power and Industrial Solutions Ltd., Novatech Automation, Selta Spa, Toshiba Corporation, Hyundai Electric & Energy Systems Co., Ltd.
Customization Scope
Customization for segments, region/country-level will be provided. Moreover, additional customization can be done based on the requirements.
Pricing and Purchase Options
Avail customized purchase options to meet your exact research needs. We have three licenses to opt for: Single User License, Multi-User License (Up to 5 Users), Corporate Use License (Unlimited User and Printable PDF).
TABLE OF CONTENTS
1. EXECUTIVE SUMMARY
1.1. MARKET SNAPSHOT
1.2. KEY FINDINGS & INSIGHTS
1.3. ANALYST RECOMMENDATIONS
1.4. FUTURE OUTLOOK
2. RESEARCH METHODOLOGY
2.1. MARKET DEFINITION & SCOPE
2.2. RESEARCH OBJECTIVES: PRIMARY & SECONDARY DATA SOURCES
2.3. DATA COLLECTION SOURCES
2.3.1. COVERAGE OF 100+ PRIMARY RESEARCH/CONSULTATION CALLS WITH INDUSTRY STAKEHOLDERS
FIGURE 17 NORTH AMERICA GATEWAY CONCENTRATOR OR SUBSTATION CURRENT AND FUTURE TYPE ANALYSIS, 2025–2034, (USD MILLION)
FIGURE 18 NORTH AMERICA GATEWAY CONCENTRATOR OR SUBSTATION CURRENT AND FUTURE END USER ANALYSIS, 2025–2034, (USD MILLION)
FIGURE 19 MARKET SHARE BY COUNTRY
FIGURE 20 LATIN AMERICA GATEWAY CONCENTRATOR OR SUBSTATION CURRENT AND FUTURE TYPE ANALYSIS, 2025–2034, (USD MILLION)
FIGURE 21 LATIN AMERICA GATEWAY CONCENTRATOR OR SUBSTATION CURRENT AND FUTURE END USER ANALYSIS, 2025–2034, (USD MILLION)
FIGURE 22 MARKET SHARE BY COUNTRY
FIGURE 23 EASTERN EUROPE GATEWAY CONCENTRATOR OR SUBSTATION CURRENT AND FUTURE TYPE ANALYSIS, 2025–2034, (USD MILLION)
FIGURE 24 EASTERN EUROPE GATEWAY CONCENTRATOR OR SUBSTATION CURRENT AND FUTURE END USER ANALYSIS, 2025–2034, (USD MILLION)
FIGURE 25 MARKET SHARE BY COUNTRY
FIGURE 26 WESTERN EUROPE GATEWAY CONCENTRATOR OR SUBSTATION CURRENT AND FUTURE TYPE ANALYSIS, 2025–2034, (USD MILLION)
FIGURE 27 WESTERN EUROPE GATEWAY CONCENTRATOR OR SUBSTATION CURRENT AND FUTURE END USER ANALYSIS, 2025–2034, (USD MILLION)
FIGURE 28 MARKET SHARE BY COUNTRY
FIGURE 29 EAST ASIA AND PACIFIC GATEWAY CONCENTRATOR OR SUBSTATION CURRENT AND FUTURE TYPE ANALYSIS, 2025–2034, (USD MILLION)
FIGURE 30 EAST ASIA AND PACIFIC GATEWAY CONCENTRATOR OR SUBSTATION CURRENT AND FUTURE END USER ANALYSIS, 2025–2034, (USD MILLION)
FIGURE 31 MARKET SHARE BY COUNTRY
FIGURE 32 SEA AND SOUTH ASIA GATEWAY CONCENTRATOR OR SUBSTATION CURRENT AND FUTURE TYPE ANALYSIS, 2025–2034, (USD MILLION)
FIGURE 33 SEA AND SOUTH ASIA GATEWAY CONCENTRATOR OR SUBSTATION CURRENT AND FUTURE END USER ANALYSIS, 2025–2034, (USD MILLION)
FIGURE 34 MARKET SHARE BY COUNTRY
FIGURE 35 MIDDLE EAST AND AFRICA GATEWAY CONCENTRATOR OR SUBSTATION CURRENT AND FUTURE TYPE ANALYSIS, 2025–2034, (USD MILLION)
FIGURE 36 MIDDLE EAST AND AFRICA GATEWAY CONCENTRATOR OR SUBSTATION CURRENT AND FUTURE END USER ANALYSIS, 2025–2034, (USD MILLION)
FIGURE 37 NORTH AMERICA GATEWAY CONCENTRATOR OR SUBSTATION CURRENT AND FUTURE MARKET VOLUME SHARE REGIONAL ANALYSIS, 2025–2034, (USD MILLION)
FIGURE 38 U.S. GATEWAY CONCENTRATOR OR SUBSTATION CURRENT AND FUTURE TYPE ANALYSIS, 2025–2034, (USD MILLION)
FIGURE 39 U.S. GATEWAY CONCENTRATOR OR SUBSTATION CURRENT AND FUTURE END USER ANALYSIS, 2025–2034, (USD MILLION)
FIGURE 40 CANADA GATEWAY CONCENTRATOR OR SUBSTATION CURRENT AND FUTURE TYPE ANALYSIS, 2025–2034, (USD MILLION)
FIGURE 41 CANADA GATEWAY CONCENTRATOR OR SUBSTATION CURRENT AND FUTURE END USER ANALYSIS, 2025–2034, (USD MILLION)
FIGURE 42 LATIN AMERICA GATEWAY CONCENTRATOR OR SUBSTATION CURRENT AND FUTURE MARKET VOLUME SHARE REGIONAL ANALYSIS, 2025–2034, (USD MILLION)
FIGURE 43 MEXICO GATEWAY CONCENTRATOR OR SUBSTATION CURRENT AND FUTURE TYPE ANALYSIS, 2025–2034, (USD MILLION)
FIGURE 44 MEXICO GATEWAY CONCENTRATOR OR SUBSTATION CURRENT AND FUTURE END USER ANALYSIS, 2025–2034, (USD MILLION)
FIGURE 45 BRAZIL GATEWAY CONCENTRATOR OR SUBSTATION CURRENT AND FUTURE TYPE ANALYSIS, 2025–2034, (USD MILLION)
FIGURE 46 BRAZIL GATEWAY CONCENTRATOR OR SUBSTATION CURRENT AND FUTURE END USER ANALYSIS, 2025–2034, (USD MILLION)
FIGURE 47 ARGENTINA GATEWAY CONCENTRATOR OR SUBSTATION CURRENT AND FUTURE TYPE ANALYSIS, 2025–2034, (USD MILLION)
FIGURE 48 ARGENTINA GATEWAY CONCENTRATOR OR SUBSTATION CURRENT AND FUTURE END USER ANALYSIS, 2025–2034, (USD MILLION)
FIGURE 49 COLUMBIA GATEWAY CONCENTRATOR OR SUBSTATION CURRENT AND FUTURE TYPE ANALYSIS, 2025–2034, (USD MILLION)
FIGURE 50 COLUMBIA GATEWAY CONCENTRATOR OR SUBSTATION CURRENT AND FUTURE END USER ANALYSIS, 2025–2034, (USD MILLION)
FIGURE 51 REST OF LATIN AMERICA GATEWAY CONCENTRATOR OR SUBSTATION CURRENT AND FUTURE TYPE ANALYSIS, 2025–2034, (USD MILLION)
FIGURE 52 REST OF LATIN AMERICA GATEWAY CONCENTRATOR OR SUBSTATION CURRENT AND FUTURE END USER ANALYSIS, 2025–2034, (USD MILLION)
FIGURE 53 EASTERN EUROPE GATEWAY CONCENTRATOR OR SUBSTATION CURRENT AND FUTURE MARKET VOLUME SHARE REGIONAL ANALYSIS, 2025–2034, (USD MILLION)
FIGURE 54 POLAND GATEWAY CONCENTRATOR OR SUBSTATION CURRENT AND FUTURE TYPE ANALYSIS, 2025–2034, (USD MILLION)
FIGURE 55 POLAND GATEWAY CONCENTRATOR OR SUBSTATION CURRENT AND FUTURE END USER ANALYSIS, 2025–2034, (USD MILLION)
FIGURE 56 RUSSIA GATEWAY CONCENTRATOR OR SUBSTATION CURRENT AND FUTURE TYPE ANALYSIS, 2025–2034, (USD MILLION)
FIGURE 57 RUSSIA GATEWAY CONCENTRATOR OR SUBSTATION CURRENT AND FUTURE END USER ANALYSIS, 2025–2034, (USD MILLION)
FIGURE 58 CZECH REPUBLIC GATEWAY CONCENTRATOR OR SUBSTATION CURRENT AND FUTURE TYPE ANALYSIS, 2025–2034, (USD MILLION)
FIGURE 59 CZECH REPUBLIC GATEWAY CONCENTRATOR OR SUBSTATION CURRENT AND FUTURE END USER ANALYSIS, 2025–2034, (USD MILLION)
FIGURE 60 ROMANIA GATEWAY CONCENTRATOR OR SUBSTATION CURRENT AND FUTURE TYPE ANALYSIS, 2025–2034, (USD MILLION)
FIGURE 61 ROMANIA GATEWAY CONCENTRATOR OR SUBSTATION CURRENT AND FUTURE END USER ANALYSIS, 2025–2034, (USD MILLION)
FIGURE 62 REST OF EASTERN EUROPE GATEWAY CONCENTRATOR OR SUBSTATION CURRENT AND FUTURE TYPE ANALYSIS, 2025–2034, (USD MILLION)
FIGURE 63 REST OF EASTERN EUROPE GATEWAY CONCENTRATOR OR SUBSTATION CURRENT AND FUTURE END USER ANALYSIS, 2025–2034, (USD MILLION)
FIGURE 64 WESTERN EUROPE GATEWAY CONCENTRATOR OR SUBSTATION CURRENT AND FUTURE MARKET VOLUME SHARE REGIONAL ANALYSIS, 2025–2034, (USD MILLION)
FIGURE 65 GERMANY GATEWAY CONCENTRATOR OR SUBSTATION CURRENT AND FUTURE TYPE ANALYSIS, 2025–2034, (USD MILLION)
FIGURE 66 GERMANY GATEWAY CONCENTRATOR OR SUBSTATION CURRENT AND FUTURE END USER ANALYSIS, 2025–2034, (USD MILLION)
FIGURE 67 FRANCE GATEWAY CONCENTRATOR OR SUBSTATION CURRENT AND FUTURE TYPE ANALYSIS, 2025–2034, (USD MILLION)
FIGURE 68 FRANCE GATEWAY CONCENTRATOR OR SUBSTATION CURRENT AND FUTURE END USER ANALYSIS, 2025–2034, (USD MILLION)
FIGURE 69 UK GATEWAY CONCENTRATOR OR SUBSTATION CURRENT AND FUTURE TYPE ANALYSIS, 2025–2034, (USD MILLION)
FIGURE 70 UK GATEWAY CONCENTRATOR OR SUBSTATION CURRENT AND FUTURE END USER ANALYSIS, 2025–2034, (USD MILLION)
FIGURE 71 SPAIN GATEWAY CONCENTRATOR OR SUBSTATION CURRENT AND FUTURE TYPE ANALYSIS, 2025–2034, (USD MILLION)
FIGURE 72 SPAIN GATEWAY CONCENTRATOR OR SUBSTATION CURRENT AND FUTURE END USER ANALYSIS, 2025–2034, (USD MILLION)
FIGURE 73 ITALY GATEWAY CONCENTRATOR OR SUBSTATION CURRENT AND FUTURE TYPE ANALYSIS, 2025–2034, (USD MILLION)
FIGURE 74 ITALY GATEWAY CONCENTRATOR OR SUBSTATION CURRENT AND FUTURE END USER ANALYSIS, 2025–2034, (USD MILLION)
FIGURE 75 REST OF WESTERN EUROPE GATEWAY CONCENTRATOR OR SUBSTATION CURRENT AND FUTURE TYPE ANALYSIS, 2025–2034, (USD MILLION)
FIGURE 76 REST OF WESTERN EUROPE GATEWAY CONCENTRATOR OR SUBSTATION CURRENT AND FUTURE END USER ANALYSIS, 2025–2034, (USD MILLION)
FIGURE 77 EAST ASIA AND PACIFIC GATEWAY CONCENTRATOR OR SUBSTATION CURRENT AND FUTURE MARKET VOLUME SHARE REGIONAL ANALYSIS, 2025–2034, (USD MILLION)
FIGURE 78 CHINA GATEWAY CONCENTRATOR OR SUBSTATION CURRENT AND FUTURE TYPE ANALYSIS, 2025–2034, (USD MILLION)
FIGURE 79 CHINA GATEWAY CONCENTRATOR OR SUBSTATION CURRENT AND FUTURE END USER ANALYSIS, 2025–2034, (USD MILLION)
FIGURE 80 JAPAN GATEWAY CONCENTRATOR OR SUBSTATION CURRENT AND FUTURE TYPE ANALYSIS, 2025–2034, (USD MILLION)
FIGURE 81 JAPAN GATEWAY CONCENTRATOR OR SUBSTATION CURRENT AND FUTURE END USER ANALYSIS, 2025–2034, (USD MILLION)
FIGURE 82 AUSTRALIA GATEWAY CONCENTRATOR OR SUBSTATION CURRENT AND FUTURE TYPE ANALYSIS, 2025–2034, (USD MILLION)
FIGURE 83 AUSTRALIA GATEWAY CONCENTRATOR OR SUBSTATION CURRENT AND FUTURE END USER ANALYSIS, 2025–2034, (USD MILLION)
FIGURE 84 CAMBODIA GATEWAY CONCENTRATOR OR SUBSTATION CURRENT AND FUTURE TYPE ANALYSIS, 2025–2034, (USD MILLION)
FIGURE 85 CAMBODIA GATEWAY CONCENTRATOR OR SUBSTATION CURRENT AND FUTURE END USER ANALYSIS, 2025–2034, (USD MILLION)
FIGURE 86 FIJI GATEWAY CONCENTRATOR OR SUBSTATION CURRENT AND FUTURE TYPE ANALYSIS, 2025–2034, (USD MILLION)
FIGURE 87 FIJI GATEWAY CONCENTRATOR OR SUBSTATION CURRENT AND FUTURE END USER ANALYSIS, 2025–2034, (USD MILLION)
FIGURE 88 INDONESIA GATEWAY CONCENTRATOR OR SUBSTATION CURRENT AND FUTURE TYPE ANALYSIS, 2025–2034, (USD MILLION)
FIGURE 89 INDONESIA GATEWAY CONCENTRATOR OR SUBSTATION CURRENT AND FUTURE END USER ANALYSIS, 2025–2034, (USD MILLION)
FIGURE 90 SOUTH KOREA GATEWAY CONCENTRATOR OR SUBSTATION CURRENT AND FUTURE TYPE ANALYSIS, 2025–2034, (USD MILLION)
FIGURE 91 SOUTH KOREA GATEWAY CONCENTRATOR OR SUBSTATION CURRENT AND FUTURE END USER ANALYSIS, 2025–2034, (USD MILLION)
FIGURE 92 REST OF EAST ASIA AND PACIFIC GATEWAY CONCENTRATOR OR SUBSTATION CURRENT AND FUTURE TYPE ANALYSIS, 2025–2034, (USD MILLION)
FIGURE 93 REST OF EAST ASIA AND PACIFIC GATEWAY CONCENTRATOR OR SUBSTATION CURRENT AND FUTURE END USER ANALYSIS, 2025–2034, (USD MILLION)
FIGURE 94 SEA AND SOUTH ASIA GATEWAY CONCENTRATOR OR SUBSTATION CURRENT AND FUTURE MARKET VOLUME SHARE REGIONAL ANALYSIS, 2025–2034, (USD MILLION)
FIGURE 95 BANGLADESH GATEWAY CONCENTRATOR OR SUBSTATION CURRENT AND FUTURE TYPE ANALYSIS, 2025–2034, (USD MILLION)
FIGURE 96 BANGLADESH GATEWAY CONCENTRATOR OR SUBSTATION CURRENT AND FUTURE END USER ANALYSIS, 2025–2034, (USD MILLION)
FIGURE 97 NEW ZEALAND GATEWAY CONCENTRATOR OR SUBSTATION CURRENT AND FUTURE TYPE ANALYSIS, 2025–2034, (USD MILLION)
FIGURE 98 NEW ZEALAND GATEWAY CONCENTRATOR OR SUBSTATION CURRENT AND FUTURE END USER ANALYSIS, 2025–2034, (USD MILLION)
FIGURE 99 INDIA GATEWAY CONCENTRATOR OR SUBSTATION CURRENT AND FUTURE TYPE ANALYSIS, 2025–2034, (USD MILLION)
FIGURE 100 INDIA GATEWAY CONCENTRATOR OR SUBSTATION CURRENT AND FUTURE END USER ANALYSIS, 2025–2034, (USD MILLION)
FIGURE 101 SINGAPORE GATEWAY CONCENTRATOR OR SUBSTATION CURRENT AND FUTURE TYPE ANALYSIS, 2025–2034, (USD MILLION)
FIGURE 102 SINGAPORE GATEWAY CONCENTRATOR OR SUBSTATION CURRENT AND FUTURE END USER ANALYSIS, 2025–2034, (USD MILLION)
FIGURE 103 THAILAND GATEWAY CONCENTRATOR OR SUBSTATION CURRENT AND FUTURE TYPE ANALYSIS, 2025–2034, (USD MILLION)
FIGURE 104 THAILAND GATEWAY CONCENTRATOR OR SUBSTATION CURRENT AND FUTURE END USER ANALYSIS, 2025–2034, (USD MILLION)
FIGURE 105 TAIWAN GATEWAY CONCENTRATOR OR SUBSTATION CURRENT AND FUTURE TYPE ANALYSIS, 2025–2034, (USD MILLION)
FIGURE 106 TAIWAN GATEWAY CONCENTRATOR OR SUBSTATION CURRENT AND FUTURE END USER ANALYSIS, 2025–2034, (USD MILLION)
FIGURE 107 MALAYSIA GATEWAY CONCENTRATOR OR SUBSTATION CURRENT AND FUTURE TYPE ANALYSIS, 2025–2034, (USD MILLION)
FIGURE 108 MALAYSIA GATEWAY CONCENTRATOR OR SUBSTATION CURRENT AND FUTURE END USER ANALYSIS, 2025–2034, (USD MILLION)
FIGURE 109 REST OF SEA AND SOUTH ASIA GATEWAY CONCENTRATOR OR SUBSTATION CURRENT AND FUTURE TYPE ANALYSIS, 2025–2034, (USD MILLION)
FIGURE 110 REST OF SEA AND SOUTH ASIA GATEWAY CONCENTRATOR OR SUBSTATION CURRENT AND FUTURE END USER ANALYSIS, 2025–2034, (USD MILLION)
FIGURE 111 MIDDLE EAST AND AFRICA GATEWAY CONCENTRATOR OR SUBSTATION CURRENT AND FUTURE MARKET VOLUME SHARE REGIONAL ANALYSIS, 2025–2034, (USD MILLION)
FIGURE 112 GCC COUNTRIES GATEWAY CONCENTRATOR OR SUBSTATION CURRENT AND FUTURE TYPE ANALYSIS, 2025–2034, (USD MILLION)
FIGURE 113 GCC COUNTRIES GATEWAY CONCENTRATOR OR SUBSTATION CURRENT AND FUTURE END USER ANALYSIS, 2025–2034, (USD MILLION)
FIGURE 114 SAUDI ARABIA GATEWAY CONCENTRATOR OR SUBSTATION CURRENT AND FUTURE TYPE ANALYSIS, 2025–2034, (USD MILLION)
FIGURE 115 SAUDI ARABIA GATEWAY CONCENTRATOR OR SUBSTATION CURRENT AND FUTURE END USER ANALYSIS, 2025–2034, (USD MILLION)
FIGURE 116 UAE GATEWAY CONCENTRATOR OR SUBSTATION CURRENT AND FUTURE TYPE ANALYSIS, 2025–2034, (USD MILLION)
FIGURE 117 UAE GATEWAY CONCENTRATOR OR SUBSTATION CURRENT AND FUTURE END USER ANALYSIS, 2025–2034, (USD MILLION)
FIGURE 118 BAHRAIN GATEWAY CONCENTRATOR OR SUBSTATION CURRENT AND FUTURE TYPE ANALYSIS, 2025–2034, (USD MILLION)
FIGURE 119 BAHRAIN GATEWAY CONCENTRATOR OR SUBSTATION CURRENT AND FUTURE END USER ANALYSIS, 2025–2034, (USD MILLION)
FIGURE 120 KUWAIT GATEWAY CONCENTRATOR OR SUBSTATION CURRENT AND FUTURE TYPE ANALYSIS, 2025–2034, (USD MILLION)
FIGURE 121 KUWAIT GATEWAY CONCENTRATOR OR SUBSTATION CURRENT AND FUTURE END USER ANALYSIS, 2025–2034, (USD MILLION)
FIGURE 122 OMAN GATEWAY CONCENTRATOR OR SUBSTATION CURRENT AND FUTURE TYPE ANALYSIS, 2025–2034, (USD MILLION)
FIGURE 123 OMAN GATEWAY CONCENTRATOR OR SUBSTATION CURRENT AND FUTURE END USER ANALYSIS, 2025–2034, (USD MILLION)
FIGURE 124 QATAR GATEWAY CONCENTRATOR OR SUBSTATION CURRENT AND FUTURE TYPE ANALYSIS, 2025–2034, (USD MILLION)
FIGURE 125 QATAR GATEWAY CONCENTRATOR OR SUBSTATION CURRENT AND FUTURE END USER ANALYSIS, 2025–2034, (USD MILLION)
FIGURE 126 EGYPT GATEWAY CONCENTRATOR OR SUBSTATION CURRENT AND FUTURE TYPE ANALYSIS, 2025–2034, (USD MILLION)
FIGURE 127 EGYPT GATEWAY CONCENTRATOR OR SUBSTATION CURRENT AND FUTURE END USER ANALYSIS, 2025–2034, (USD MILLION)
FIGURE 128 NIGERIA GATEWAY CONCENTRATOR OR SUBSTATION CURRENT AND FUTURE TYPE ANALYSIS, 2025–2034, (USD MILLION)
FIGURE 129 NIGERIA GATEWAY CONCENTRATOR OR SUBSTATION CURRENT AND FUTURE END USER ANALYSIS, 2025–2034, (USD MILLION)
FIGURE 130 SOUTH AFRICA GATEWAY CONCENTRATOR OR SUBSTATION CURRENT AND FUTURE TYPE ANALYSIS, 2025–2034, (USD MILLION)
FIGURE 131 SOUTH AFRICA GATEWAY CONCENTRATOR OR SUBSTATION CURRENT AND FUTURE END USER ANALYSIS, 2025–2034, (USD MILLION)
FIGURE 132 ISRAEL GATEWAY CONCENTRATOR OR SUBSTATION CURRENT AND FUTURE TYPE ANALYSIS, 2025–2034, (USD MILLION)
FIGURE 133 ISRAEL GATEWAY CONCENTRATOR OR SUBSTATION CURRENT AND FUTURE END USER ANALYSIS, 2025–2034, (USD MILLION)
FIGURE 134 REST OF MEA GATEWAY CONCENTRATOR OR SUBSTATION CURRENT AND FUTURE TYPE ANALYSIS, 2025–2034, (USD MILLION)
FIGURE 135 REST OF MEA GATEWAY CONCENTRATOR OR SUBSTATION CURRENT AND FUTURE END USER ANALYSIS, 2025–2034, (USD MILLION)
FIGURE 136 U. S. MARKET SHARE ANALYSIS BY TYPE (2024)
FIGURE 137 U. S. MARKET SHARE ANALYSIS BY END USER (2024)
FIGURE 138 CANADA MARKET SHARE ANALYSIS BY TYPE (2024)
FIGURE 139 CANADA MARKET SHARE ANALYSIS BY END USER (2024)
FIGURE 140 MEXICO MARKET SHARE ANALYSIS BY TYPE (2024)
FIGURE 141 MEXICO MARKET SHARE ANALYSIS BY END USER (2024)
FIGURE 142 CHINA MARKET SHARE ANALYSIS BY TYPE (2024)
FIGURE 143 CHINA MARKET SHARE ANALYSIS BY END USER (2024)
FIGURE 144 JAPAN MARKET SHARE ANALYSIS BY TYPE (2024)
FIGURE 145 JAPAN MARKET SHARE ANALYSIS BY END USER (2024)
FIGURE 146 INDIA MARKET SHARE ANALYSIS BY TYPE (2024)
FIGURE 147 INDIA MARKET SHARE ANALYSIS BY END USER (2024)
FIGURE 148 SOUTH KOREA MARKET SHARE ANALYSIS BY TYPE (2024)
FIGURE 149 SOUTH KOREA MARKET SHARE ANALYSIS BY END USER (2024)
FIGURE 150 SAUDI ARABIA MARKET SHARE ANALYSIS BY TYPE (2024)
FIGURE 151 SAUDI ARABIA MARKET SHARE ANALYSIS BY END USER (2024)
FIGURE 152 UAE MARKET SHARE ANALYSIS BY TYPE (2024)
FIGURE 153 UAE MARKET SHARE ANALYSIS BY END USER (2024)
FIGURE 154 EGYPT MARKET SHARE ANALYSIS BY TYPE (2024)
FIGURE 155 EGYPT MARKET SHARE ANALYSIS BY END USER (2024)
FIGURE 156 NIGERIA MARKET SHARE ANALYSIS BY TYPE (2024)
FIGURE 157 NIGERIA MARKET SHARE ANALYSIS BY END USER (2024)
FIGURE 158 SOUTH AFRICA MARKET SHARE ANALYSIS BY TYPE (2024)
FIGURE 159 SOUTH AFRICA MARKET SHARE ANALYSIS BY END USER (2024)
FIGURE 160 GERMANY MARKET SHARE ANALYSIS BY TYPE (2024)
FIGURE 161 GERMANY MARKET SHARE ANALYSIS BY END USER (2024)
FIGURE 162 FRANCE MARKET SHARE ANALYSIS BY TYPE (2024)
FIGURE 163 FRANCE MARKET SHARE ANALYSIS BY END USER (2024)
FIGURE 164 UK MARKET SHARE ANALYSIS BY TYPE (2024)
FIGURE 165 UK MARKET SHARE ANALYSIS BY END USER (2024)
FIGURE 166 SPAIN MARKET SHARE ANALYSIS BY TYPE (2024)
FIGURE 167 SPAIN MARKET SHARE ANALYSIS BY END USER (2024)
FIGURE 168 ITALY MARKET SHARE ANALYSIS BY TYPE (2024)
FIGURE 169 ITALY MARKET SHARE ANALYSIS BY END USER (2024)
FIGURE 170 BRAZIL MARKET SHARE ANALYSIS BY TYPE (2024)
FIGURE 171 BRAZIL MARKET SHARE ANALYSIS BY END USER (2024)
FIGURE 172 ARGENTINA MARKET SHARE ANALYSIS BY TYPE (2024)
FIGURE 173 ARGENTINA MARKET SHARE ANALYSIS BY END USER (2024)
FIGURE 174 COLUMBIA MARKET SHARE ANALYSIS BY TYPE (2024)
FIGURE 175 COLUMBIA MARKET SHARE ANALYSIS BY END USER (2024)
FIGURE 176 GLOBAL GATEWAY CONCENTRATOR OR SUBSTATION CURRENT AND FUTURE MARKET KEY COUNTRY LEVEL ANALYSIS, 2024–2034, (USD MILLION)
FIGURE 177 FINANCIAL OVERVIEW:
Key Players Analysis:
ABB Ltd.: A global technology leader in electrification and automation, providing comprehensive substation automation, control, and protection solutions, including advanced relays, communication products, and digital substation offerings.
Siemens AG: A German multinational conglomerate with a strong focus on industrial automation and smart infrastructure, offering a wide range of substation solutions, including digital substations, energy management systems, and grid control platforms.
Schneider Electric SE: A French multinational corporation specializing in energy management and automation, providing integrated substation solutions, data concentrators, and software for smart grid applications.
General Electric (GE) Vernova: A global energy technology company offering an industry-leading suite of multifunction servers, gateways, RTUs, and data concentrators for automating substation equipment and providing visibility to critical electrical assets across power grids.
Hitachi Energy: A global technology leader in power grids, providing advanced substation automation, protection, and control solutions, emphasizing digital substations and grid integration of renewables.
Eaton Corporation plc: An Irish-American multinational power Management Company offering a broad portfolio of electrical solutions, including substation automation platforms like the SMP Gateway, which functions as a data concentrator and protocol converter.
Honeywell International Inc.: A diversified technology and manufacturing company providing industrial automation and control systems, including solutions relevant to substation operations and data management.
Schweitzer Engineering Laboratories (SEL): A leading provider of digital relays, automation systems, and communication solutions for the protection, control, and monitoring of electric power systems, including substations.
Mitsubishi Electric Corporation: A Japanese multinational electronics and electrical equipment manufacturer offering a wide range of power systems and industrial automation products, including substation equipment and control systems.
Larsen & Toubro Limited (L&T): A major Indian multinational conglomerate involved in engineering, construction, manufacturing, and financial services, with a significant presence in power transmission and distribution, including substation projects.
Key Market Players:
ABB Ltd.
Siemens AG
Schneider Electric SE
General Electric (GE) Vernova
Hitachi Energy
Eaton Corporation plc
Honeywell International Inc.
Schweitzer Engineering Laboratories (SEL)
Mitsubishi Electric Corporation
Larsen & Toubro Limited (L&T)
Itron Inc.
Trilliant Networks
RAKwireless
Lucy Electric
Arteche
CG Power and Industrial Solutions Ltd.
Novatech Automation
Selta Spa
Toshiba Corporation
Hyundai Electric & Energy Systems Co., Ltd.
Drivers
Grid Modernization and Renewable Energy Integration
The Global Gateway Concentrator and Substation Market is mainly fueled by the growing demand for efficient and reliable power distribution systems. This need is partly due to global efforts to modernize aging electrical grids, which often cannot handle the rising demand and the complexities of today’s power flows. A key factor is the need to incorporate various renewable energy sources, like solar and wind power, into the grid. These intermittent sources require advanced management systems to maintain stability and efficiency.
Smart Grid Adoption and IIoT-Enabled Substations
Technological improvements in communication systems also boost market growth. There is a growing focus on grid stability and various government programs that support smart grid projects. The rising use of Industrial IoT (IIoT) and advanced communication methods allows for real-time data transfer and remote monitoring. This improves the efficiency and reliability of substations. The need for a stable power supply during industrial operations also greatly increases the demand for strong substation infrastructure.
Restraints
High Capital Investment and Digital Transition Costs
Even with strong growth drivers, the market faces significant challenges, mostly the high upfront costs tied to deploying advanced gateway concentrators and upgrading substation infrastructure. Moving from traditional to digital substations requires substantial investment, which can be a barrier for some utilities and industrial companies.
Integration Complexity and Cybersecurity Risks
Another major issue is the complexity of smoothly integrating new digital systems with existing, often outdated, infrastructure. This integration needs specialized skills and can cause interoperability problems, project delays, and higher costs. Additionally, protecting critical infrastructure from evolving cyber threats and ensuring data security in increasingly connected systems are major concerns that can slow down adoption.
Opportunities
Advanced Communication Protocols and Intelligent Grid Analytics
The market offers significant opportunities from the ongoing development of advanced communication protocols, like IEC 61850, which allow for seamless interoperability between various intelligent electronic devices (IEDs) in substations. The growing use of cutting-edge technologies like IoT and Artificial Intelligence (AI) provides a big chance to improve grid intelligence. This can lead to predictive maintenance, real-time data analysis, and better operational efficiency.
EV Infrastructure Expansion and Decarbonization Initiatives
Moreover, the global growth of smart grid initiatives and the need for decarbonization are creating new chances for market expansion. The increasing demand for efficient power management solutions to support more electric vehicles (EVs) and the rising energy needs of data centers also offer valuable opportunities for advanced substation and gateway concentrator solutions.
Trends
Shift Toward Digital and Automated Substations
A key trend affecting the Global Gateway Concentrator and Substation Market is the quick shift towards digital substations. This change involves swapping traditional analog components for digital intelligent electronic devices (IEDs) and using fiber optic communication. This allows for real-time data exchange, remote monitoring, and better automation. This shift improves operational efficiency, lowers maintenance costs, and increases safety by reducing human involvement.
Cybersecurity Prioritization and Modular Substation Design
Another important trend is the growing emphasis on cybersecurity in substation automation systems. As substations become more interconnected and digital, they also become more exposed to cyber threats. As a result, there is a higher focus on implementing strong cybersecurity measures and protocols to safeguard critical power infrastructure from attacks. The market is also seeing a trend towards modular and compact substation designs, enabling faster deployment and reduced space requirements, particularly in urban and renewable energy installations.
Competitive Landscape
The Global Gateway Concentrator and Substation Market features a mix of multinational conglomerates, specialized technology providers, and regional players. The competitive landscape is characterized by continuous innovation in digital solutions, strategic partnerships for integrated offerings, and mergers & acquisitions to expand market reach and technological capabilities.
Recent Developments
July 2025: Hitachi Energy announced a major milestone with SMA, delivering 3,000 transformers, signaling continued collaboration in power solutions crucial for grid infrastructure.
June 2025: GE Vernova launched new multifunction servers, gateways, RTUs, and data concentrators, enhancing their offering for automating substation equipment and providing visibility to critical electrical assets across power grids. This development focuses on simplifying deployment, operation, and maintenance of automation systems with a compact form factor.
April 2025: Eaton released a white paper detailing how utilities can ensure data integrity and improve performance and reliability by using Eaton's SMP Gateway redundancy feature, highlighting advancements in data concentrator reliability.
February 2025: A major utility in North America announced significant investments in upgrading its aging substation infrastructure with digital monitoring and control systems to handle the complexity of integrating more renewable energy into the grid, driving demand for advanced gateway and substation solutions.
January 2025: RAKwireless launched new LPWAN gateways and concentrator modules designed for enhanced data transmission to IoT clouds, supporting the growing trend of sensor integration in smart grid applications.

 Aerospace And Defence
 Agriculture
 Automotive And Transportation
 Banking And Finance
 Business
 Chemicals And Materials
 Consumer And Retail
 Electronics And Semiconductors
 Food And Beverages
 Machinery & Equipments
 Manufacturing And Construction
 Medical Devices
 Others
 Pharmaceuticals And Healthcare
 Power And Energy
 Sports
 Technology

, Technology (SAS, Digital Substation, Conventional Substation), Application (Transmission, Distribution, Collector, Industrial, Railway Substations), End-User, Distribution Channel, Region & Key Players – Overview, Dynamics, Trends & Forecast 2025–2034")
, Technology (SAS, Digital Substation, Conventional Substation), Application (Transmission, Distribution, Collector, Industrial, Railway Substations), End-User, Distribution Channel, Region & Key Players – Overview, Dynamics, Trends & Forecast 2025–2034")
, Technology (SAS, Digital Substation, Conventional Substation), Application (Transmission, Distribution, Collector, Industrial, Railway Substations), End-User, Distribution Channel, Region & Key Players – Overview, Dynamics, Trends & Forecast 2025–2034")
, Technology (SAS, Digital Substation, Conventional Substation), Application (Transmission, Distribution, Collector, Industrial, Railway Substations), End-User, Distribution Channel, Region & Key Players – Overview, Dynamics, Trends & Forecast 2025–2034")

