Generative AI in Chemical Market Size, Growth & Forecast | CAGR 29.1%
Global Generative AI in Chemical Market Size, Share & Industry Analysis By Technology (Machine Learning, Deep Learning, Generative Models, Quantum Computing, Reinforcement Learning, NLP), By Application (Molecular Design & Drug Discovery, Process Optimization, Chemical Engineering, Market Trend & Pricing Analysis), Industry Region & Key Players – Industry Segment Overview, Market Drivers, Challenges, Competitive Strategies, Innovation Trends & Forecast 2025–2034
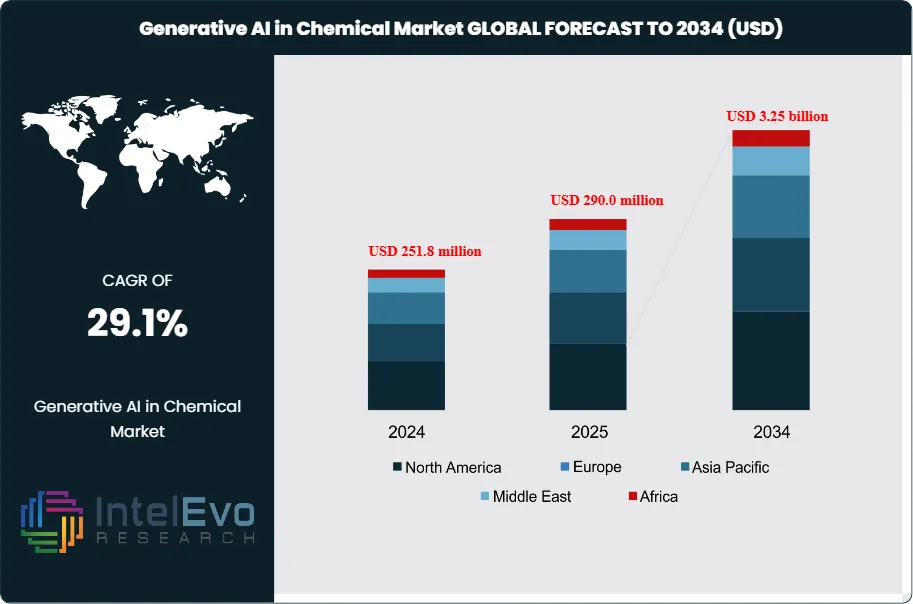
The Generative AI in Chemical Market is valued at approximately USD 290.0 million in 2025 and is projected to reach around USD 3.25 billion by 2034, expanding at a robust compound annual growth rate (CAGR) of about 29.1% during the forecast period from 2026 to 2034. Market growth is fueled by accelerating adoption of AI-driven molecular design, reaction optimization, and predictive analytics across specialty chemicals, pharmaceuticals, and materials science. In addition, rising R&D automation, increasing demand for faster product development cycles, and growing integration of generative models in sustainable chemistry and green manufacturing workflows are positioning the market for exponential long-term expansion.
Growth reflects a move from pilot projects to integrated AI engines embedded in research, development, and manufacturing. Generative models propose novel molecules, estimate properties, and optimize formulations, which shortens discovery cycles and can lower early-stage R&D spending by 20–30% for advanced users.
Demand for sustainable chemistries, higher asset utilization, and rapid product refresh drives adoption. Generative AI supports low-carbon process design, better catalysts, and bio-based materials that help producers respond to stricter emissions rules and circular economy goals. On the supply side, cloud providers, AI platforms, and leading chemical companies form alliances that link molecular design software with automated laboratories and plant control systems, enabling more continuous, data-driven development.
Scientific uptake underpins commercial progress. The Royal Society of Chemistry expects institutions using generative AI to predict chemical behaviors and characteristics to increase by about 40% from 2022 to 2024. The Materials Research Society notes that around 50% of materials science experts plan to use generative AI for new materials design and performance tuning by the end of 2024. The National Science Foundation points to a 35% rise in generative AI use to simulate and visualize complex chemical processes over the same period, reinforcing trust in the technology.
Risk factors remain significant. Data are fragmented, proprietary, and uneven in quality, which constrains model accuracy in specialized domains. Concerns around intellectual property, model explainability, and reproducibility slow deployment in safety-critical and regulated segments. Regulators in North America and Europe now expect explainable models, auditable data pipelines, and alignment with chemical safety regimes, pushing governance and validation costs up by an estimated 10–15% for large implementations.
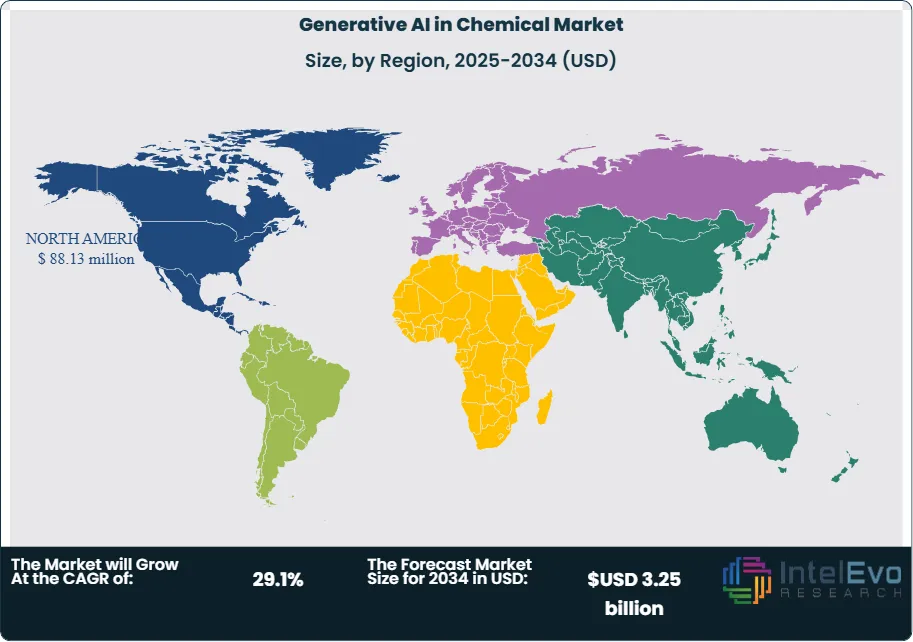
North America is expected to represent about 35% of revenue in 2024, with Europe near 30%, supported by strong pharmaceutical and specialty chemical clusters. Asia Pacific is the fastest-growing region, with a projected CAGR above 30% through 2034, led by China, Japan, South Korea, and India in batteries, electronic materials, and advanced polymers. New initiatives in the Middle East and Latin America around petrochemicals and sustainable feedstocks signal additional investment opportunities across the forecast horizon.
Market Growth: The global generative AI in chemicals space accelerates from early pilots to scaled adoption, with market value reaching estimated: USD 251.8 million in 2024; USD 290.0 million in 2025 and projected to approach estimated: USD 3.25 billion by 2034, implying a CAGR of estimated: 29.1%, 2026-2034.
Segment Dominance: R&D and molecular design workflows hold the largest revenue share as firms prioritize AI-driven compound and formulation discovery, with these use cases accounting for estimated: 55.0%, 2024 of total spending and maintaining leadership through estimated: 2034.
Segment Dominance: Pharmaceuticals and specialty chemicals remain the primary adopters of generative AI platforms, together contributing estimated: 60.0%, 2024 of end-user demand and expected to retain more than estimated: 50.0%, 2034 as downstream industries scale AI-enabled innovation.
Driver: Pressure to cut development timelines and achieve sustainable chemistry outcomes acts as the main growth engine, with leading adopters targeting R&D cycle-time reductions of estimated: 20.0%, 2024 and cost savings of estimated: 15.0%, 2024 versus traditional methods.
Restraint: Data scarcity, IP concerns, and explainability requirements restrict deployment in regulated domains, with governance and compliance efforts adding an extra overhead of estimated: 10.0%, 2024 to large-scale implementations and slowing full-stack integration.
Opportunity: Generative AI unlocks new revenue pools in green chemistry, battery materials, and advanced polymers, where solution providers can capture incremental opportunities worth estimated: 1.0 billion USD, 2034 as clients pursue decarbonization and performance gains.
Trend: Partnerships between AI vendors, cloud platforms, and chemical producers expand, with collaborative ecosystems expected to power more than estimated: 65.0%, 2030 of new deployments and drive strong growth in integrated design-to-manufacturing workflows by estimated: 2034.
Regional Analysis: North America leads early adoption with an estimated: 35.0%, 2024 revenue share, while Europe holds estimated: 30.0%, 2024 and Asia Pacific, at estimated: 25.0%, 2024, records the fastest trajectory toward an expected regional CAGR above estimated: 30.0%, 2024-2034.
By Technology
Machine learning continues to anchor the technology landscape in 2025 as the most widely adopted toolset across chemical research, modeling, and production workflows. It accounted for more than 26 percent of global revenue in 2024 and maintains its lead in 2025 due to its capacity to process large datasets and generate accurate predictions for molecular behavior, process variables, and material performance. You see this reflected in R&D teams that rely on trained models to shorten discovery cycles and improve hit rates in early-stage screening. Adoption remains high because machine learning supports the full chain of activities from formulation work to plant-level quality assurance.
Its position strengthens as downstream technologies draw from machine learning foundations. Deep learning and generative models, including GANs and VAEs, require structured datasets and pre-trained feature extraction systems that machine learning provides. These models now assist chemical developers in exploring new compound families and simulating structural variations at speeds unattainable through conventional laboratory workflows. Quantum computing and reinforcement learning add further scale. Early pilots in 2025 show improvements in reaction optimization and property prediction for catalysts and energy materials, signaling broader use of hybrid approaches over the next five years.
As the technology stack matures, natural language processing and other analytical tools help researchers consolidate scientific literature, patents, and experimental reports into actionable intelligence. Combined, these technologies create an integrated environment where chemical insights update continuously and guide high-value decisions in R&D and advanced manufacturing.
By Application
Molecular design and drug discovery continue to dominate application demand. This segment held more than 39 percent of the market in 2024 and remains the fastest-growing area in 2025. Generative models evaluate molecular structures, simulate behavior, and rank candidates with higher precision than traditional computational tools. Pharmaceutical companies now shorten target identification phases by up to 30 percent, and your teams can screen thousands of potential drug candidates in a fraction of the time required in the past. Chemical producers apply similar methods to design polymers, coatings, additives, and specialty materials with tailored property profiles.
Process optimization and chemical engineering follow as major application clusters. AI systems help operators reduce energy use, stabilize product specifications, and extend asset uptime. Plants implementing AI-supported process control have reported energy reductions of 8 to 12 percent, with measurable improvements in overall throughput. These systems also identify failure risks early, which supports maintenance planning and safety compliance.
Market trend analysis and pricing optimization increase in importance as global volatility raises pressure on margins. AI models track feedstock movements, supply shifts, and customer demand patterns to support commercial decisions. The remaining application areas include recycling optimization, carbon monitoring, and predictive environmental assessment. These segments expand gradually as chemical companies prepare for regulatory targets tied to emissions and waste recovery.
By End-Use
Residential builders show growing interest in generative chemical design as material standards move toward durability, safety, and environmental compliance. AI-assisted formulations for construction chemicals, such as admixtures and sealants, support improved performance with lower resource use. These solutions gain relevance in 2025 as governments push for higher energy-efficiency ratings and longer product life cycles.
Commercial building projects adopt AI-enabled chemical solutions at a faster pace. Large developers and infrastructure firms prioritize materials with predictable behavior, reduced curing times, and enhanced resistance to thermal and mechanical stress. AI-generated material insights help you select products that meet project-specific constraints, which benefits large-scale flooring, façade, and structural applications.
Industrial facilities remain the most advanced users. Operators integrate AI-driven chemical models to support coatings, protective materials, process fluids, and filtration systems tailored to heavy-duty environments. Adoption rises in sectors such as oil and gas, mining, and electronics manufacturing, where even small performance improvements produce significant operational gains.
By Region
North America continues to lead global adoption in 2025 with more than 42 percent of market revenue. Strong demand from pharmaceuticals, specialty chemicals, and advanced materials accelerates uptake. Investment in AI research, high digital maturity, and an active startup base strengthens the regional position. You see partnerships forming between software providers and chemical producers to co-develop models tuned for specific chemistries and process conditions.
Europe follows with steady growth driven by regulatory pressure related to emissions, safety, and circular design. Companies adopt AI tools to meet compliance targets and support low-carbon material development. Activity is especially strong in Germany, France, and the Nordic countries, where chemical firms expand AI budgets and build long-term digitalization strategies.
Asia Pacific shows the highest growth rate through 2030. China, Japan, South Korea, and India increase investment in material science and battery technology. Regional manufacturers implement AI to accelerate product development and strengthen export competitiveness. Latin America and the Middle East and Africa expand at a slower pace but gain attention as petrochemical operators explore AI-supported process enhancement and energy optimization programs.
By Technology, (Machine Learning, Deep Learning, Generative Models (GAN & VAE), Quantum Computing, Reinforcement Learning, Natural Language Processing (NLP), Others), By Application, (Molecular Design and Drug Discovery, Process Optimization and Chemical Engineering, Market Trend Analysis & Pricing Optimization, Others)
Research Methodology
Primary Research- 100 Interviews of Stakeholders
Secondary Research
Desk Research
Regional scope
North America (United States, Canada, Mexico)
Latin America (Brazil, Argentina, Columbia)
East Asia And Pacific (China, Japan, South Korea, Australia, Cambodia, Fiji, Indonesia)
Sea And South Asia (India, Singapore, Thailand, Taiwan, Malaysia)
Eastern Europe (Poland, Russia, Czech Republic, Romania)
Western Europe (Germany, U.K., France, Spain, Itlay)
Middle East & Africa (GCC Countries, Egypt, Nigeria, South Africa, Israel)
Competitive Landscape
Sinochem Corporation, Accenture, Biesterfeld AG, IBM Corporation, Tricon Energy Inc., Omya AG, Mitsui Chemicals, Azelis Group NV, HELM AG, Google, Other Key Players
Customization Scope
Customization for segments, region/country-level will be provided. Moreover, additional customization can be done based on the requirements.
Pricing and Purchase Options
Avail customized purchase options to meet your exact research needs. We have three licenses to opt for: Single User License, Multi-User License (Up to 5 Users), Corporate Use License (Unlimited User and Printable PDF).
TABLE OF CONTENTS
1. EXECUTIVE SUMMARY
1.1. MARKET SNAPSHOT
1.2. KEY FINDINGS & INSIGHTS
1.3. ANALYST RECOMMENDATIONS
1.4. FUTURE OUTLOOK
2. RESEARCH METHODOLOGY
2.1. MARKET DEFINITION & SCOPE
2.2. RESEARCH OBJECTIVES: PRIMARY & SECONDARY DATA SOURCES
2.3. DATA COLLECTION SOURCES
2.3.1. COVERAGE OF 100+ PRIMARY RESEARCH/CONSULTATION CALLS WITH INDUSTRY STAKEHOLDERS
FIGURE 17 NORTH AMERICA GENERATIVE AI IN CHEMICAL CURRENT AND FUTURE TYPE ANALYSIS, 2025–2034, (USD MILLION)
FIGURE 18 NORTH AMERICA GENERATIVE AI IN CHEMICAL CURRENT AND FUTURE END USER ANALYSIS, 2025–2034, (USD MILLION)
FIGURE 19 MARKET SHARE BY COUNTRY
FIGURE 20 LATIN AMERICA GENERATIVE AI IN CHEMICAL CURRENT AND FUTURE TYPE ANALYSIS, 2025–2034, (USD MILLION)
FIGURE 21 LATIN AMERICA GENERATIVE AI IN CHEMICAL CURRENT AND FUTURE END USER ANALYSIS, 2025–2034, (USD MILLION)
FIGURE 22 MARKET SHARE BY COUNTRY
FIGURE 23 EASTERN EUROPE GENERATIVE AI IN CHEMICAL CURRENT AND FUTURE TYPE ANALYSIS, 2025–2034, (USD MILLION)
FIGURE 24 EASTERN EUROPE GENERATIVE AI IN CHEMICAL CURRENT AND FUTURE END USER ANALYSIS, 2025–2034, (USD MILLION)
FIGURE 25 MARKET SHARE BY COUNTRY
FIGURE 26 WESTERN EUROPE GENERATIVE AI IN CHEMICAL CURRENT AND FUTURE TYPE ANALYSIS, 2025–2034, (USD MILLION)
FIGURE 27 WESTERN EUROPE GENERATIVE AI IN CHEMICAL CURRENT AND FUTURE END USER ANALYSIS, 2025–2034, (USD MILLION)
FIGURE 28 MARKET SHARE BY COUNTRY
FIGURE 29 EAST ASIA AND PACIFIC GENERATIVE AI IN CHEMICAL CURRENT AND FUTURE TYPE ANALYSIS, 2025–2034, (USD MILLION)
FIGURE 30 EAST ASIA AND PACIFIC GENERATIVE AI IN CHEMICAL CURRENT AND FUTURE END USER ANALYSIS, 2025–2034, (USD MILLION)
FIGURE 31 MARKET SHARE BY COUNTRY
FIGURE 32 SEA AND SOUTH ASIA GENERATIVE AI IN CHEMICAL CURRENT AND FUTURE TYPE ANALYSIS, 2025–2034, (USD MILLION)
FIGURE 33 SEA AND SOUTH ASIA GENERATIVE AI IN CHEMICAL CURRENT AND FUTURE END USER ANALYSIS, 2025–2034, (USD MILLION)
FIGURE 34 MARKET SHARE BY COUNTRY
FIGURE 35 MIDDLE EAST AND AFRICA GENERATIVE AI IN CHEMICAL CURRENT AND FUTURE TYPE ANALYSIS, 2025–2034, (USD MILLION)
FIGURE 36 MIDDLE EAST AND AFRICA GENERATIVE AI IN CHEMICAL CURRENT AND FUTURE END USER ANALYSIS, 2025–2034, (USD MILLION)
FIGURE 37 NORTH AMERICA GENERATIVE AI IN CHEMICAL CURRENT AND FUTURE MARKET VOLUME SHARE REGIONAL ANALYSIS, 2025–2034, (USD MILLION)
FIGURE 38 U.S. GENERATIVE AI IN CHEMICAL CURRENT AND FUTURE TYPE ANALYSIS, 2025–2034, (USD MILLION)
FIGURE 39 U.S. GENERATIVE AI IN CHEMICAL CURRENT AND FUTURE END USER ANALYSIS, 2025–2034, (USD MILLION)
FIGURE 40 CANADA GENERATIVE AI IN CHEMICAL CURRENT AND FUTURE TYPE ANALYSIS, 2025–2034, (USD MILLION)
FIGURE 41 CANADA GENERATIVE AI IN CHEMICAL CURRENT AND FUTURE END USER ANALYSIS, 2025–2034, (USD MILLION)
FIGURE 42 LATIN AMERICA GENERATIVE AI IN CHEMICAL CURRENT AND FUTURE MARKET VOLUME SHARE REGIONAL ANALYSIS, 2025–2034, (USD MILLION)
FIGURE 43 MEXICO GENERATIVE AI IN CHEMICAL CURRENT AND FUTURE TYPE ANALYSIS, 2025–2034, (USD MILLION)
FIGURE 44 MEXICO GENERATIVE AI IN CHEMICAL CURRENT AND FUTURE END USER ANALYSIS, 2025–2034, (USD MILLION)
FIGURE 45 BRAZIL GENERATIVE AI IN CHEMICAL CURRENT AND FUTURE TYPE ANALYSIS, 2025–2034, (USD MILLION)
FIGURE 46 BRAZIL GENERATIVE AI IN CHEMICAL CURRENT AND FUTURE END USER ANALYSIS, 2025–2034, (USD MILLION)
FIGURE 47 ARGENTINA GENERATIVE AI IN CHEMICAL CURRENT AND FUTURE TYPE ANALYSIS, 2025–2034, (USD MILLION)
FIGURE 48 ARGENTINA GENERATIVE AI IN CHEMICAL CURRENT AND FUTURE END USER ANALYSIS, 2025–2034, (USD MILLION)
FIGURE 49 COLUMBIA GENERATIVE AI IN CHEMICAL CURRENT AND FUTURE TYPE ANALYSIS, 2025–2034, (USD MILLION)
FIGURE 50 COLUMBIA GENERATIVE AI IN CHEMICAL CURRENT AND FUTURE END USER ANALYSIS, 2025–2034, (USD MILLION)
FIGURE 51 REST OF LATIN AMERICA GENERATIVE AI IN CHEMICAL CURRENT AND FUTURE TYPE ANALYSIS, 2025–2034, (USD MILLION)
FIGURE 52 REST OF LATIN AMERICA GENERATIVE AI IN CHEMICAL CURRENT AND FUTURE END USER ANALYSIS, 2025–2034, (USD MILLION)
FIGURE 53 EASTERN EUROPE GENERATIVE AI IN CHEMICAL CURRENT AND FUTURE MARKET VOLUME SHARE REGIONAL ANALYSIS, 2025–2034, (USD MILLION)
FIGURE 54 POLAND GENERATIVE AI IN CHEMICAL CURRENT AND FUTURE TYPE ANALYSIS, 2025–2034, (USD MILLION)
FIGURE 55 POLAND GENERATIVE AI IN CHEMICAL CURRENT AND FUTURE END USER ANALYSIS, 2025–2034, (USD MILLION)
FIGURE 56 RUSSIA GENERATIVE AI IN CHEMICAL CURRENT AND FUTURE TYPE ANALYSIS, 2025–2034, (USD MILLION)
FIGURE 57 RUSSIA GENERATIVE AI IN CHEMICAL CURRENT AND FUTURE END USER ANALYSIS, 2025–2034, (USD MILLION)
FIGURE 58 CZECH REPUBLIC GENERATIVE AI IN CHEMICAL CURRENT AND FUTURE TYPE ANALYSIS, 2025–2034, (USD MILLION)
FIGURE 59 CZECH REPUBLIC GENERATIVE AI IN CHEMICAL CURRENT AND FUTURE END USER ANALYSIS, 2025–2034, (USD MILLION)
FIGURE 60 ROMANIA GENERATIVE AI IN CHEMICAL CURRENT AND FUTURE TYPE ANALYSIS, 2025–2034, (USD MILLION)
FIGURE 61 ROMANIA GENERATIVE AI IN CHEMICAL CURRENT AND FUTURE END USER ANALYSIS, 2025–2034, (USD MILLION)
FIGURE 62 REST OF EASTERN EUROPE GENERATIVE AI IN CHEMICAL CURRENT AND FUTURE TYPE ANALYSIS, 2025–2034, (USD MILLION)
FIGURE 63 REST OF EASTERN EUROPE GENERATIVE AI IN CHEMICAL CURRENT AND FUTURE END USER ANALYSIS, 2025–2034, (USD MILLION)
FIGURE 64 WESTERN EUROPE GENERATIVE AI IN CHEMICAL CURRENT AND FUTURE MARKET VOLUME SHARE REGIONAL ANALYSIS, 2025–2034, (USD MILLION)
FIGURE 65 GERMANY GENERATIVE AI IN CHEMICAL CURRENT AND FUTURE TYPE ANALYSIS, 2025–2034, (USD MILLION)
FIGURE 66 GERMANY GENERATIVE AI IN CHEMICAL CURRENT AND FUTURE END USER ANALYSIS, 2025–2034, (USD MILLION)
FIGURE 67 FRANCE GENERATIVE AI IN CHEMICAL CURRENT AND FUTURE TYPE ANALYSIS, 2025–2034, (USD MILLION)
FIGURE 68 FRANCE GENERATIVE AI IN CHEMICAL CURRENT AND FUTURE END USER ANALYSIS, 2025–2034, (USD MILLION)
FIGURE 69 UK GENERATIVE AI IN CHEMICAL CURRENT AND FUTURE TYPE ANALYSIS, 2025–2034, (USD MILLION)
FIGURE 70 UK GENERATIVE AI IN CHEMICAL CURRENT AND FUTURE END USER ANALYSIS, 2025–2034, (USD MILLION)
FIGURE 71 SPAIN GENERATIVE AI IN CHEMICAL CURRENT AND FUTURE TYPE ANALYSIS, 2025–2034, (USD MILLION)
FIGURE 72 SPAIN GENERATIVE AI IN CHEMICAL CURRENT AND FUTURE END USER ANALYSIS, 2025–2034, (USD MILLION)
FIGURE 73 ITALY GENERATIVE AI IN CHEMICAL CURRENT AND FUTURE TYPE ANALYSIS, 2025–2034, (USD MILLION)
FIGURE 74 ITALY GENERATIVE AI IN CHEMICAL CURRENT AND FUTURE END USER ANALYSIS, 2025–2034, (USD MILLION)
FIGURE 75 REST OF WESTERN EUROPE GENERATIVE AI IN CHEMICAL CURRENT AND FUTURE TYPE ANALYSIS, 2025–2034, (USD MILLION)
FIGURE 76 REST OF WESTERN EUROPE GENERATIVE AI IN CHEMICAL CURRENT AND FUTURE END USER ANALYSIS, 2025–2034, (USD MILLION)
FIGURE 77 EAST ASIA AND PACIFIC GENERATIVE AI IN CHEMICAL CURRENT AND FUTURE MARKET VOLUME SHARE REGIONAL ANALYSIS, 2025–2034, (USD MILLION)
FIGURE 78 CHINA GENERATIVE AI IN CHEMICAL CURRENT AND FUTURE TYPE ANALYSIS, 2025–2034, (USD MILLION)
FIGURE 79 CHINA GENERATIVE AI IN CHEMICAL CURRENT AND FUTURE END USER ANALYSIS, 2025–2034, (USD MILLION)
FIGURE 80 JAPAN GENERATIVE AI IN CHEMICAL CURRENT AND FUTURE TYPE ANALYSIS, 2025–2034, (USD MILLION)
FIGURE 81 JAPAN GENERATIVE AI IN CHEMICAL CURRENT AND FUTURE END USER ANALYSIS, 2025–2034, (USD MILLION)
FIGURE 82 AUSTRALIA GENERATIVE AI IN CHEMICAL CURRENT AND FUTURE TYPE ANALYSIS, 2025–2034, (USD MILLION)
FIGURE 83 AUSTRALIA GENERATIVE AI IN CHEMICAL CURRENT AND FUTURE END USER ANALYSIS, 2025–2034, (USD MILLION)
FIGURE 84 CAMBODIA GENERATIVE AI IN CHEMICAL CURRENT AND FUTURE TYPE ANALYSIS, 2025–2034, (USD MILLION)
FIGURE 85 CAMBODIA GENERATIVE AI IN CHEMICAL CURRENT AND FUTURE END USER ANALYSIS, 2025–2034, (USD MILLION)
FIGURE 86 FIJI GENERATIVE AI IN CHEMICAL CURRENT AND FUTURE TYPE ANALYSIS, 2025–2034, (USD MILLION)
FIGURE 87 FIJI GENERATIVE AI IN CHEMICAL CURRENT AND FUTURE END USER ANALYSIS, 2025–2034, (USD MILLION)
FIGURE 88 INDONESIA GENERATIVE AI IN CHEMICAL CURRENT AND FUTURE TYPE ANALYSIS, 2025–2034, (USD MILLION)
FIGURE 89 INDONESIA GENERATIVE AI IN CHEMICAL CURRENT AND FUTURE END USER ANALYSIS, 2025–2034, (USD MILLION)
FIGURE 90 SOUTH KOREA GENERATIVE AI IN CHEMICAL CURRENT AND FUTURE TYPE ANALYSIS, 2025–2034, (USD MILLION)
FIGURE 91 SOUTH KOREA GENERATIVE AI IN CHEMICAL CURRENT AND FUTURE END USER ANALYSIS, 2025–2034, (USD MILLION)
FIGURE 92 REST OF EAST ASIA AND PACIFIC GENERATIVE AI IN CHEMICAL CURRENT AND FUTURE TYPE ANALYSIS, 2025–2034, (USD MILLION)
FIGURE 93 REST OF EAST ASIA AND PACIFIC GENERATIVE AI IN CHEMICAL CURRENT AND FUTURE END USER ANALYSIS, 2025–2034, (USD MILLION)
FIGURE 94 SEA AND SOUTH ASIA GENERATIVE AI IN CHEMICAL CURRENT AND FUTURE MARKET VOLUME SHARE REGIONAL ANALYSIS, 2025–2034, (USD MILLION)
FIGURE 95 BANGLADESH GENERATIVE AI IN CHEMICAL CURRENT AND FUTURE TYPE ANALYSIS, 2025–2034, (USD MILLION)
FIGURE 96 BANGLADESH GENERATIVE AI IN CHEMICAL CURRENT AND FUTURE END USER ANALYSIS, 2025–2034, (USD MILLION)
FIGURE 97 NEW ZEALAND GENERATIVE AI IN CHEMICAL CURRENT AND FUTURE TYPE ANALYSIS, 2025–2034, (USD MILLION)
FIGURE 98 NEW ZEALAND GENERATIVE AI IN CHEMICAL CURRENT AND FUTURE END USER ANALYSIS, 2025–2034, (USD MILLION)
FIGURE 99 INDIA GENERATIVE AI IN CHEMICAL CURRENT AND FUTURE TYPE ANALYSIS, 2025–2034, (USD MILLION)
FIGURE 100 INDIA GENERATIVE AI IN CHEMICAL CURRENT AND FUTURE END USER ANALYSIS, 2025–2034, (USD MILLION)
FIGURE 101 SINGAPORE GENERATIVE AI IN CHEMICAL CURRENT AND FUTURE TYPE ANALYSIS, 2025–2034, (USD MILLION)
FIGURE 102 SINGAPORE GENERATIVE AI IN CHEMICAL CURRENT AND FUTURE END USER ANALYSIS, 2025–2034, (USD MILLION)
FIGURE 103 THAILAND GENERATIVE AI IN CHEMICAL CURRENT AND FUTURE TYPE ANALYSIS, 2025–2034, (USD MILLION)
FIGURE 104 THAILAND GENERATIVE AI IN CHEMICAL CURRENT AND FUTURE END USER ANALYSIS, 2025–2034, (USD MILLION)
FIGURE 105 TAIWAN GENERATIVE AI IN CHEMICAL CURRENT AND FUTURE TYPE ANALYSIS, 2025–2034, (USD MILLION)
FIGURE 106 TAIWAN GENERATIVE AI IN CHEMICAL CURRENT AND FUTURE END USER ANALYSIS, 2025–2034, (USD MILLION)
FIGURE 107 MALAYSIA GENERATIVE AI IN CHEMICAL CURRENT AND FUTURE TYPE ANALYSIS, 2025–2034, (USD MILLION)
FIGURE 108 MALAYSIA GENERATIVE AI IN CHEMICAL CURRENT AND FUTURE END USER ANALYSIS, 2025–2034, (USD MILLION)
FIGURE 109 REST OF SEA AND SOUTH ASIA GENERATIVE AI IN CHEMICAL CURRENT AND FUTURE TYPE ANALYSIS, 2025–2034, (USD MILLION)
FIGURE 110 REST OF SEA AND SOUTH ASIA GENERATIVE AI IN CHEMICAL CURRENT AND FUTURE END USER ANALYSIS, 2025–2034, (USD MILLION)
FIGURE 111 MIDDLE EAST AND AFRICA GENERATIVE AI IN CHEMICAL CURRENT AND FUTURE MARKET VOLUME SHARE REGIONAL ANALYSIS, 2025–2034, (USD MILLION)
FIGURE 112 GCC COUNTRIES GENERATIVE AI IN CHEMICAL CURRENT AND FUTURE TYPE ANALYSIS, 2025–2034, (USD MILLION)
FIGURE 113 GCC COUNTRIES GENERATIVE AI IN CHEMICAL CURRENT AND FUTURE END USER ANALYSIS, 2025–2034, (USD MILLION)
FIGURE 114 SAUDI ARABIA GENERATIVE AI IN CHEMICAL CURRENT AND FUTURE TYPE ANALYSIS, 2025–2034, (USD MILLION)
FIGURE 115 SAUDI ARABIA GENERATIVE AI IN CHEMICAL CURRENT AND FUTURE END USER ANALYSIS, 2025–2034, (USD MILLION)
FIGURE 116 UAE GENERATIVE AI IN CHEMICAL CURRENT AND FUTURE TYPE ANALYSIS, 2025–2034, (USD MILLION)
FIGURE 117 UAE GENERATIVE AI IN CHEMICAL CURRENT AND FUTURE END USER ANALYSIS, 2025–2034, (USD MILLION)
FIGURE 118 BAHRAIN GENERATIVE AI IN CHEMICAL CURRENT AND FUTURE TYPE ANALYSIS, 2025–2034, (USD MILLION)
FIGURE 119 BAHRAIN GENERATIVE AI IN CHEMICAL CURRENT AND FUTURE END USER ANALYSIS, 2025–2034, (USD MILLION)
FIGURE 120 KUWAIT GENERATIVE AI IN CHEMICAL CURRENT AND FUTURE TYPE ANALYSIS, 2025–2034, (USD MILLION)
FIGURE 121 KUWAIT GENERATIVE AI IN CHEMICAL CURRENT AND FUTURE END USER ANALYSIS, 2025–2034, (USD MILLION)
FIGURE 122 OMAN GENERATIVE AI IN CHEMICAL CURRENT AND FUTURE TYPE ANALYSIS, 2025–2034, (USD MILLION)
FIGURE 123 OMAN GENERATIVE AI IN CHEMICAL CURRENT AND FUTURE END USER ANALYSIS, 2025–2034, (USD MILLION)
FIGURE 124 QATAR GENERATIVE AI IN CHEMICAL CURRENT AND FUTURE TYPE ANALYSIS, 2025–2034, (USD MILLION)
FIGURE 125 QATAR GENERATIVE AI IN CHEMICAL CURRENT AND FUTURE END USER ANALYSIS, 2025–2034, (USD MILLION)
FIGURE 126 EGYPT GENERATIVE AI IN CHEMICAL CURRENT AND FUTURE TYPE ANALYSIS, 2025–2034, (USD MILLION)
FIGURE 127 EGYPT GENERATIVE AI IN CHEMICAL CURRENT AND FUTURE END USER ANALYSIS, 2025–2034, (USD MILLION)
FIGURE 128 NIGERIA GENERATIVE AI IN CHEMICAL CURRENT AND FUTURE TYPE ANALYSIS, 2025–2034, (USD MILLION)
FIGURE 129 NIGERIA GENERATIVE AI IN CHEMICAL CURRENT AND FUTURE END USER ANALYSIS, 2025–2034, (USD MILLION)
FIGURE 130 SOUTH AFRICA GENERATIVE AI IN CHEMICAL CURRENT AND FUTURE TYPE ANALYSIS, 2025–2034, (USD MILLION)
FIGURE 131 SOUTH AFRICA GENERATIVE AI IN CHEMICAL CURRENT AND FUTURE END USER ANALYSIS, 2025–2034, (USD MILLION)
FIGURE 132 ISRAEL GENERATIVE AI IN CHEMICAL CURRENT AND FUTURE TYPE ANALYSIS, 2025–2034, (USD MILLION)
FIGURE 133 ISRAEL GENERATIVE AI IN CHEMICAL CURRENT AND FUTURE END USER ANALYSIS, 2025–2034, (USD MILLION)
FIGURE 134 REST OF MEA GENERATIVE AI IN CHEMICAL CURRENT AND FUTURE TYPE ANALYSIS, 2025–2034, (USD MILLION)
FIGURE 135 REST OF MEA GENERATIVE AI IN CHEMICAL CURRENT AND FUTURE END USER ANALYSIS, 2025–2034, (USD MILLION)
FIGURE 136 U. S. MARKET SHARE ANALYSIS BY TYPE (2024)
FIGURE 137 U. S. MARKET SHARE ANALYSIS BY END USER (2024)
FIGURE 138 CANADA MARKET SHARE ANALYSIS BY TYPE (2024)
FIGURE 139 CANADA MARKET SHARE ANALYSIS BY END USER (2024)
FIGURE 140 MEXICO MARKET SHARE ANALYSIS BY TYPE (2024)
FIGURE 141 MEXICO MARKET SHARE ANALYSIS BY END USER (2024)
FIGURE 142 CHINA MARKET SHARE ANALYSIS BY TYPE (2024)
FIGURE 143 CHINA MARKET SHARE ANALYSIS BY END USER (2024)
FIGURE 144 JAPAN MARKET SHARE ANALYSIS BY TYPE (2024)
FIGURE 145 JAPAN MARKET SHARE ANALYSIS BY END USER (2024)
FIGURE 146 INDIA MARKET SHARE ANALYSIS BY TYPE (2024)
FIGURE 147 INDIA MARKET SHARE ANALYSIS BY END USER (2024)
FIGURE 148 SOUTH KOREA MARKET SHARE ANALYSIS BY TYPE (2024)
FIGURE 149 SOUTH KOREA MARKET SHARE ANALYSIS BY END USER (2024)
FIGURE 150 SAUDI ARABIA MARKET SHARE ANALYSIS BY TYPE (2024)
FIGURE 151 SAUDI ARABIA MARKET SHARE ANALYSIS BY END USER (2024)
FIGURE 152 UAE MARKET SHARE ANALYSIS BY TYPE (2024)
FIGURE 153 UAE MARKET SHARE ANALYSIS BY END USER (2024)
FIGURE 154 EGYPT MARKET SHARE ANALYSIS BY TYPE (2024)
FIGURE 155 EGYPT MARKET SHARE ANALYSIS BY END USER (2024)
FIGURE 156 NIGERIA MARKET SHARE ANALYSIS BY TYPE (2024)
FIGURE 157 NIGERIA MARKET SHARE ANALYSIS BY END USER (2024)
FIGURE 158 SOUTH AFRICA MARKET SHARE ANALYSIS BY TYPE (2024)
FIGURE 159 SOUTH AFRICA MARKET SHARE ANALYSIS BY END USER (2024)
FIGURE 160 GERMANY MARKET SHARE ANALYSIS BY TYPE (2024)
FIGURE 161 GERMANY MARKET SHARE ANALYSIS BY END USER (2024)
FIGURE 162 FRANCE MARKET SHARE ANALYSIS BY TYPE (2024)
FIGURE 163 FRANCE MARKET SHARE ANALYSIS BY END USER (2024)
FIGURE 164 UK MARKET SHARE ANALYSIS BY TYPE (2024)
FIGURE 165 UK MARKET SHARE ANALYSIS BY END USER (2024)
FIGURE 166 SPAIN MARKET SHARE ANALYSIS BY TYPE (2024)
FIGURE 167 SPAIN MARKET SHARE ANALYSIS BY END USER (2024)
FIGURE 168 ITALY MARKET SHARE ANALYSIS BY TYPE (2024)
FIGURE 169 ITALY MARKET SHARE ANALYSIS BY END USER (2024)
FIGURE 170 BRAZIL MARKET SHARE ANALYSIS BY TYPE (2024)
FIGURE 171 BRAZIL MARKET SHARE ANALYSIS BY END USER (2024)
FIGURE 172 ARGENTINA MARKET SHARE ANALYSIS BY TYPE (2024)
FIGURE 173 ARGENTINA MARKET SHARE ANALYSIS BY END USER (2024)
FIGURE 174 COLUMBIA MARKET SHARE ANALYSIS BY TYPE (2024)
FIGURE 175 COLUMBIA MARKET SHARE ANALYSIS BY END USER (2024)
FIGURE 176 GLOBAL GENERATIVE AI IN CHEMICAL CURRENT AND FUTURE MARKET KEY COUNTRY LEVEL ANALYSIS, 2024–2034, (USD MILLION)
FIGURE 177 FINANCIAL OVERVIEW:
Key Player Analysis
Mitsui Chemicals: Mitsui Chemicals holds a leader position in the generative AI in chemical applications. The company strengthens its portfolio by deploying AI-driven molecular design tools across polymer development, catalysts, and specialty materials. It integrates machine learning with long-standing expertise in chemical synthesis to shorten development cycles and improve formulation accuracy. Internal programs launched between 2023 and 2025 show measurable gains in R&D efficiency, with reported reductions of up to 20 percent in early-stage screening times. Mitsui Chemicals expands partnerships with software firms and universities to advance AI-supported property prediction for sustainable materials. The company’s broad manufacturing base in Japan and Southeast Asia gives it strong control over scale-up and customer alignment, which differentiates its position in the market.
Accenture: Accenture acts as a challenger and system integrator within the generative AI in chemical market. The firm focuses on deploying enterprise AI frameworks, digital engineering platforms, and data governance systems for global chemical producers. Its analytics and cloud migration services help clients introduce AI into R&D pipelines, pilot automated laboratories, and restructure manufacturing workflows. Accenture reports strong demand in 2024 and 2025 for AI transformation programs in Europe and North America, with chemical accounts contributing to a steady rise in its industry vertical revenue. The company invests in joint innovation centers with leading chemical companies to develop domain-specific generative AI models. Accenture differentiates itself through its global consulting footprint and ability to integrate AI with existing ERP and plant systems.
Azelis Group NV: Azelis Group NV positions itself as a niche player that uses generative AI to strengthen formulation support for customers across personal care, home care, and specialty chemical segments. The company operates a large technical services network and increasingly relies on AI-enabled formulation engines to provide faster recommendations and improve product matching. These tools help Azelis handle large volumes of customer requests with higher accuracy, which increases conversion rates and supports regional growth. Azelis expands its digital labs and data infrastructure across Europe and Asia Pacific to support AI-driven formulation trials. Its differentiator lies in its distributor model combined with technical expertise, which enables the company to deliver AI-informed solutions directly to mid-sized manufacturers that lack in-house R&D capabilities.
Market Key Players
Sinochem Corporation
Accenture
Biesterfeld AG
IBM Corporation
Tricon Energy Inc.
Omya AG
Mitsui Chemicals
Azelis Group NV
HELM AG
Google
Other Key Players
Driver
Accelerated R&D Cycles and Faster Time-to-Market
By 2025, chemical producers will face more pressure to shorten development timelines and respond quickly to regulatory and customer needs. Generative AI addresses this challenge by screening large compound libraries, predicting structure-property relationships, and guiding formulation decisions in hours instead of months. Early adopters report a 20 to 40% reduction in early-stage development cycles, along with significant savings in experimental costs.
Cost Efficiency and Competitive Product Pipelines
These efficiency improvements help you introduce new materials, additives, and specialty chemicals more quickly while meeting compliance and safety standards. Speeding up R&D without expanding laboratory capacity boosts competitiveness and supports higher-margin product pipelines, especially in specialty, performance, and advanced materials segments.
Restraint
High Upfront Investment and Technical Complexity
Adoption remains uneven because of the significant upfront investments and the complexity of the systems involved. Companies often need to build new data infrastructure, acquire AI models specific to their domain, and retrain technical staff before seeing measurable returns. Larger chemical producers can absorb these costs, but small and mid-sized firms encounter serious financial and operational hurdles.
Integration Challenges and Digital Readiness Gaps
Integration issues further delay deployment when generative AI tools must connect with older laboratory information systems or plant control platforms. These problems widen the gap between companies that are digitally advanced and those that are not. Consequently, AI adoption moves more slowly in firms that lack strong digital transformation capabilities.
Opportunity
Sustainability-Driven Innovation and Compliance
Sustainability goals present a significant opportunity for generative AI to transform chemical development and manufacturing practices. By 2025, over 60% of global chemical companies plan to actively initiatives aimed at reducing emissions and improving resource efficiency. Generative models support these efforts by identifying low-carbon reaction pathways and alternatives to harmful substances.
Expansion of AI-Enabled Green Chemistry Markets
AI-driven sustainable chemistry is expected to surpass USD 1.2 billion by 2030, boosted by stricter regulations and growing demand for eco-friendly materials. You can use generative AI to lower operational risks and create new revenue opportunities in biodegradable polymers, green solvents, and recycled or bio-based feedstocks.
Trend
Integration of Sustainability and Custom Molecular Design
AI-driven sustainable chemistry is accelerating as producers incorporate life-cycle assessment metrics directly into generative design workflows. At the same time, custom molecular design is gaining traction in pharmaceuticals, electronics, and advanced materials, where precise control over structure and performance is key for niche applications.
Expansion Toward Digital Twins and Advanced Computing
Quantum computing pilots are pushing the boundaries of chemical simulation by enhancing accuracy for complex reactions beyond the limits of traditional models. Meanwhile, digital twins are becoming more popular in large manufacturing sites, enabling real-time scenario testing and predictive process optimization. Together, these trends are moving generative AI from isolated projects to a central capability that connects R&D, scale-up, and plant operations.
Recent Developments
Dec 2024 – Mitsui Chemicals: Mitsui Chemicals announced an internal patent chat platform based on generative AI, designed to read experimental data tables and chemical structures and cut in-house patent search time by up to 80 percent. This move strengthens its R&D productivity and underpins wider use of generative AI in chemical product development workflows.
Jan 2025 – IBM and L'Oréal: IBM and L'Oréal launched a collaboration to build a generative AI model for cosmetic formulation that mines large formulation datasets to promote the use of sustainable raw materials and reduce energy and material waste. The partnership positions IBM as a key AI technology provider for specialty chemicals and supports L'Oréal’s push toward lower-impact formulations.
Jan 2025 – Microsoft Research: Microsoft Research introduced MatterGen, a diffusion-based generative model for inorganic materials that directly generates crystal structures with target mechanical, electronic, or magnetic properties and more than doubles the share of stable, unique new materials versus prior models. This release advances foundation-model approaches for material and chemical design and sets a new technical benchmark for AI tools used by chemical and materials R&D teams.
Jun 2025 – Matlantis (PFCC): PFCC announced a corporate name change to Matlantis to align with its Matlantis cloud-based atomistic simulator, already used by more than 100 companies and organizations for AI-supported materials discovery. The rebrand clarifies its identity as a specialist platform provider for AI-driven molecular and materials modeling in chemical-intensive industries.
Aug 2025 – Merck KGaA / MilliporeSigma: MilliporeSigma introduced AIDDISON Explorer, a cloud platform that combines generative AI molecule design with predictive ADMET modeling and synthesis planning to speed up hit discovery and lead optimization for small molecules. The launch broadens commercial access to AI-based molecular design capabilities and helps Merck KGaA deepen its role in AI-supported chemistry and drug discovery.
Sep 2025 – CuspAI: CuspAI, a Cambridge-based startup focused on generative AI for materials discovery, secured a Series A round of more than EUR 85 million to scale its platform for automotive, semiconductor, energy, and climate applications. The funding round signals strong investor confidence in generative AI for chemical and materials design and introduces a well-capitalized challenger into collaboration discussions with large industrial and chemical groups.