Generative AI in Waste Management Market Size & 23.4% CAGR
Global Generative AI in Waste Management Market Size, Share & Technology Analysis By Solution (AI Forecasting, Computer Vision, Smart Sorting, Route Optimization), By Application (Recycling, Landfills, Smart Cities), By End User (Municipalities, Industrial, Commercial), ESG Impact, Key Players, Digital Waste Trends & Forecast 2025–2034
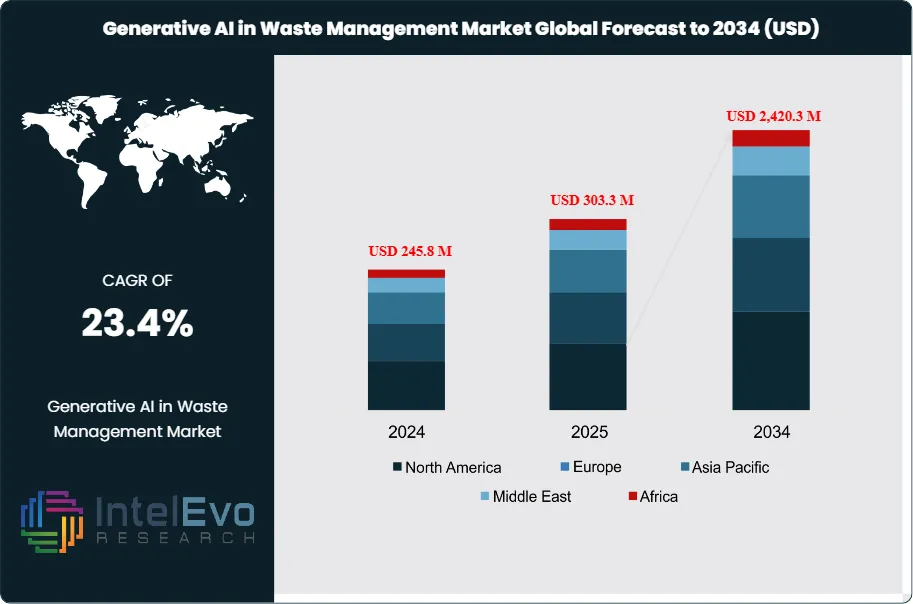
The Generative AI in Waste Management Market is estimated at USD 245.8 million in 2024 and is projected to reach approximately USD 2,420.3 million by 2034, registering a strong CAGR of about 23.4% during 2025–2034. This accelerated growth is driven by rising adoption of AI-powered waste sorting, route optimization, and predictive maintenance across municipal and commercial waste operations. Generative AI models are increasingly deployed to improve material recovery rates, reduce landfill diversion costs, and enhance real-time decision-making in material recovery facilities. In parallel, stricter recycling mandates, labor shortages, and the need for operational efficiency are positioning generative AI as a core technology within next-generation, data-driven waste management ecosystems.
You are seeing a shift from pilot projects to scaled deployments across collection, sorting, and landfill operations. Cost pressure, labor shortages, and rising regulatory standards push adoption. Collection can represent up to 60 percent of operating costs; AI route planning and dynamic dispatch cut mileage and fuel use by double digits. Contamination in mixed recyclables often exceeds 20 percent; real‑time computer vision increases purity and yield. In March 2024, SUEZ reported up to a 90 percent recovery rate for secondary raw materials, supported by 99 percent line visibility using advanced scanners and AI, versus roughly 1 percent coverage with manual sampling. A 2023 Greyparrot study found residue streams in Europe, the United States, and Asia still contain 37 percent paper and cardboard and 26 percent recyclable plastics; the loss highlights immediate recovery upside.
Demand grows in large manufacturing and processing sites that need traceable waste flows and lower disposal fees. Landfill operators use AI to forecast compaction and settlement; better placement and timing extend cell life and defer new site development. Cities deploy smart bins with sensors; alerts reduce overflow and lift collection satisfaction scores. On the supply side, vendors combine cameras, hyperspectral sensors, and robotic arms; models now identify over 50 material classes in real time. Integrations with weighbridges and ERP systems close data gaps; predictive maintenance lowers unplanned downtime on MRF lines.
Policy tailwinds matter. The EU Waste Framework, EPR schemes, and landfill restrictions tighten targets; Europe leads deployments and funding. North America accelerates AI‑enabled MRF upgrades and fleet routing; you should expect strong public‑private projects. Asia Pacific posts the fastest growth on urban build‑out and rising waste volumes; China, Japan, and South Korea are key buyers.
The Middle East and Latin America advance via smart city programs and donor‑backed pilots. Investors watch computer vision sorting, landfill modeling software, AI SaaS for routing and contamination analytics, and robotics retrofits of existing lines. Key risks persist; data quality, integration with legacy equipment, model accuracy on soiled materials, and procurement cycles can slow rollout. Vendors that prove payback within 12 to 24 months will win share.
Key Takeaways
Market Growth: The market reached USD 245.8 million in 2024 and is projected to hit USD 2,420.3 million by 2034 at a 23.4% CAGR, driven by digitization of collection and sorting, rising industrial waste volumes, and compliance pressure across regions. You should plan for sustained investment cycles in AI-enabled routing, sorting, and maintenance as operators target measurable cost and yield gains.
Segment Dominance - Component: Solutions led revenues in 2023 as operators prioritized computer vision, routing engines, and landfill modeling; services supported deployments and training at scale. Quantified outcomes include a 13% fuel reduction from AI routing at a UK firm and a 25% route efficiency uplift at a US operator.
Segment Dominance - Application: Waste Sorting and Segregation was the top application in 2023, reflecting rapid computer vision rollout at MRFs and transfer stations. Residue analytics show immediate upside: 37% paper and cardboard and 26% recyclable plastics still appear in residue streams, signaling recoverable value for you to capture.
Segment Dominance - End User: Waste Management Companies were the leading adopters in 2023, focusing on cost-to-serve reduction, purity, and uptime across fleets and MRF lines. Municipalities and local governments formed the second-largest group, scaling AI for smart collection, contamination control, and service KPIs.
Driver: Performance proof points are clear; SUEZ reports up to a 90% recovery rate supported by AI and advanced scanners with 99% visibility versus 1% manual sampling coverage, improving purity and secondary material yield. Route optimization and predictive maintenance further cut fuel, downtime, and overflow incidents, strengthening payback cases.
Restraint: High upfront costs for data infrastructure, sensors, and integration slow adoption among smaller operators, extending sales cycles. Workforce resistance and change management needs can delay deployments unless you budget for training and phased rollouts.
Opportunity: AI SaaS for route optimization, predictive maintenance, and residue analytics offers near-term ROI; target retrofits that raise capture of high-loss materials highlighted by residue data. You can prioritize computer vision modules and model updates that convert missed paper and plastics into sellable tonnage.
Trend: Computer vision is scaling across MRFs; Greyparrot documented billions of detected items and quantified material losses on residue lines, guiding operational setpoints and investment. Vendors are bundling analytics with integrations to weighbridges and ERPs, enabling real-time decisions and measurable yield gains.
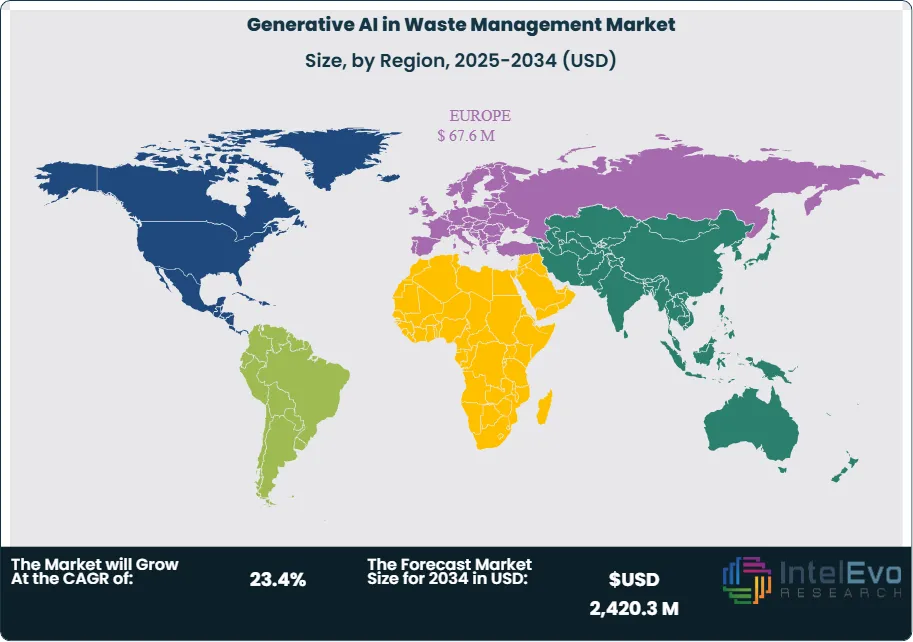
Regional Analysis: Europe leads with a 27.50% share, supported by strict policy, EPR schemes, and funded upgrades to AI-enabled sorting and routing. North America is accelerating MRF and fleet deployments, while Asia Pacific shows rapid adoption as urbanization and waste growth push AI-led efficiency programs.
Application Analysis
Waste sorting and segregation remains the anchor use case, accounting for over 38% of AI in waste management revenue in 2023 and staying at the center of 2025 deployment roadmaps for material recovery and purity improvement. You can point to field metrics such as up to 120 picks per minute as evidence that AI-led sortation can support higher throughput without expanding labor, improving line stability and bale quality. Scaling datasets strengthen model performance; one leading provider reported 40 billion detected waste objects across 55 facilities in 20 countries in 2024, underscoring rapid maturation of vision systems that your teams can tap for SKU-level insights.
Predictive maintenance is moving from pilots to systematic rollouts across MRF equipment and collection fleets as operators target uptime and lower maintenance costs in a market projected to reach USD 18.2 billion by 2033 at a 27.5% CAGR. GenAI layered on IoT telemetry supports failure forecasting and work order automation for optical sorters, conveyors, balers, and trucks, which helps you cut unplanned stops and align parts inventory with actual condition signals.
Route planning and dynamic scheduling integrate with fill-level sensors and geospatial data in digital waste platforms that are sized at USD 3.36 billion in 2025, creating clear pathways to fuel, overtime, and service reliability gains for your contracts. Other applications include demand forecasting, contamination analytics, and regulatory reporting within broader environmental AI programs that are attracting growing budgets for sustainability outcomes.
End-Use Analysis
Waste management companies are the primary adopters of generative AI tools, leading purchases for sortation, fleet planning, and decision analytics as they seek measurable productivity and margin gains you can validate in quarterly KPIs. Software accounted for about 42.5% of AI spending in 2023, reflecting a platform-first approach that you can scale across multi-site networks and mixed OEM environments.
Municipalities and local governments are expanding smart collection and MRF modernization, supported by North America’s 36.9% share of the AI in waste management market and growing public expectations on recycling performance and transparency. You gain service reliability and citizen reporting benefits when city contracts include AI-enabled route planning, contamination detection, and automated compliance dashboards.
Commercial and industrial facilities are adding AI sorting and analytics to meet packaging recovery, brand commitments, and regulatory requirements, with deployments now spanning 20 countries across public and private sites. You can use these systems to track material flow by brand or polymer and feed procurement decisions and EPR reporting with near real-time evidence.
Regional Analysis
Europe holds about 27.5% of generative AI in waste management, supported by strict policy frameworks, EPR schemes, and advanced recycling infrastructure that accelerate procurement and commissioning cycles for your projects. You see faster adoption in markets such as Germany and the Nordics where regulation, automation budgets, and data availability align with enterprise-scale rollouts.
North America leads the broader AI in waste management market with 36.9% share, anchored by private MRF operators, robotics OEMs, and data platforms that can retrofit brownfield sites at pace. Field case work shows high pick rates and measurable purity improvement from AI sorting lines, which supports your investment cases for phased modernization across aging facilities.
Asia Pacific is positioned for the fastest growth through 2033 as urbanization, extended producer responsibility, and capacity expansion drive AI adoption in sortation and logistics that you can stage in major metros first. Latin America and the Middle East and Africa are in early adoption phases, with pilots clustering around large cities and integrated utilities that will set reference architectures for your regional scale-up plans.
By Component, Hardware, Software, Services, By Technology, Machine Learning, Natural Language Processing, Computer Vision, Other Technologies, By Application, Waste Sorting and Segregation, Predictive Maintenance, Route Optimization, Other Applications
Research Methodology
Primary Research- 100 Interviews of Stakeholders
Secondary Research
Desk Research
Regional scope
North America (United States, Canada, Mexico)
Latin America (Brazil, Argentina, Columbia)
East Asia And Pacific (China, Japan, South Korea, Australia, Cambodia, Fiji, Indonesia)
Sea And South Asia (India, Singapore, Thailand, Taiwan, Malaysia)
Eastern Europe (Poland, Russia, Czech Republic, Romania)
Western Europe (Germany, U.K., France, Spain, Itlay)
Middle East & Africa (GCC Countries, Egypt, Nigeria, South Africa, Israel)
Competitive Landscape
ABB Group, Intuitive AI, Microsoft Corporation, AMP Robotics Corporation, CleanRobotics, IBM Corporation, Rubicon, Greyparrot AI Ltd., TOMRA Systems ASA, Terex Corporation, Other Key Players
Customization Scope
Customization for segments, region/country-level will be provided. Moreover, additional customization can be done based on the requirements.
Pricing and Purchase Options
Avail customized purchase options to meet your exact research needs. We have three licenses to opt for: Single User License, Multi-User License (Up to 5 Users), Corporate Use License (Unlimited User and Printable PDF).
TABLE OF CONTENTS
1. EXECUTIVE SUMMARY
1.1. MARKET SNAPSHOT
1.2. KEY FINDINGS & INSIGHTS
1.3. ANALYST RECOMMENDATIONS
1.4. FUTURE OUTLOOK
2. RESEARCH METHODOLOGY
2.1. MARKET DEFINITION & SCOPE
2.2. RESEARCH OBJECTIVES: PRIMARY & SECONDARY DATA SOURCES
2.3. DATA COLLECTION SOURCES
2.3.1. COVERAGE OF 100+ PRIMARY RESEARCH/CONSULTATION CALLS WITH INDUSTRY STAKEHOLDERS
FIGURE 17 NORTH AMERICA GENERATIVE AI IN WASTE MANAGEMENT CURRENT AND FUTURE TYPE ANALYSIS, 2025–2034, (USD MILLION)
FIGURE 18 NORTH AMERICA GENERATIVE AI IN WASTE MANAGEMENT CURRENT AND FUTURE END USER ANALYSIS, 2025–2034, (USD MILLION)
FIGURE 19 MARKET SHARE BY COUNTRY
FIGURE 20 LATIN AMERICA GENERATIVE AI IN WASTE MANAGEMENT CURRENT AND FUTURE TYPE ANALYSIS, 2025–2034, (USD MILLION)
FIGURE 21 LATIN AMERICA GENERATIVE AI IN WASTE MANAGEMENT CURRENT AND FUTURE END USER ANALYSIS, 2025–2034, (USD MILLION)
FIGURE 22 MARKET SHARE BY COUNTRY
FIGURE 23 EASTERN EUROPE GENERATIVE AI IN WASTE MANAGEMENT CURRENT AND FUTURE TYPE ANALYSIS, 2025–2034, (USD MILLION)
FIGURE 24 EASTERN EUROPE GENERATIVE AI IN WASTE MANAGEMENT CURRENT AND FUTURE END USER ANALYSIS, 2025–2034, (USD MILLION)
FIGURE 25 MARKET SHARE BY COUNTRY
FIGURE 26 WESTERN EUROPE GENERATIVE AI IN WASTE MANAGEMENT CURRENT AND FUTURE TYPE ANALYSIS, 2025–2034, (USD MILLION)
FIGURE 27 WESTERN EUROPE GENERATIVE AI IN WASTE MANAGEMENT CURRENT AND FUTURE END USER ANALYSIS, 2025–2034, (USD MILLION)
FIGURE 28 MARKET SHARE BY COUNTRY
FIGURE 29 EAST ASIA AND PACIFIC GENERATIVE AI IN WASTE MANAGEMENT CURRENT AND FUTURE TYPE ANALYSIS, 2025–2034, (USD MILLION)
FIGURE 30 EAST ASIA AND PACIFIC GENERATIVE AI IN WASTE MANAGEMENT CURRENT AND FUTURE END USER ANALYSIS, 2025–2034, (USD MILLION)
FIGURE 31 MARKET SHARE BY COUNTRY
FIGURE 32 SEA AND SOUTH ASIA GENERATIVE AI IN WASTE MANAGEMENT CURRENT AND FUTURE TYPE ANALYSIS, 2025–2034, (USD MILLION)
FIGURE 33 SEA AND SOUTH ASIA GENERATIVE AI IN WASTE MANAGEMENT CURRENT AND FUTURE END USER ANALYSIS, 2025–2034, (USD MILLION)
FIGURE 34 MARKET SHARE BY COUNTRY
FIGURE 35 MIDDLE EAST AND AFRICA GENERATIVE AI IN WASTE MANAGEMENT CURRENT AND FUTURE TYPE ANALYSIS, 2025–2034, (USD MILLION)
FIGURE 36 MIDDLE EAST AND AFRICA GENERATIVE AI IN WASTE MANAGEMENT CURRENT AND FUTURE END USER ANALYSIS, 2025–2034, (USD MILLION)
FIGURE 37 NORTH AMERICA GENERATIVE AI IN WASTE MANAGEMENT CURRENT AND FUTURE MARKET VOLUME SHARE REGIONAL ANALYSIS, 2025–2034, (USD MILLION)
FIGURE 38 U.S. GENERATIVE AI IN WASTE MANAGEMENT CURRENT AND FUTURE TYPE ANALYSIS, 2025–2034, (USD MILLION)
FIGURE 39 U.S. GENERATIVE AI IN WASTE MANAGEMENT CURRENT AND FUTURE END USER ANALYSIS, 2025–2034, (USD MILLION)
FIGURE 40 CANADA GENERATIVE AI IN WASTE MANAGEMENT CURRENT AND FUTURE TYPE ANALYSIS, 2025–2034, (USD MILLION)
FIGURE 41 CANADA GENERATIVE AI IN WASTE MANAGEMENT CURRENT AND FUTURE END USER ANALYSIS, 2025–2034, (USD MILLION)
FIGURE 42 LATIN AMERICA GENERATIVE AI IN WASTE MANAGEMENT CURRENT AND FUTURE MARKET VOLUME SHARE REGIONAL ANALYSIS, 2025–2034, (USD MILLION)
FIGURE 43 MEXICO GENERATIVE AI IN WASTE MANAGEMENT CURRENT AND FUTURE TYPE ANALYSIS, 2025–2034, (USD MILLION)
FIGURE 44 MEXICO GENERATIVE AI IN WASTE MANAGEMENT CURRENT AND FUTURE END USER ANALYSIS, 2025–2034, (USD MILLION)
FIGURE 45 BRAZIL GENERATIVE AI IN WASTE MANAGEMENT CURRENT AND FUTURE TYPE ANALYSIS, 2025–2034, (USD MILLION)
FIGURE 46 BRAZIL GENERATIVE AI IN WASTE MANAGEMENT CURRENT AND FUTURE END USER ANALYSIS, 2025–2034, (USD MILLION)
FIGURE 47 ARGENTINA GENERATIVE AI IN WASTE MANAGEMENT CURRENT AND FUTURE TYPE ANALYSIS, 2025–2034, (USD MILLION)
FIGURE 48 ARGENTINA GENERATIVE AI IN WASTE MANAGEMENT CURRENT AND FUTURE END USER ANALYSIS, 2025–2034, (USD MILLION)
FIGURE 49 COLUMBIA GENERATIVE AI IN WASTE MANAGEMENT CURRENT AND FUTURE TYPE ANALYSIS, 2025–2034, (USD MILLION)
FIGURE 50 COLUMBIA GENERATIVE AI IN WASTE MANAGEMENT CURRENT AND FUTURE END USER ANALYSIS, 2025–2034, (USD MILLION)
FIGURE 51 REST OF LATIN AMERICA GENERATIVE AI IN WASTE MANAGEMENT CURRENT AND FUTURE TYPE ANALYSIS, 2025–2034, (USD MILLION)
FIGURE 52 REST OF LATIN AMERICA GENERATIVE AI IN WASTE MANAGEMENT CURRENT AND FUTURE END USER ANALYSIS, 2025–2034, (USD MILLION)
FIGURE 53 EASTERN EUROPE GENERATIVE AI IN WASTE MANAGEMENT CURRENT AND FUTURE MARKET VOLUME SHARE REGIONAL ANALYSIS, 2025–2034, (USD MILLION)
FIGURE 54 POLAND GENERATIVE AI IN WASTE MANAGEMENT CURRENT AND FUTURE TYPE ANALYSIS, 2025–2034, (USD MILLION)
FIGURE 55 POLAND GENERATIVE AI IN WASTE MANAGEMENT CURRENT AND FUTURE END USER ANALYSIS, 2025–2034, (USD MILLION)
FIGURE 56 RUSSIA GENERATIVE AI IN WASTE MANAGEMENT CURRENT AND FUTURE TYPE ANALYSIS, 2025–2034, (USD MILLION)
FIGURE 57 RUSSIA GENERATIVE AI IN WASTE MANAGEMENT CURRENT AND FUTURE END USER ANALYSIS, 2025–2034, (USD MILLION)
FIGURE 58 CZECH REPUBLIC GENERATIVE AI IN WASTE MANAGEMENT CURRENT AND FUTURE TYPE ANALYSIS, 2025–2034, (USD MILLION)
FIGURE 59 CZECH REPUBLIC GENERATIVE AI IN WASTE MANAGEMENT CURRENT AND FUTURE END USER ANALYSIS, 2025–2034, (USD MILLION)
FIGURE 60 ROMANIA GENERATIVE AI IN WASTE MANAGEMENT CURRENT AND FUTURE TYPE ANALYSIS, 2025–2034, (USD MILLION)
FIGURE 61 ROMANIA GENERATIVE AI IN WASTE MANAGEMENT CURRENT AND FUTURE END USER ANALYSIS, 2025–2034, (USD MILLION)
FIGURE 62 REST OF EASTERN EUROPE GENERATIVE AI IN WASTE MANAGEMENT CURRENT AND FUTURE TYPE ANALYSIS, 2025–2034, (USD MILLION)
FIGURE 63 REST OF EASTERN EUROPE GENERATIVE AI IN WASTE MANAGEMENT CURRENT AND FUTURE END USER ANALYSIS, 2025–2034, (USD MILLION)
FIGURE 64 WESTERN EUROPE GENERATIVE AI IN WASTE MANAGEMENT CURRENT AND FUTURE MARKET VOLUME SHARE REGIONAL ANALYSIS, 2025–2034, (USD MILLION)
FIGURE 65 GERMANY GENERATIVE AI IN WASTE MANAGEMENT CURRENT AND FUTURE TYPE ANALYSIS, 2025–2034, (USD MILLION)
FIGURE 66 GERMANY GENERATIVE AI IN WASTE MANAGEMENT CURRENT AND FUTURE END USER ANALYSIS, 2025–2034, (USD MILLION)
FIGURE 67 FRANCE GENERATIVE AI IN WASTE MANAGEMENT CURRENT AND FUTURE TYPE ANALYSIS, 2025–2034, (USD MILLION)
FIGURE 68 FRANCE GENERATIVE AI IN WASTE MANAGEMENT CURRENT AND FUTURE END USER ANALYSIS, 2025–2034, (USD MILLION)
FIGURE 69 UK GENERATIVE AI IN WASTE MANAGEMENT CURRENT AND FUTURE TYPE ANALYSIS, 2025–2034, (USD MILLION)
FIGURE 70 UK GENERATIVE AI IN WASTE MANAGEMENT CURRENT AND FUTURE END USER ANALYSIS, 2025–2034, (USD MILLION)
FIGURE 71 SPAIN GENERATIVE AI IN WASTE MANAGEMENT CURRENT AND FUTURE TYPE ANALYSIS, 2025–2034, (USD MILLION)
FIGURE 72 SPAIN GENERATIVE AI IN WASTE MANAGEMENT CURRENT AND FUTURE END USER ANALYSIS, 2025–2034, (USD MILLION)
FIGURE 73 ITALY GENERATIVE AI IN WASTE MANAGEMENT CURRENT AND FUTURE TYPE ANALYSIS, 2025–2034, (USD MILLION)
FIGURE 74 ITALY GENERATIVE AI IN WASTE MANAGEMENT CURRENT AND FUTURE END USER ANALYSIS, 2025–2034, (USD MILLION)
FIGURE 75 REST OF WESTERN EUROPE GENERATIVE AI IN WASTE MANAGEMENT CURRENT AND FUTURE TYPE ANALYSIS, 2025–2034, (USD MILLION)
FIGURE 76 REST OF WESTERN EUROPE GENERATIVE AI IN WASTE MANAGEMENT CURRENT AND FUTURE END USER ANALYSIS, 2025–2034, (USD MILLION)
FIGURE 77 EAST ASIA AND PACIFIC GENERATIVE AI IN WASTE MANAGEMENT CURRENT AND FUTURE MARKET VOLUME SHARE REGIONAL ANALYSIS, 2025–2034, (USD MILLION)
FIGURE 78 CHINA GENERATIVE AI IN WASTE MANAGEMENT CURRENT AND FUTURE TYPE ANALYSIS, 2025–2034, (USD MILLION)
FIGURE 79 CHINA GENERATIVE AI IN WASTE MANAGEMENT CURRENT AND FUTURE END USER ANALYSIS, 2025–2034, (USD MILLION)
FIGURE 80 JAPAN GENERATIVE AI IN WASTE MANAGEMENT CURRENT AND FUTURE TYPE ANALYSIS, 2025–2034, (USD MILLION)
FIGURE 81 JAPAN GENERATIVE AI IN WASTE MANAGEMENT CURRENT AND FUTURE END USER ANALYSIS, 2025–2034, (USD MILLION)
FIGURE 82 AUSTRALIA GENERATIVE AI IN WASTE MANAGEMENT CURRENT AND FUTURE TYPE ANALYSIS, 2025–2034, (USD MILLION)
FIGURE 83 AUSTRALIA GENERATIVE AI IN WASTE MANAGEMENT CURRENT AND FUTURE END USER ANALYSIS, 2025–2034, (USD MILLION)
FIGURE 84 CAMBODIA GENERATIVE AI IN WASTE MANAGEMENT CURRENT AND FUTURE TYPE ANALYSIS, 2025–2034, (USD MILLION)
FIGURE 85 CAMBODIA GENERATIVE AI IN WASTE MANAGEMENT CURRENT AND FUTURE END USER ANALYSIS, 2025–2034, (USD MILLION)
FIGURE 86 FIJI GENERATIVE AI IN WASTE MANAGEMENT CURRENT AND FUTURE TYPE ANALYSIS, 2025–2034, (USD MILLION)
FIGURE 87 FIJI GENERATIVE AI IN WASTE MANAGEMENT CURRENT AND FUTURE END USER ANALYSIS, 2025–2034, (USD MILLION)
FIGURE 88 INDONESIA GENERATIVE AI IN WASTE MANAGEMENT CURRENT AND FUTURE TYPE ANALYSIS, 2025–2034, (USD MILLION)
FIGURE 89 INDONESIA GENERATIVE AI IN WASTE MANAGEMENT CURRENT AND FUTURE END USER ANALYSIS, 2025–2034, (USD MILLION)
FIGURE 90 SOUTH KOREA GENERATIVE AI IN WASTE MANAGEMENT CURRENT AND FUTURE TYPE ANALYSIS, 2025–2034, (USD MILLION)
FIGURE 91 SOUTH KOREA GENERATIVE AI IN WASTE MANAGEMENT CURRENT AND FUTURE END USER ANALYSIS, 2025–2034, (USD MILLION)
FIGURE 92 REST OF EAST ASIA AND PACIFIC GENERATIVE AI IN WASTE MANAGEMENT CURRENT AND FUTURE TYPE ANALYSIS, 2025–2034, (USD MILLION)
FIGURE 93 REST OF EAST ASIA AND PACIFIC GENERATIVE AI IN WASTE MANAGEMENT CURRENT AND FUTURE END USER ANALYSIS, 2025–2034, (USD MILLION)
FIGURE 94 SEA AND SOUTH ASIA GENERATIVE AI IN WASTE MANAGEMENT CURRENT AND FUTURE MARKET VOLUME SHARE REGIONAL ANALYSIS, 2025–2034, (USD MILLION)
FIGURE 95 BANGLADESH GENERATIVE AI IN WASTE MANAGEMENT CURRENT AND FUTURE TYPE ANALYSIS, 2025–2034, (USD MILLION)
FIGURE 96 BANGLADESH GENERATIVE AI IN WASTE MANAGEMENT CURRENT AND FUTURE END USER ANALYSIS, 2025–2034, (USD MILLION)
FIGURE 97 NEW ZEALAND GENERATIVE AI IN WASTE MANAGEMENT CURRENT AND FUTURE TYPE ANALYSIS, 2025–2034, (USD MILLION)
FIGURE 98 NEW ZEALAND GENERATIVE AI IN WASTE MANAGEMENT CURRENT AND FUTURE END USER ANALYSIS, 2025–2034, (USD MILLION)
FIGURE 99 INDIA GENERATIVE AI IN WASTE MANAGEMENT CURRENT AND FUTURE TYPE ANALYSIS, 2025–2034, (USD MILLION)
FIGURE 100 INDIA GENERATIVE AI IN WASTE MANAGEMENT CURRENT AND FUTURE END USER ANALYSIS, 2025–2034, (USD MILLION)
FIGURE 101 SINGAPORE GENERATIVE AI IN WASTE MANAGEMENT CURRENT AND FUTURE TYPE ANALYSIS, 2025–2034, (USD MILLION)
FIGURE 102 SINGAPORE GENERATIVE AI IN WASTE MANAGEMENT CURRENT AND FUTURE END USER ANALYSIS, 2025–2034, (USD MILLION)
FIGURE 103 THAILAND GENERATIVE AI IN WASTE MANAGEMENT CURRENT AND FUTURE TYPE ANALYSIS, 2025–2034, (USD MILLION)
FIGURE 104 THAILAND GENERATIVE AI IN WASTE MANAGEMENT CURRENT AND FUTURE END USER ANALYSIS, 2025–2034, (USD MILLION)
FIGURE 105 TAIWAN GENERATIVE AI IN WASTE MANAGEMENT CURRENT AND FUTURE TYPE ANALYSIS, 2025–2034, (USD MILLION)
FIGURE 106 TAIWAN GENERATIVE AI IN WASTE MANAGEMENT CURRENT AND FUTURE END USER ANALYSIS, 2025–2034, (USD MILLION)
FIGURE 107 MALAYSIA GENERATIVE AI IN WASTE MANAGEMENT CURRENT AND FUTURE TYPE ANALYSIS, 2025–2034, (USD MILLION)
FIGURE 108 MALAYSIA GENERATIVE AI IN WASTE MANAGEMENT CURRENT AND FUTURE END USER ANALYSIS, 2025–2034, (USD MILLION)
FIGURE 109 REST OF SEA AND SOUTH ASIA GENERATIVE AI IN WASTE MANAGEMENT CURRENT AND FUTURE TYPE ANALYSIS, 2025–2034, (USD MILLION)
FIGURE 110 REST OF SEA AND SOUTH ASIA GENERATIVE AI IN WASTE MANAGEMENT CURRENT AND FUTURE END USER ANALYSIS, 2025–2034, (USD MILLION)
FIGURE 111 MIDDLE EAST AND AFRICA GENERATIVE AI IN WASTE MANAGEMENT CURRENT AND FUTURE MARKET VOLUME SHARE REGIONAL ANALYSIS, 2025–2034, (USD MILLION)
FIGURE 112 GCC COUNTRIES GENERATIVE AI IN WASTE MANAGEMENT CURRENT AND FUTURE TYPE ANALYSIS, 2025–2034, (USD MILLION)
FIGURE 113 GCC COUNTRIES GENERATIVE AI IN WASTE MANAGEMENT CURRENT AND FUTURE END USER ANALYSIS, 2025–2034, (USD MILLION)
FIGURE 114 SAUDI ARABIA GENERATIVE AI IN WASTE MANAGEMENT CURRENT AND FUTURE TYPE ANALYSIS, 2025–2034, (USD MILLION)
FIGURE 115 SAUDI ARABIA GENERATIVE AI IN WASTE MANAGEMENT CURRENT AND FUTURE END USER ANALYSIS, 2025–2034, (USD MILLION)
FIGURE 116 UAE GENERATIVE AI IN WASTE MANAGEMENT CURRENT AND FUTURE TYPE ANALYSIS, 2025–2034, (USD MILLION)
FIGURE 117 UAE GENERATIVE AI IN WASTE MANAGEMENT CURRENT AND FUTURE END USER ANALYSIS, 2025–2034, (USD MILLION)
FIGURE 118 BAHRAIN GENERATIVE AI IN WASTE MANAGEMENT CURRENT AND FUTURE TYPE ANALYSIS, 2025–2034, (USD MILLION)
FIGURE 119 BAHRAIN GENERATIVE AI IN WASTE MANAGEMENT CURRENT AND FUTURE END USER ANALYSIS, 2025–2034, (USD MILLION)
FIGURE 120 KUWAIT GENERATIVE AI IN WASTE MANAGEMENT CURRENT AND FUTURE TYPE ANALYSIS, 2025–2034, (USD MILLION)
FIGURE 121 KUWAIT GENERATIVE AI IN WASTE MANAGEMENT CURRENT AND FUTURE END USER ANALYSIS, 2025–2034, (USD MILLION)
FIGURE 122 OMAN GENERATIVE AI IN WASTE MANAGEMENT CURRENT AND FUTURE TYPE ANALYSIS, 2025–2034, (USD MILLION)
FIGURE 123 OMAN GENERATIVE AI IN WASTE MANAGEMENT CURRENT AND FUTURE END USER ANALYSIS, 2025–2034, (USD MILLION)
FIGURE 124 QATAR GENERATIVE AI IN WASTE MANAGEMENT CURRENT AND FUTURE TYPE ANALYSIS, 2025–2034, (USD MILLION)
FIGURE 125 QATAR GENERATIVE AI IN WASTE MANAGEMENT CURRENT AND FUTURE END USER ANALYSIS, 2025–2034, (USD MILLION)
FIGURE 126 EGYPT GENERATIVE AI IN WASTE MANAGEMENT CURRENT AND FUTURE TYPE ANALYSIS, 2025–2034, (USD MILLION)
FIGURE 127 EGYPT GENERATIVE AI IN WASTE MANAGEMENT CURRENT AND FUTURE END USER ANALYSIS, 2025–2034, (USD MILLION)
FIGURE 128 NIGERIA GENERATIVE AI IN WASTE MANAGEMENT CURRENT AND FUTURE TYPE ANALYSIS, 2025–2034, (USD MILLION)
FIGURE 129 NIGERIA GENERATIVE AI IN WASTE MANAGEMENT CURRENT AND FUTURE END USER ANALYSIS, 2025–2034, (USD MILLION)
FIGURE 130 SOUTH AFRICA GENERATIVE AI IN WASTE MANAGEMENT CURRENT AND FUTURE TYPE ANALYSIS, 2025–2034, (USD MILLION)
FIGURE 131 SOUTH AFRICA GENERATIVE AI IN WASTE MANAGEMENT CURRENT AND FUTURE END USER ANALYSIS, 2025–2034, (USD MILLION)
FIGURE 132 ISRAEL GENERATIVE AI IN WASTE MANAGEMENT CURRENT AND FUTURE TYPE ANALYSIS, 2025–2034, (USD MILLION)
FIGURE 133 ISRAEL GENERATIVE AI IN WASTE MANAGEMENT CURRENT AND FUTURE END USER ANALYSIS, 2025–2034, (USD MILLION)
FIGURE 134 REST OF MEA GENERATIVE AI IN WASTE MANAGEMENT CURRENT AND FUTURE TYPE ANALYSIS, 2025–2034, (USD MILLION)
FIGURE 135 REST OF MEA GENERATIVE AI IN WASTE MANAGEMENT CURRENT AND FUTURE END USER ANALYSIS, 2025–2034, (USD MILLION)
FIGURE 136 U. S. MARKET SHARE ANALYSIS BY TYPE (2024)
FIGURE 137 U. S. MARKET SHARE ANALYSIS BY END USER (2024)
FIGURE 138 CANADA MARKET SHARE ANALYSIS BY TYPE (2024)
FIGURE 139 CANADA MARKET SHARE ANALYSIS BY END USER (2024)
FIGURE 140 MEXICO MARKET SHARE ANALYSIS BY TYPE (2024)
FIGURE 141 MEXICO MARKET SHARE ANALYSIS BY END USER (2024)
FIGURE 142 CHINA MARKET SHARE ANALYSIS BY TYPE (2024)
FIGURE 143 CHINA MARKET SHARE ANALYSIS BY END USER (2024)
FIGURE 144 JAPAN MARKET SHARE ANALYSIS BY TYPE (2024)
FIGURE 145 JAPAN MARKET SHARE ANALYSIS BY END USER (2024)
FIGURE 146 INDIA MARKET SHARE ANALYSIS BY TYPE (2024)
FIGURE 147 INDIA MARKET SHARE ANALYSIS BY END USER (2024)
FIGURE 148 SOUTH KOREA MARKET SHARE ANALYSIS BY TYPE (2024)
FIGURE 149 SOUTH KOREA MARKET SHARE ANALYSIS BY END USER (2024)
FIGURE 150 SAUDI ARABIA MARKET SHARE ANALYSIS BY TYPE (2024)
FIGURE 151 SAUDI ARABIA MARKET SHARE ANALYSIS BY END USER (2024)
FIGURE 152 UAE MARKET SHARE ANALYSIS BY TYPE (2024)
FIGURE 153 UAE MARKET SHARE ANALYSIS BY END USER (2024)
FIGURE 154 EGYPT MARKET SHARE ANALYSIS BY TYPE (2024)
FIGURE 155 EGYPT MARKET SHARE ANALYSIS BY END USER (2024)
FIGURE 156 NIGERIA MARKET SHARE ANALYSIS BY TYPE (2024)
FIGURE 157 NIGERIA MARKET SHARE ANALYSIS BY END USER (2024)
FIGURE 158 SOUTH AFRICA MARKET SHARE ANALYSIS BY TYPE (2024)
FIGURE 159 SOUTH AFRICA MARKET SHARE ANALYSIS BY END USER (2024)
FIGURE 160 GERMANY MARKET SHARE ANALYSIS BY TYPE (2024)
FIGURE 161 GERMANY MARKET SHARE ANALYSIS BY END USER (2024)
FIGURE 162 FRANCE MARKET SHARE ANALYSIS BY TYPE (2024)
FIGURE 163 FRANCE MARKET SHARE ANALYSIS BY END USER (2024)
FIGURE 164 UK MARKET SHARE ANALYSIS BY TYPE (2024)
FIGURE 165 UK MARKET SHARE ANALYSIS BY END USER (2024)
FIGURE 166 SPAIN MARKET SHARE ANALYSIS BY TYPE (2024)
FIGURE 167 SPAIN MARKET SHARE ANALYSIS BY END USER (2024)
FIGURE 168 ITALY MARKET SHARE ANALYSIS BY TYPE (2024)
FIGURE 169 ITALY MARKET SHARE ANALYSIS BY END USER (2024)
FIGURE 170 BRAZIL MARKET SHARE ANALYSIS BY TYPE (2024)
FIGURE 171 BRAZIL MARKET SHARE ANALYSIS BY END USER (2024)
FIGURE 172 ARGENTINA MARKET SHARE ANALYSIS BY TYPE (2024)
FIGURE 173 ARGENTINA MARKET SHARE ANALYSIS BY END USER (2024)
FIGURE 174 COLUMBIA MARKET SHARE ANALYSIS BY TYPE (2024)
FIGURE 175 COLUMBIA MARKET SHARE ANALYSIS BY END USER (2024)
FIGURE 176 GLOBAL GENERATIVE AI IN WASTE MANAGEMENT CURRENT AND FUTURE MARKET KEY COUNTRY LEVEL ANALYSIS, 2024–2034, (USD MILLION)
FIGURE 177 FINANCIAL OVERVIEW:
Key Player Analysis
IBM Corporation: IBM is positioned as a leader for enterprise AI and sustainability platforms applicable to asset-intensive waste operations where predictive maintenance, compliance, and reporting drive procurement in 2025. Expanding digital waste solution spend toward USD 3.36 billion in 2025 creates a clear runway for AI governance, data integration, and decision support capabilities that align with municipal and private operators modernizing fleets and MRFs.
Strategic focus includes scaling generative AI for planning and executive reporting in regulated environments, which maps to a generative AI segment tracking a 23.6% CAGR to USD 1.70 billion by 2033 and requires robust controls across data and models. Differentiation stems from cross-industry sustainability and environmental AI investments that support KPI automation and ESG disclosures, which executives use to defend budgets and meet policy obligations.
Amazon Web Services, Inc.: AWS is a leader with cloud AI, data, and IoT services used by waste technology partners to deploy computer vision, route optimization, and analytics at scale as the broader AI in waste management market expands toward USD 18.2 billion by 2033. The digital waste stack at USD 3.36 billion in 2025 supports migration of sensor feeds, telemetry, and operational data into cloud-native architectures for your smart collection and MRF automation programs.
Strategic initiatives in 2025 emphasize managed generative AI and industry data platforms tied to smart waste adoption trends, which you can apply to contamination analytics, service reliability dashboards, and EPR-aligned reporting. Differentiation comes from breadth of AI building blocks and partner ecosystems that reduce time-to-value for municipal and private operators scaling from pilots to multi-site deployments.
Microsoft Corporation: Microsoft is a leader with Azure AI and sustainability data solutions aligned to municipal and enterprise waste customers pursuing automation, governance, and transparent reporting within expanding environmental AI budgets. Demand concentrates in AI-enabled sorting, predictive maintenance, and decision analytics, requiring cloud MLOps and data controls that Azure positions across multi-plant and multi-city portfolios you manage.
2025 priorities include generative AI copilots and standardized data models that connect to digital waste platforms growing at low-teens rates, supporting automated KPI tracking, audit trails, and board-level ESG narratives. Differentiation reflects integration with productivity and reporting stacks used by city and enterprise accounts to operationalize AI outputs across finance, operations, and compliance.
CleanRobotics: CleanRobotics is an innovator focused on point-of-disposal AI sorting with TrashBot, reporting up to 95–96% stream accuracy and deployments in airports, hospitals, and stadiums that let you cut contamination at the source. Public references cite 90%+ accuracy versus typical manual bins near 30%, framing a clear upgrade for high-traffic facilities with mixed and variable waste streams.
Strategy centers on layering education and analytics over hardware, using captured waste data to inform user behavior and facility reporting as programs scale in 2025. This complements downstream analytics at MRFs where datasets exceeded 40 billion object detections in 2024, enabling end-to-end insights from disposal to recovery that support contract performance and brand reporting.
Market Key Players
ABB Group
Intuitive AI
Microsoft Corporation
AMP Robotics Corporation
CleanRobotics
IBM Corporation
Rubicon
Greyparrot AI Ltd.
TOMRA Systems ASA
Terex Corporation
Other Key Players
Driver
Cost Reduction and Compliance Targets Speed Up AI Adoption
By 2025, buyers are investing in AI initiatives to cut down on route miles, fuel use, and overtime while meeting stricter recycling and landfill diversion goals in major regions. AI-driven route planning and dynamic dispatch are showing real gains. Reported deployments are achieving around 13% fuel savings and double-digit improvements in route efficiency. These results directly address margin pressure and service requirements, making a strong case for AI investment in municipal and commercial waste operations.
Proven Sorting and Visibility Gains Support Near-Term Growth
The potential for near-term growth remains strong as the overall AI in waste management market approaches USD 2.6 billion in 2025. The generative AI segment is expected to grow at a 23.6% compound annual growth rate (CAGR) through 2033. Evidence from materials recovery facility (MRF) leaders supports these claims. Reported recovery rates are reaching up to 90%, backed by almost complete line visibility from scanners and AI analytics. This shows clear improvements in sorting yield and downtime reduction that resonate with decision-makers.
Restraint
High Upfront Investment Slows Adoption Among Smaller Operators
High initial costs for sensors, cameras, edge computing, and system integration are hindering adoption, especially for smaller operators. Procurement cycles are often longer as capital expenses compete with other infrastructure needs, delaying large-scale rollouts. For many organizations, the initial investment makes expected returns fall outside of annual budgeting periods, slowing near-term deployment.
Integration Complexity and Sustainability Scrutiny Add Risk
Integrating complex retrofits into old MRF lines and municipal IT systems increases project risk and requires specialized integration services. Meanwhile, scrutiny over sustainability is growing. Large-scale generative AI models raise concerns about electricity and water use, leading environmental teams to assess the net benefits against facility-level energy intensity before greenlighting pilots. These factors complicate decision-making and can hamper rapid scaling.
Opportunity
Untapped Recovery Potential Creates Immediate Value
There is immediate upside in material recovery within existing sorting lines. Residue analyses show that 37% of paper and cardboard and 26% of recyclable plastics are still in residue streams, resulting in significant material loss. Targeted use of computer vision and advanced analytics can quickly enhance capture rates, providing quick wins that boost ROI and support broader AI adoption across facilities.
Scalable Software and Policy-Aligned Demand Expand Addressable Market
Software-based modules for route optimization, predictive maintenance, and contamination analytics can scale efficiently under SaaS models, fitting well within operating budgets. The AI in waste management market is predicted to hit USD 18.2 billion by 2033, supporting multi-year product development plans and consolidation strategies. Europe’s anticipated 27.5% market share reflects strong funding aligned with policy goals, while the USD 86.1 billion U.S. waste collection industry in 2025 presents a large base for retrofit programs and outcome-based contracts.
Trend
AI Becomes a Standard Tool in Sorting and Facility Operations
Computer vision and AI analytics are transitioning from pilot projects to standard operating tools in MRFs and transfer stations. Waste sorting and segregation are still the largest application area, with vendors increasingly bundling model updates with ERP, weighbridge, and asset management integrations. This enables real-time operational decisions and performance tracking.
Platformization and Sustainability Metrics Shape Deployment Choices
Digital waste management platforms are growing steadily, expanding at about a 13% CAGR through the 2030s. They provide the data infrastructure needed for effective AI deployment. At the same time, sustainability teams are closely monitoring the environmental impact of AI models, especially generative systems. This scrutiny shapes model choice, inference setups, and edge-versus-cloud deployment strategies, affecting AI roadmaps throughout the sector.
Recent Developments
Dec 2024 – Greyparrot: Reported 40 billion waste objects detected across 55 facilities in 20 countries, expanding training data and strengthening computer vision accuracy for sorting and packaging analytics. This scale positions the company to power SKU-level insights and near real-time quality control for your recovery lines.
Feb 2025 – Waste Management, Inc.: Announced plans to automate thousands of roles through attrition while advancing AI-enabled MRF upgrades and fleet operations to improve productivity and safety. The move signals scaled adoption of AI across North American contracts and supports margin expansion and service reliability in your municipal portfolios.
Apr 2025 – Routeware: Released an enhanced route optimization suite and customer tooling targeting double-digit improvements in route miles and overtime reduction across integrated smart collection workflows. The update gives you an immediate pathway to fuel and service KPIs, accelerating ROI for digital waste programs.
Jun 2025 – Unilever, Amcor, and Asahi: Launched a trial of a “world-first” AI recyclability data platform to standardize packaging assessments and accelerate design-for-recycling decisions across brand portfolios. The collaboration creates a shared data backbone that you can align with EPR reporting and material recovery targets at scale.
Sep 2025 – Greyparrot: Introduced its next‑generation Analyzer with backing from Build-Collective, adding higher-throughput recognition and packaging intelligence capabilities for MRFs and brand owners. The product broadens use cases from bale QA to brand-level analytics, strengthening competitive differentiation in AI waste intelligence you can deploy across multiple sites.